


On-chain analysis week 24 / 2025: What is happening to Bitcoin?
Bitcoin has fallen nearly 6.5% from its ATH, despite increased profit-taking from Long-Term Holders (LTHs), selling pressure has yet to overcome accumulation as “maturation” behavior prevails.
6/18/20259 min read
Market Summary
The psychological $100,000 level continues to act as a psychological support, with demand clearly re-emerging. Bitcoin may be looking to this support price zone.
Technically, $97,600 (Short-Term Holder Cost Basis – STH-CB) is seen as a key support level , while $115,400 is identified as the first resistance level in the price discovery phase .
Implied Volatility on the 1-month is 38% , down from 46% two weeks ago, the options market is underestimating the likelihood of a big move , while on-chain indicators show a large volume cluster accumulating near the spot price.
Although the realized profits of this group are high, the selling behavior is still limited within the control frame , when HODL waves > 1y is still at 67.4%, higher than the 5-year average (64.1%).
The amount of BTC in motion remains below the warning level (Activity Rate < 1.2%), confirming that LTHs are not selling en masse , but are just rebalancing their portfolios.
According to the HODL Waves > 1y model: 67.8% of the total circulating supply is held by LTHs - an unprecedented high in the late stages of the growth cycle. This is a factor that reduces the risk of sudden distribution , strengthening the bullish momentum.
Bitcoin is forming a sustainable recovery structure , based on clear technical support, real money flow dynamics, and steady accumulation behavior from investor groups.
Onchain Metrics Analysis
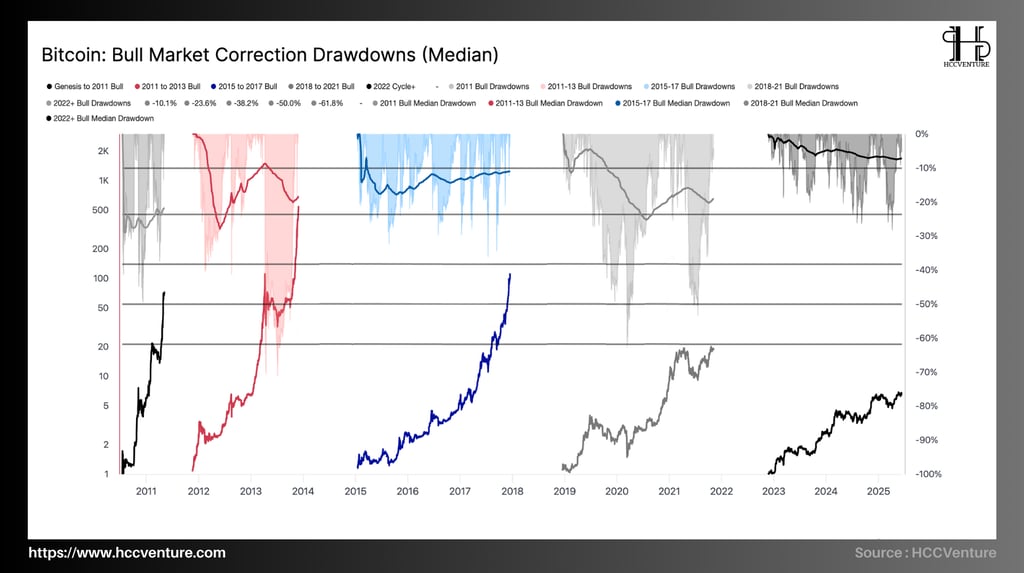
In the 2022 to 2025 cycle, the largest correction value in the cycle (Max drawdown) is around -9% from the peak. The decrease rate of only -9% from the most recent ATH peak is a clear sign of cash flow strength and price holding force , never seen in previous cycles. In which:
The percentage of days with a decrease greater than -9% was 41.4% (384/928 days).
Median Drawdown is -7%
The current Bitcoin bull cycle is maintaining a relatively shallow and stable correction , demonstrating a higher maturity and sustainability of the market structure . Compared to previous cycles, Bitcoin does not have many opportunities for price breakthroughs in this cycle.
The median correction in the 2022–2025 bull cycle is the lowest since Bitcoin's inception , representing a ~70% decrease in volatility compared to the 2015–2017 period .
384 days (out of 928 days from the beginning of the cycle) had a drawdown > 9% → large corrections are no longer common , showing that market sentiment is well controlled.
The 2022–2025 Bitcoin bull cycle is exhibiting the most resilient structure in history , with a median correction of just -7% – the lowest in any cycle since Genesis.
→ Reduced volatility , limited deep drawdowns , stable capital flows and lack of panic selling are characteristics of this cycle.
→ These factors reinforce the academic view that Bitcoin has transitioned from a speculative asset to a long-term macro accumulation asset , equivalent to digital gold.
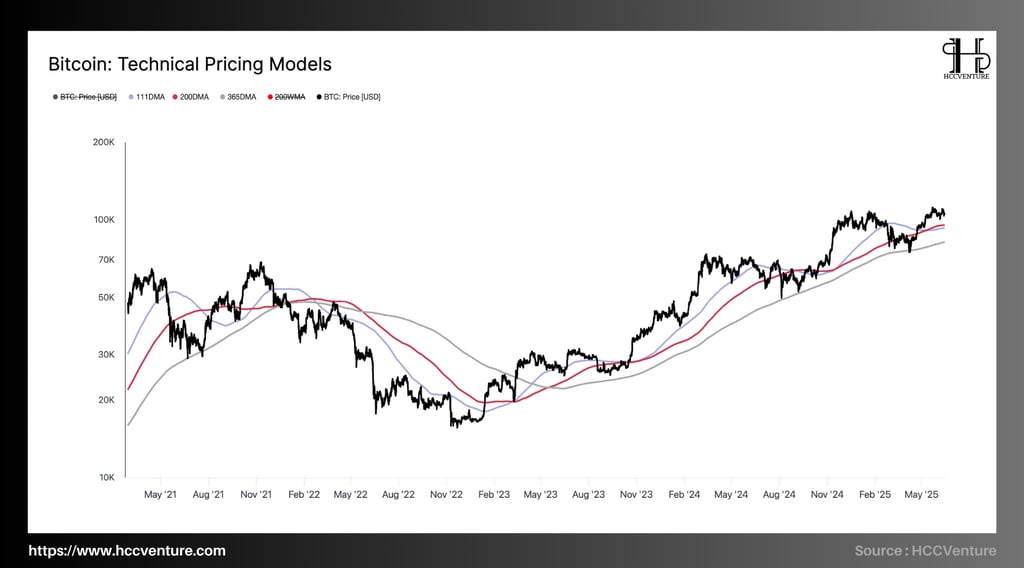
Price remains above all three important MAs , a technical condition that often occurs during a bull phase acceleration .
BTC is trading 13.3% above the 111DMA , 24.8% above the 365DMA → extremely strong structure .
The price difference is expressed through:
Compared to 111DMA, 13.9% above MA -> the market is maintaining strong momentum through continuous cash flow.
Compared to 200DMA above 11.1% of MA -> Medium term Momentum is still very strong.
Compared to 365DMA above 29.8% of MA -> long term sustainable state.
These levels correspond to the October 2020 period before Bitcoin entered the acceleration phase from $15k to $65k in the 2020–2021 cycle.
Current market behavior shows that Bitcoin is in a solid uptrend maintenance phase , with all important moving averages holding and remaining steadily below the current price .
BTC is trading within the “momentum cluster” zone of $92.9k–$95.4k, holding above this zone is a must to maintain the bullish structure. The macro support level of 365DMA at $81.7k will act as a safe bottom zone if a correction occurs.
Medium-term assessment strategy:
Continue to allocate in the $92.9k–$100k range as a safe accumulation zone.
Hold position if there is no break below 200DMA ($95.4k).
Take advantage of the not-so-high volatility to deploy Covered Call or Delta-Neutral Options strategies.
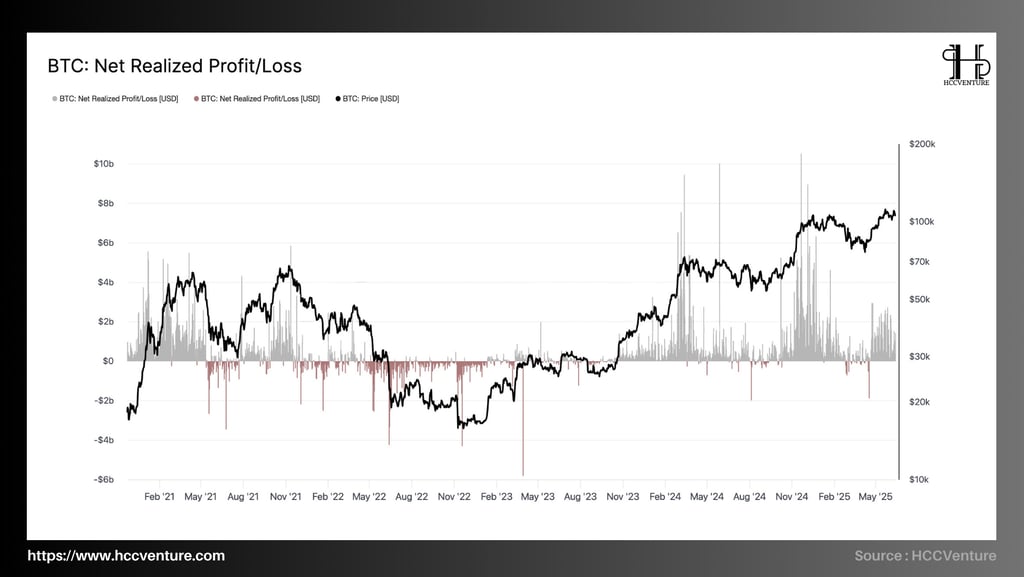
The Net Realized Profit/Loss metric measures the net realized profit or loss each day across the entire Bitcoin network. It currently stands at ~ $5.7B realized profit/day.
The most recent peak of the Realized Profit index in May 2025 was $9.3B/day — the highest since the breakout to $100k.
Realized Loss is low and stable , only fluctuating around $100–$250M/day , accounting for less than 5% of total on-chain transaction value .
In the early May 2025 period (BTC reached $108k), the Net Realized Profit index of LTHs reached $930M/day , approaching the peak of $1.64B/day of the previous cycle (early 2021).
Compared to when BTC hit $73k (March 2024), that number is only $840M/day , showing that the current distribution is significantly higher .
LTH Realized P/L Ratio reached 9.4M, an outstanding high , in the top 15.8% group of the highest days in history (884/5601 days) .
This ratio shows that most of the long-term supply is spent in a state of large profits , implying that many holders are taking advantage of this price zone to realize long-term accumulated profits.
Net Realized Profit/Loss data shows that Bitcoin is in a state of strong yet sustainable profit realization , with a cash flow structure that is not dominated by panic selling or leveraged selling:
Growth remains strong as new cash flows absorb profit-taking pressure well.
LTHs are distributing some profits, but have not yet reached the “mass distribution” level of the cycle peak.
Price sustaining above $100k shows institutional demand is supporting the high price zone.
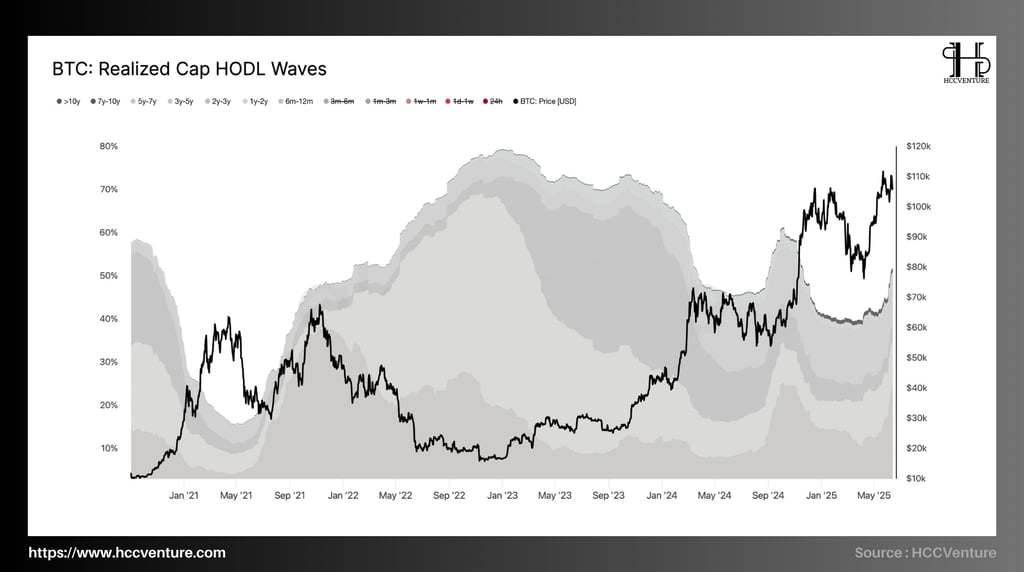
Realized Cap HODL Waves is an indicator that shows the proportion of Bitcoin's Realized Cap classified by UTXO (unspent coins) age.
The proportion of realized capitalization belonging to coins >6 months accounts for ~72% of total Realized Cap (highest since the beginning of 2022). Of which:
Coin >1 year : ~ 54%
Coin >5 years : ~ 28% (near all-time high)
Coins under 3 months (1m–3m, 1w–1m, <1w): only account for ~9% of total Realized Cap.
While LTH spending volume increases , the HODLing ratio continues to increase , reflecting a systematic and sustainable accumulation behavior.
Data shows that despite the large amount of realized profits peaking at $9.3B/day, the total amount of long-term BTC holdings has not decreased , but instead increased significantly .
→ Negates the traditional distribution pattern of previous bull market cycles , where the late-cycle phase is always accompanied by large-scale dumping by Long-Term Holders (LTHs) .
Coins from 2014–2017 (7y–10y) still make up a significant portion and barely move .
→ The sustainability of this group shows confidence in long-term value and a tendency to “lock in supply” that is not affected by short-term fluctuations.
The rapid increase in the proportion of long-term coin holdings is closely related to the explosion of financial products such as Spot Bitcoin ETFs in the US (BlackRock, Fidelity, Ark).
Institutional investors tend to hold long-term custody of digital assets through custodial solutions like Coinbase Custody or BitGo, increasing the amount of BTC “sitting” on-chain (illiquid supply).

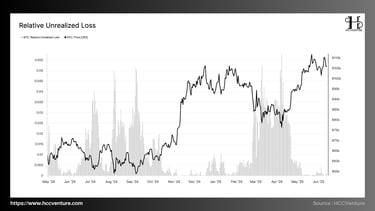
Relative Unrealized Loss (RUL) is the percentage of market capitalization that is undervalued compared to the average purchase price (strike price). The figure represents:
Current RUL Index : ≈ 0.0045 – Lowest level since Q4/2020 growth.
Latest RUL peak : ≈ 0.055 at the end of March 2025 – coincides with a sharp correction from the $112,300 peak to $76,000 (-32%).
RUL trend in the last 30 days : continuous and stable decrease, in line with the strong recovery of BTC price from $85,000 to the $110,000 area .
The RUL index is maintaining at a historical low, reflecting a market state in which unrealized losses are almost completely eliminated . There is no selling pressure from “cut-loss” psychology or short-term panic.
However, the price drop did not lead to a mass exodus but instead created a clear liquidity absorption zone (according to data from CoinGlass: Open Interest did not decrease suddenly, funding rate was stable).
After the price recovery, the RUL index contracted rapidly , confirming that investors did not sell off at the bottom – instead, they accumulated and held positions .
The Bitcoin market is currently in a stable equilibrium, with extremely low unrealized losses, reflecting strong investor confidence and almost non-existent selling pressure.
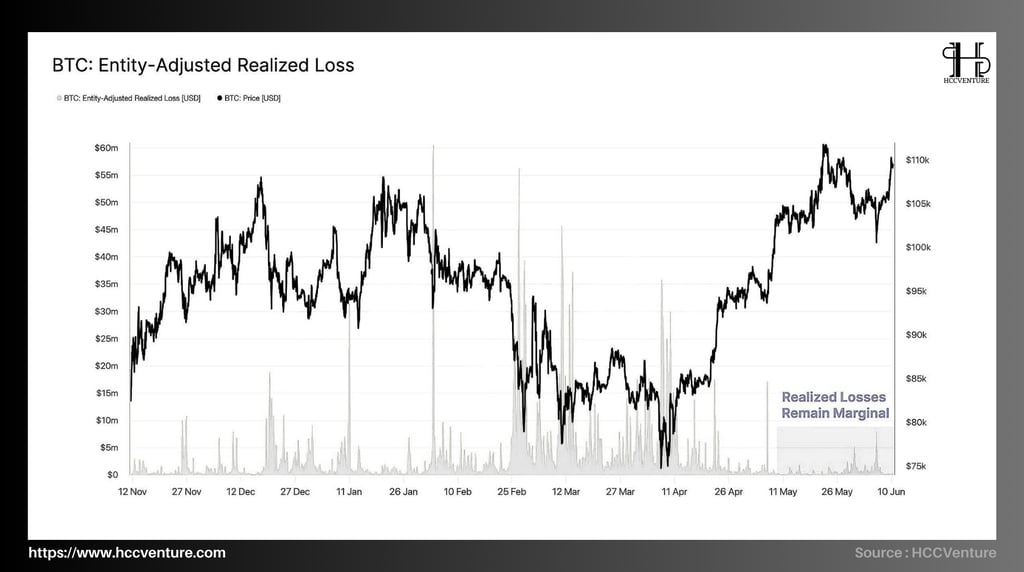
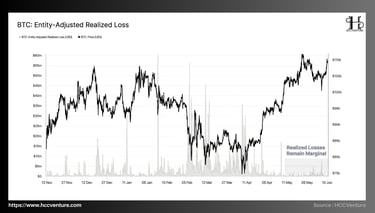
Entity-Adjusted Realized Loss (EARL) is a measure of the total realized loss value on-chain, after adjusting for each independent entity (removing internal transactions, avoiding duplication).
During the correction period from $112,300 to $76,000 (March–April 2025), the total realized loss was only about $200 million USD .
Historical EARL peaks reference:
May 2021: ~$3.2 billion USD (dump from $65k → $30k)
June 2022 (Celsius event, 3AC): ~$2.6 billion USD
March 2025: < $250 million USD
During the current period, EARL remains stable around below $10 million USD/day , clearly noted in the chart as “Realized Losses Remain Marginal” .
The realized loss ratio relative to the total network volume (<0.1%) is extremely low — confirming that the majority of holders are not under selling pressure.
Clearly, the Q1/2025 correction shows a very low level of realized losses relative to the size of price fluctuations , demonstrating a period where the majority of holders have long-term confidence and do not react irrationally to price adjustments.
A consistently low Entity-Adjusted Realized Loss indicator is a confirmation signal of a sustainable accumulation trend and stable market sentiment.
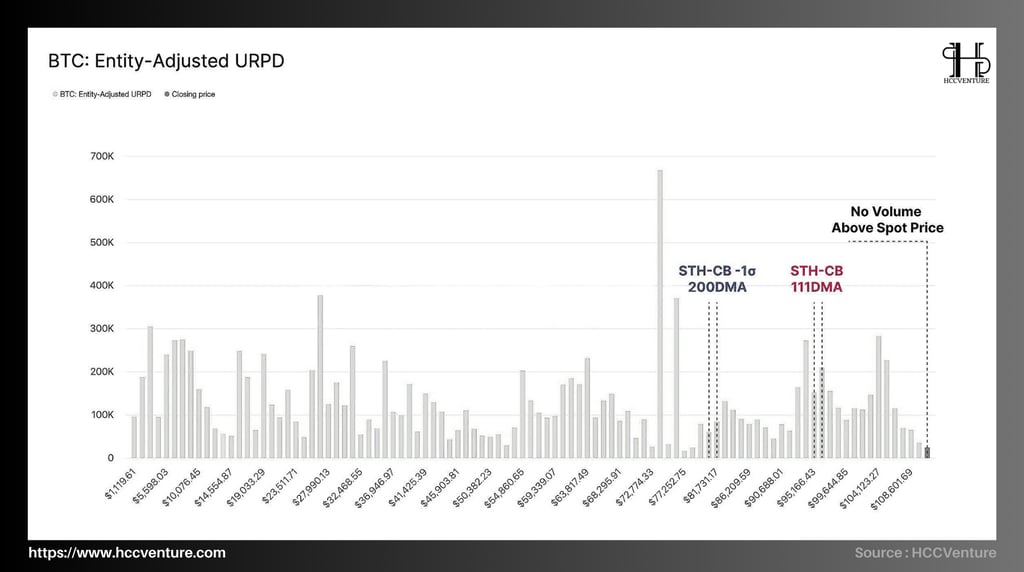
The supply zone is most concentrated at $71,000 – $77,500 , where the URPD volume peak was recorded , with ~720,000 BTC accumulated in this zone. This is the price zone with the highest density in the entire URPD structure.
"No Volume Above Spot Price" – confirms that all BTC in circulation is currently being bought at a lower price than the current one . With no clear technical resistance above , BTC is entering a price discovery zone .
The core of the largest volume cluster is centered around the $71,000–$77,500 area — a strong price foundation.
STH-CB is currently at $96,644. With the price trading 13% above this level, the Short-Term Holders are in a relatively profitable position .
However, there was no large volume in the $97k–$105k zone , confirming that this group did not initiate massive selling after the recovery.
In the context of no longer having the historical resistance zone above, the bullish momentum in the coming period depends entirely on bullish demand .
Evaluation and Conclusion
As of writing, Bitcoin is trading around $110,300 , just -2.1% below its all-time high (ATH) of $112,700 set in late March 2025.
Although the price is approaching a new price discovery zone, on-chain data shows:
Distributions from Long-Term Holders (LTHs) are increasing.
Realized profit volume peaked locally at over $930 million USD per day .
However, despite the increased distribution pressure, the net holdings of LTHs continued to increase , indicating that accumulation and maturation pressure is clearly dominant.
In the past 7 days, realized profits peaked at $937 million USD/day , which is equivalent to the peak distribution in previous cycles.
The amount of BTC in motion remains below the warning level (Activity Rate < 1.2%), confirming that LTHs are not selling en masse , but are just rebalancing their portfolios.
According to the HODL Waves > 1y model: 67.8% of the total circulating supply is held by LTHs - an unprecedented high in the late stages of the growth cycle. This is a factor that reduces the risk of sudden distribution , strengthening the bullish momentum.
URPD (Entity-Adjusted) confirms extremely low distribution density above the current spot price ($110k) , opening room for price discovery above the $112,700 area.
Bitcoin is now entering a pivotal phase of its bull cycle, with strong accumulation from long-term investors and valuations entering uncharted territory. Distribution pressure from LTHs is present, but is still fully absorbed by new demand and endogenous accumulation.
Disclaimer: The information presented in this article is the author's personal opinion on the cryptocurrency field. It is not intended to be financial or investment advice. Any investment decision should be based on careful consideration of your personal portfolio and risk tolerance. The views expressed in the article do not represent the official position of the platform. We recommend that readers conduct their own research and consult with a professional before making any investment decisions.
Compiled and analyzed by HCCVenture
Join HCCVenture here: https://linktr.ee/holdcoincventure
Explore HCCVenture group
HCCVenture © 2023. All rights reserved.


Connect with us
Popular content
Contact to us
E-mail : sp_contact@hccventure.com
Register : https://linktr.ee/holdcoincventure
Disclaimer: The information on this website is for informational purposes only and should not be considered investment advice. We are not responsible for any risks or losses arising from investment decisions based on the content here.

TERMS AND CONDITIONS • CUSTOMER PROTECTION POLICY
ANALYTICAL AND NEWS CONTENT IS COMPILED AND PROVIDED BY EXPERTS IN THE FIELD OF DIGITAL FINANCE AND BLOCKCHAIN BELONGING TO HCCVENTURE ORGANIZATION, INCLUDING OWNERSHIP OF THE CONTENT.
RESPONSIBLE FOR MANAGING ALL CONTENT AND ANALYSIS: HCCVENTURE FOUNDER - TRUONG MINH HUY
Read warnings about scams and phishing emails — REPORT A PROBLEM WITH OUR SITE.