


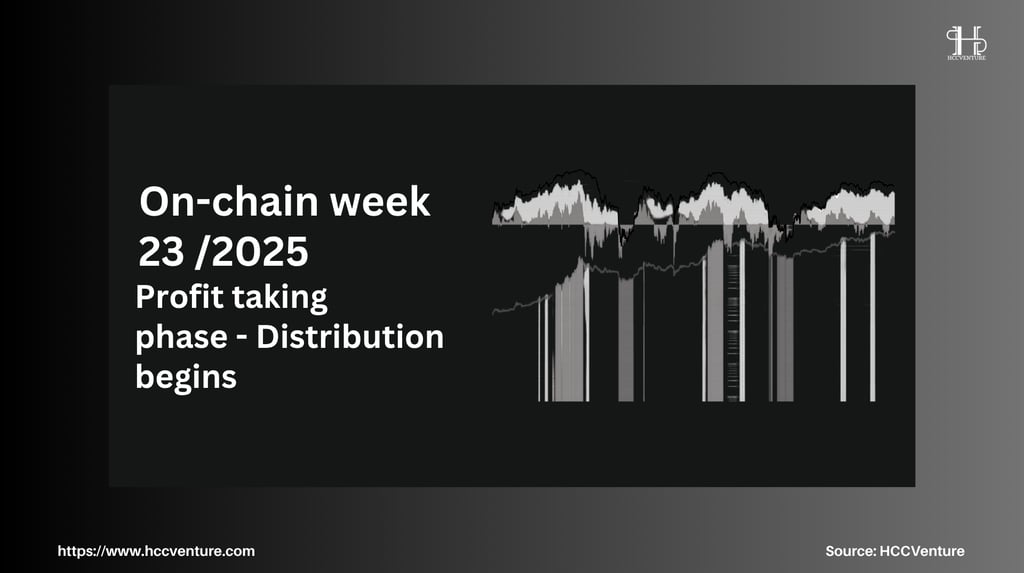
On-chain analysis week 23/2025: Time to take profit - Distribution signal
Bitcoin set a new all-time high of $111,800, before quickly correcting to $103,200, reflecting concentrated profit-taking from Long-Term Holders (LTHs). This is the fifth distribution wave in the current bull cycle, with realized profits exceeding $1.47 billion/day.
6/10/20258 min read
Situation Summary
With the price currently hovering around key support levels at $103,700 and $95,600 , selling pressure from long-term wallets suggests that bulls are facing a decisive test.
BTC’s recent rally appears to be largely spot-driven, with strong accumulation zones identified at $81,000–85,000 , $93,000–96,000 , and $102,000–104,000 , currently acting as potential support zones.
Observations from the CBD Heatmap show that many price zones that were accumulation buying points in the past are showing signs of turning into distribution, especially at the $25,000–31,000 , $38,000–44,000 , and $60,000–73,000 zones . These supply clusters are putting significant pressure on the current price trend.
Quantitative indicators such as Cost Basis Distribution Quantiles and Short-Term Holder Bands both show the nearest support zones at $103,700 (quantile 0.95) and $95,600 (quantile 0.85), while the next short-term resistance zone is identified at $114,800 .
Notably, Realized Profits have peaked at $1.47 billion per day , marking the fifth major wave of profit-taking in the current bull cycle .
The group of wallet addresses holding for over 12 months accounts for the majority of the total realized profits, indicating a shift of capital from seasoned investors – a factor consistent with the developments previously noted on the CBD accumulation heat map.
On-chain metrics analysis
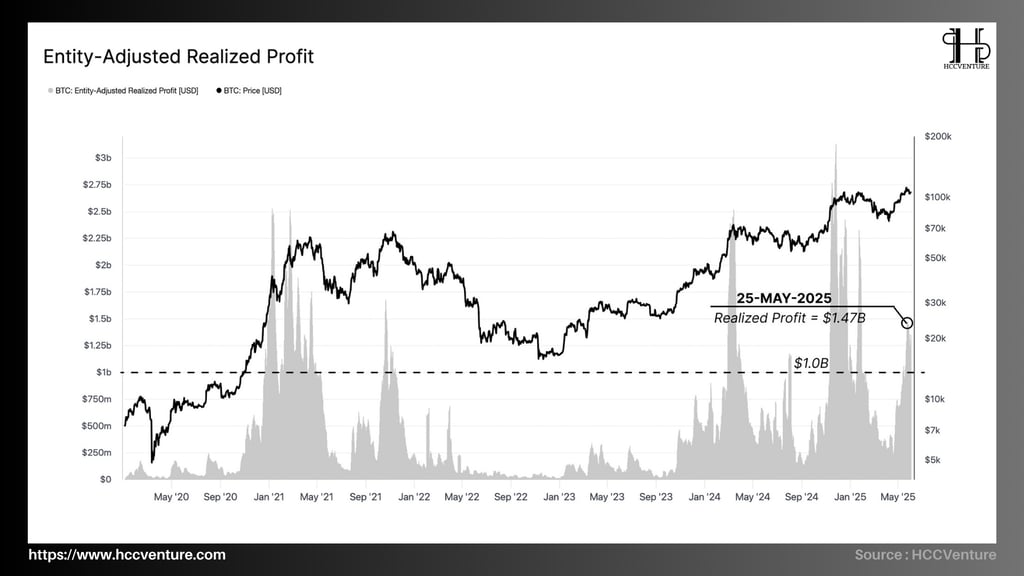

Current on-chain data is providing clear signals that the market is entering a large-scale profit-taking phase , mainly coming from intra-cycle holders. Realized Profit Index (7-day SMA - entity-adjusted)
Peak realized profit reached: 1.47 billion USD/day
Warning threshold: 1 billion USD/day
Number of times it crossed the $1 billion mark this cycle: 5 times
The Entity-Adjusted Realized Profit metric shows the actual amount of profit taken on-chain, excluding internal flows and transfers between wallets of the same entity.
The $1.47 billion/day is one of the highest numbers ever recorded in this cycle, and represents a large-scale capital turnover in the market.
Historically in the previous cycle (2020–2021), every time realized profits exceeded $1 billion/day, the market:
Entering the short-term correction phase
Or enter the sideways phase, which lasts 3–6 weeks.
→ The current increase in realized profits is a clear signal of increased selling pressure , posing a risk of a temporary imbalance between supply and demand in the market.
The selling flow mainly comes from short- and medium-term holders who have accumulated Bitcoin in the 45K–70K range. This group is currently recording profits from +60% to +130% → with strong profit-taking motivation.
There are no signs of capitulation from long-term holders, indicating that there has not been a market-wide sell-off , but the market is still in the "profit-dumping" phase.

Bitcoin is in an active profit distribution phase, led by long-term investors (LTHs).
LTHs (Long-Term Holders) are currently leading the profit distribution , with a 30-day average of nearly $1 billion/day in profit taking .
STHs (Short-Term Holders) only recorded a profit of about 0.32 billion USD/day .
The profit difference between the two groups: > 3 times , confirming that the main subjects of this sale are veteran investors with high confidence in the market , not panicked speculative selling.
The distribution of profits by LTHs implies that they are taking advantage of the high price zone to adjust their portfolios , not due to loss of confidence in the long-term trend.
This is a cyclical characteristic during the peak phase of a bull cycle, similar to Q4/2021 or Q1/2018.
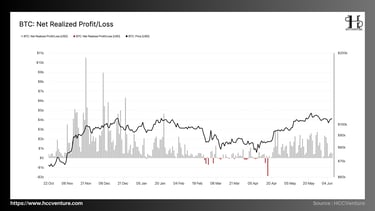
From late April to early June 2025 , the market recorded a series of consecutive days with positive net profits , ranging from 2.5 billion to 5.3 billion USD/day .
The recent peak on May 28 recorded a net profit of nearly $6.1 billion , indicating a massive distribution that occurred when BTC reached its peak of $111.8K.
Extremely low realized loss ratio → confirms that recent price drops are not due to panic selling .
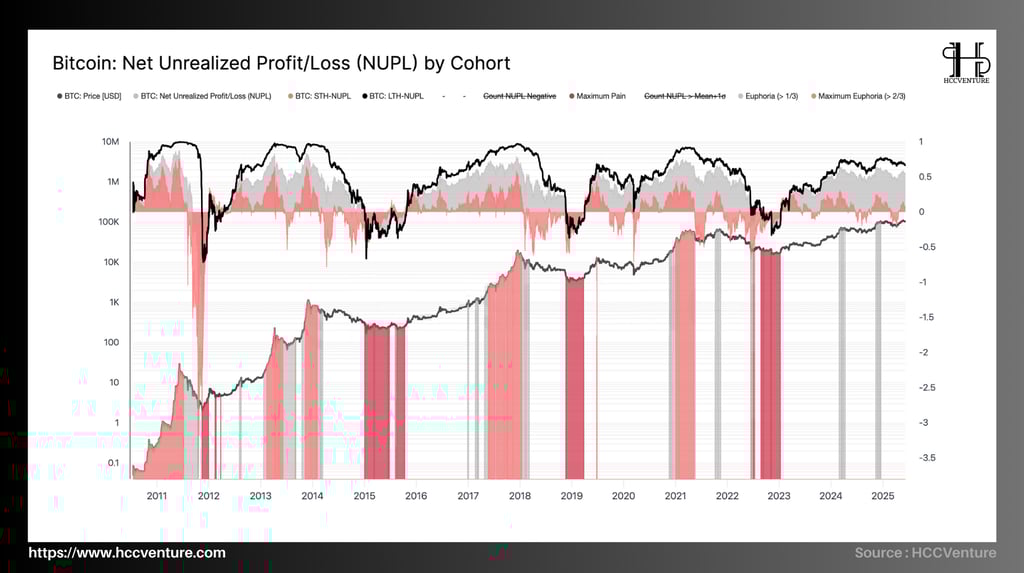
Current NUPL data, it can be affirmed that the Bitcoin market is in a positive “euphoria” phase , reflecting a state of large unrealized profits but not yet falling into a speculative bubble .
NUPL is divided into investor groups , specifically:
Gray Area: Euphoria – large unrealized profits.
Red Zone: Maximum Euphoria – extreme euphoria, high risk of correction.
Negative Zone: Maximum Pain – the market is in a state of major loss.
As of now, the current market-wide NUPL Index remains at ~0.55 , clearly in the “Euphoria” zone (> 0.5) . Of which:
STH-NUPL is approaching the pre-2021 peak, showing that short-term investors are in a state of large unclaimed profits .
LTH-NUPL is stable around 0.68 , showing that long-term confidence is still very strong , and this group has not shown any signs of fleeing the market.
In previous cycles (2013, 2017, 2021), whenever the NUPL index exceeded 0.75 , especially when the “Maximum Euphoria” red zone appeared continuously, BTC price peaked within the next 15–30 days .
Currently, the NUPL index has not yet reached 0.75, and there is no clear “Maximum Euphoria” red zone. This confirms that the market is in a sustainable growth phase but has not yet entered the overbought peak zone .

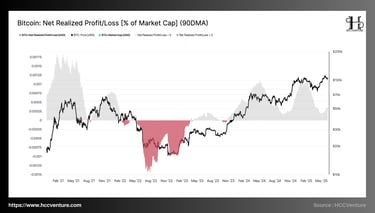
The Net Realized Profit/Loss (%MC – 90DMA) measures the amount of net realized profit across the Bitcoin network, normalized by market capitalization and smoothed by a 90-day moving average.
As of June 2025, Net Realized Profit/Loss has remained positive for more than 12 months , establishing a sustainable positive period . The index's most recent peak was around 0.1% of capitalization , significantly lower than previous cycles.
Two peak profit realization periods occurred:
Early Q1/2024 (~0.1%) – coincides with the surge to $74,000.
Q1/2025 (~0.09%) – BTC crosses $110,000.
→ No record of negative profit zone since early 2023, meaning the market is no longer under pressure to cut losses en masse.
→ The trend of declining realized profit margins is a signal that the market structure is shifting to a more mature state , with reduced volatility , more efficient capital allocation and planned realization strategies, no longer herd-like.
As for cash flow behavior, there are signs of a gradual reduction in the “boom-bust” nature – an increased role for institutional capital. Profits are realized over a longer period of time , reflecting the structured capital rotation strategy – a characteristic of professional investment funds .
Better control from the supply and demand side With no extreme profit peaks, the market avoids "liquidation cascades" and the current market sentiment remains positive, but not too hot , helping to maintain a stable price base.
Despite being in a strong bull run (BTC > $110,000), there are no signs of a “profit bubble”.
Profit realization is taking place steadily and in a controlled manner, corresponding to the behavior of institutional and long-term investors , not retail speculators.
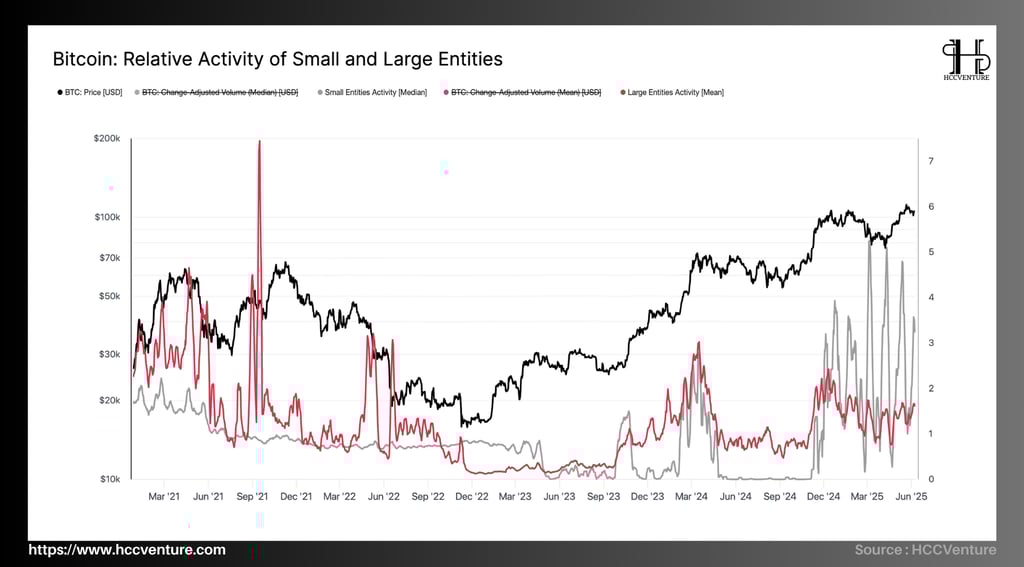
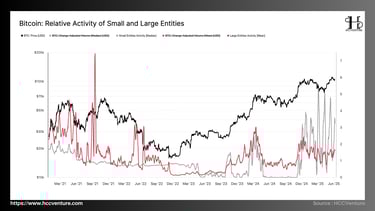
No more signs of retail speculative growth. On-chain activity by large entities shows control of the price cycle by organized, strategic, and long-term capital.
The Large Entities Activity index increased strongly again, exceeding 2.5 , peaking at nearly 3.5 in April 2024.
Small entities activity fluctuated around 1.5–2 , lower than in 2021.
→ Affirming the trend of market leadership by organizations , no longer affected by small speculative capital flows.
In the most recent growth phase (from $25k to $110k), the rally was accompanied by increased large entity activity , not retail →G value was driven by institutional capital , not market sentiment.
Small entities no longer play the role of “fuel” to create FOMO peaks like in 2021. This structure helps reduce the risk of mass liquidation , maintaining a stable and strategic price base.
BTC's strong rallies (> $110k) were all associated with strong volume increases from institutional investors , not retail investors. There were no spikes of over-activity from retail investors , eliminating the risk of a "bull trap".
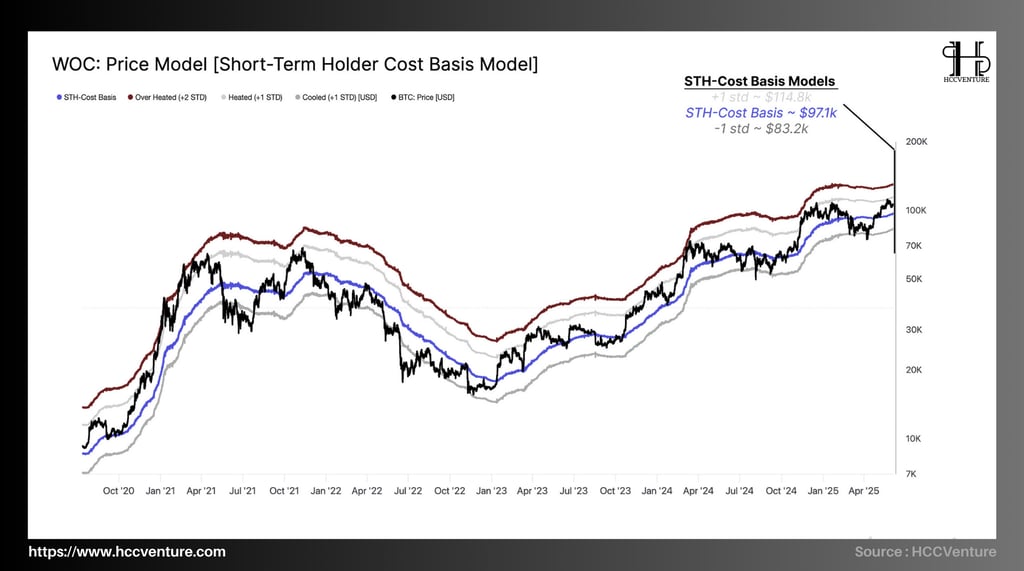
The STH-CB model is a key academic tool for assessing the psychology and behavior of short-term investors – those who hold Bitcoin for less than 155 days. The average value is used to determine price zones:
STH-Cost Basis (mean): $97.1k
+1σ (Heated zone): $114.8k
-1σ (Cooled zone): $83.2k
→ BTC is currently in the middle of the ±1σ range , showing a stable state in the hot neutral zone , but has not reached the overbought threshold .
When BTC remains stable above the STH-CB line , it is a sign of a structurally healthy market , with market sentiment reinforced by unrealized profits.
If price approaches the +1σ level ($114.8k) without a sell-off, this will establish a sustainable breakout condition , extending the new bullish momentum.
Bitcoin is maintaining a sustainable growth state, as the market price stabilizes above the short-term investor cost-of-holding (STH-CB) average threshold at $97.1k.
There is no distribution signal at the +1σ zone (~$114.8k) , indicating no major capital withdrawal. • The current STH-CB zones act as dynamic momentum bands to guide short- to medium-term market behavior.
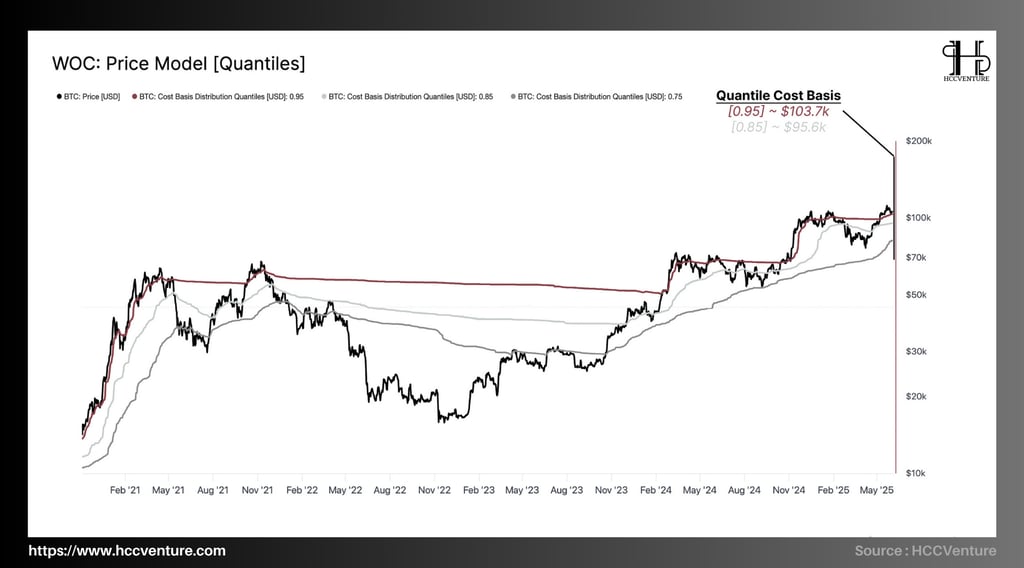
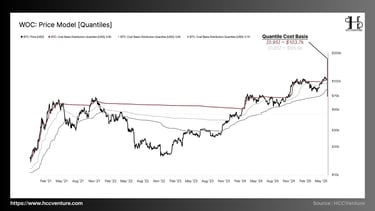
Quantile Cost Basis is an advanced academic tool that allows to dissect the distribution of money supply by different investment groups, evaluating data through:
0.95 quantile (~$103.7k): highest cost of 5% of recently traded supply — “buy top” group
0.85 quantile (~$95.6k): top 15% – represents positive distribution zone
0.75 quantile: lower cost zone – associated with long-term consolidation cycles
→ BTC is trading above the 0.95 percentile , indicating a hot bull market state , entering a clear speculative euphoria zone .
The Bitcoin market is operating in a “price discovery” state, having crossed the 0.95 quantile level ($103.7k) – meaning that the majority of investors have recently taken profits, creating favorable conditions for the continuation of the uptrend.
Evaluation and Conclusion
Bitcoin has just reached a new historical peak at $111,800 , however, there has been significant selling pressure as market data shows exhaustion of buying power from previous investors, while there is a wave of profit realization from long-term holders (LTHs).
Specifically, data from the CBD Heatmap reflects a significant shift in market behavior: areas that were strong accumulation points in previous cycles — particularly in the $25,000–73,000 range — are now turning into active distribution zones.
On-chain pricing models like Cost Basis Distribution Quantiles along with Short-Term Holder Statistical Bands are establishing decisive support and resistance levels in the current scenario:
$103,700 (equivalent to quantile 0.95 – top 5% of distribution costs)
$95,600 (quantile 0.85 – top 15%)
$114,800 – is a high statistical resistance area where potential supply could be triggered if price attempts to break out again.
The data shows that realized profits peaked at $1.47 billion/day , a figure that is similar to the peak distribution periods in previous cycles. What is particularly noteworthy is that the majority of these profits came from the group holding for more than 12 months , reflecting the behavior of "mature" and long-term strategic-oriented money flows.
The Bitcoin market is at a critical crossroads between expectations of a continued bull cycle and the potential formation of a mid- to long-term cycle top. On-chain signals are highly quantitative – including profit-taking by long-term investors, the shift in the role of accumulation zones to distribution zones, and clear support/resistance structures from Cost Basis Quantiles.
Once again we give our opinion on potential projects in the crypto market. This is not investment advice, consider your portfolio. Disclaimer: The views expressed in this article are solely those of the author and do not represent the platform in any way. This article is not intended to be a guide to making investment decisions.
API & Data : Glassnode
Compiled and analyzed by HCCVenture
Join HCCVenture here: https://linktr.ee/holdcoincventure
Explore HCCVenture group
HCCVenture © 2023. All rights reserved.


Connect with us
Popular content
Contact to us
E-mail : sp_contact@hccventure.com
Register : https://linktr.ee/holdcoincventure
Disclaimer: The information on this website is for informational purposes only and should not be considered investment advice. We are not responsible for any risks or losses arising from investment decisions based on the content here.
TERMS AND CONDITIONS • CUSTOMER PROTECTION POLICY
ANALYTICAL AND NEWS CONTENT IS COMPILED AND PROVIDED BY EXPERTS IN THE FIELD OF DIGITAL FINANCE AND BLOCKCHAIN BELONGING TO HCCVENTURE ORGANIZATION, INCLUDING OWNERSHIP OF THE CONTENT.
RESPONSIBLE FOR MANAGING ALL CONTENT AND ANALYSIS: HCCVENTURE FOUNDER - TRUONG MINH HUY
Read warnings about scams and phishing emails — REPORT A PROBLEM WITH OUR SITE.