On-chain analysis week 22/2025: Signs of heating up the whole market after Bitcoin sets new ATH
Bitcoin just set a new all-time high of $111,000, marking the third ATH in the current bull run. However, in recent sessions, the price has corrected to the $104,000 region, down more than 6.3% since the peak.
6/1/20258 min read
Market context
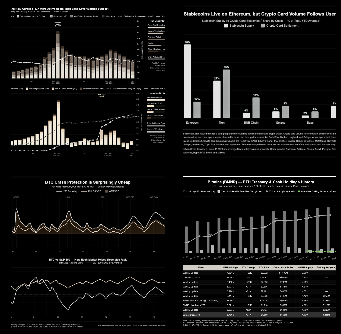
Average -14,700 BTC/week, net cash withdrawal from the exchange (reducing liquidity supply). This is a positive signal, showing that long-term investors are tending to hoard instead of selling.
Long-Term Holder SOPR is taking profits, but there are no signs of massive selling. Profit-taking is taking place in a controlled manner, reflecting confidence in the main trend remaining up.
Share of on-chain volume going through exchanges ~ 33% of total on-chain volume is currently being processed through centralized exchanges (CEXs). This spike is often associated with hot market periods where trading behavior increases markedly .
Percent of Supply in Profit ~ 94.1%, almost the entire market is in profit – reflecting asset health and the ability to stimulate profit-realizing behavior.
Realized Profit (USD terms): reached $2.98B/day (7D MA) -> Recorded the highest level since November 2021 but there is no sign of mass dumping , showing that the distribution process is taking place in an orderly manner.
Although profit-taking pressure has begun to emerge, market momentum remains high , underpinned by on-chain indicators reflecting positive cash flows, sustainable investor behavior, and strong expansion in both spot and derivatives markets .
On-chain metrics analysis
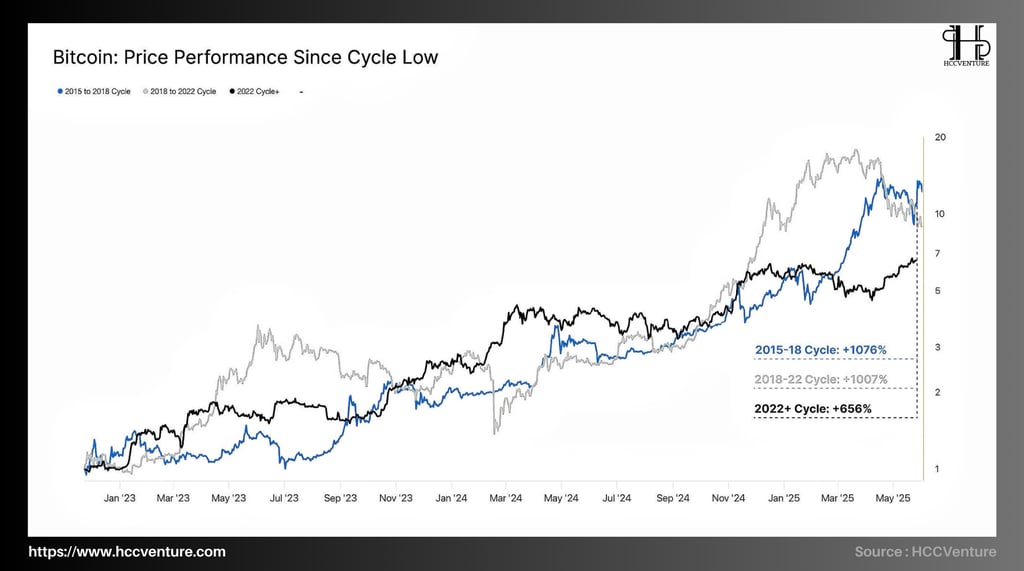
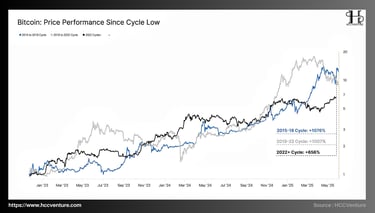
Despite being in a technical correction after reaching a historic high of $111,000, Bitcoin shows that the growth structure of the current cycle (2022+) is closely following the trajectory of previous bull cycles .
Despite the current market capitalization being many times larger than in previous periods:
2015-2018 cycle grew ~1076% to date
2018-2022 cycle growth ~1007% to date
2022+ cycle growth ~656% year to date
→ Although not yet reaching the 4-digit growth rate of previous cycles, the 2022+ cycle is showing a very similar price growth trajectory in structure, reflecting that investment demand is still keeping up with the growth rate of market size.
Realized Cap Growth has increased by more than $160 billion since the 2022 cycle bottom → Reflects real increases in asset values held , not just speculative price action.
HODL Waves – Proportion of BTC that has not moved >6 months: 41.3% → Shows a large proportion of BTC is held with a long-term vision – market sentiment remains strong.
Despite the market having grown significantly in size, Bitcoin's bull cycle structure has remained consistent with previous cycles.
The +656% performance since the 2022 bottom is a well-founded accumulation result due to sustainable cash flows from LTH and international investment institutions, ETFs and increased demand for alternative assets in an uncertain macro environment.
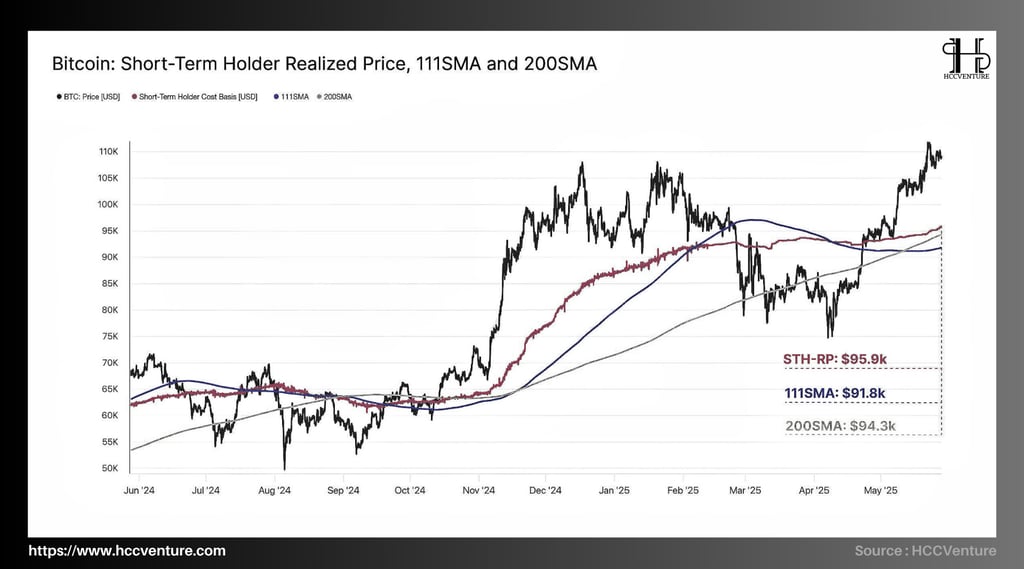
At its current price of $104,000 , Bitcoin remains well above three important technical – on-chain levels , including:
Short-Term Holder Realized Price (STH-RP) at $95,900
This is the average cost of capital of short-term investors – reflecting short-term sentiment in the market.
The fact that BTC price remains above the STH-RP threshold shows that: most short-term investors are currently making profits → selling pressure decreases, market confidence is strengthened.
111DMA price line at $91,800
111DMA is a signature technical indicator in analyzing Bitcoin's cyclical behavior.
In previous cycles, price has remained above this line during strong bull runs. The fact that BTC is now well above the 111DMA proves that the bullish pattern is still holding steady .
200DMA price line at $94,300
Considered the long-term boundary between uptrend and downtrend .
The fact that the price has remained above the 200DMA for the past 6 months shows that Bitcoin has escaped the bear market and is establishing a sustainable growth momentum.
→ BTC price is 8–13% higher than these three indicators , indicating that the current bullish momentum is still maintaining a state of "price discovery" .
What is interesting about the chart is that the three indicators mentioned above are all converging around the $92,000–$96,000 zone .
If BTC continues to correct, the $92k–96k zone will be an important support for the market to recover.
If this zone is broken, the short-term trend may reverse, with the risk of a deeper correction towards $86k–88k.
→ This price zone is currently forming a “strategic convergence support zone” – acting as a buffer if the market corrects further.
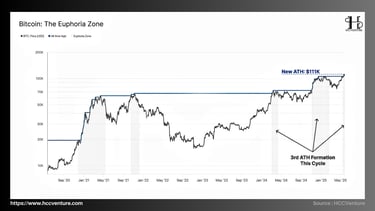
After the breakout, the price quickly corrected to $107,000 , then consolidated around $108,000 for a few sessions. As of today, the price has continued to cool down and is trading at $104,000 .
Bitcoin market history shows that price discovery phases often end with short-term technical corrections , when:
Short-term investors take profits at price levels that have never appeared before .
Market sentiment is shifting to caution and defense , especially in the current uncertain macro environment.
The current correction scenario is similar to the traditional behavioral cycle: Strong increase → peak → short-term profit-taking sale → re-accumulate → find new growth momentum.
The current price is still 8–13% above all technical and behavioral support levels . This is a confirmation that the market:
Still maintaining long-term growth trend .
Buying pressure has not been eliminated, despite the presence of short-term profit-taking pressure.

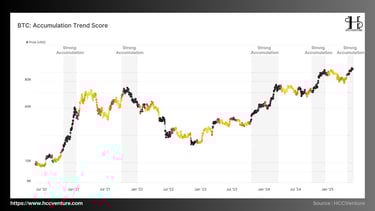
The Accumulation Trend Score (ATS) is approaching its peak value of 1.0 – reflecting positive buying pressure and spread across the entire wallet spectrum (from retail wallets to whale wallets).
During price discovery periods , this behavior is amplified, typically as follows:
ATH $70,000 (March 2024) → ATS surges.
ATH $107,000 (Nov 2024) → ATS approaches 1.0, reflecting strong buying momentum.
→ This clearly shows the FOMO (fear of missing out) psychology that is common during price breakouts and market confidence is still strong.
In the previous bull cycle (ATH $69,000 in 11/2021):
Accumulation occurs both before and after the price peak , lasting for weeks even when the price starts to correct.
Noteworthy point : the huge accumulation after the peak became a reversal signal , leading to a prolonged bear market in 2022 .
When investment behavior becomes absolutely consensual (ATS near 1.0) → the risk of reversal increases. Historically, “over-consensus” has often been a contrarian indicator
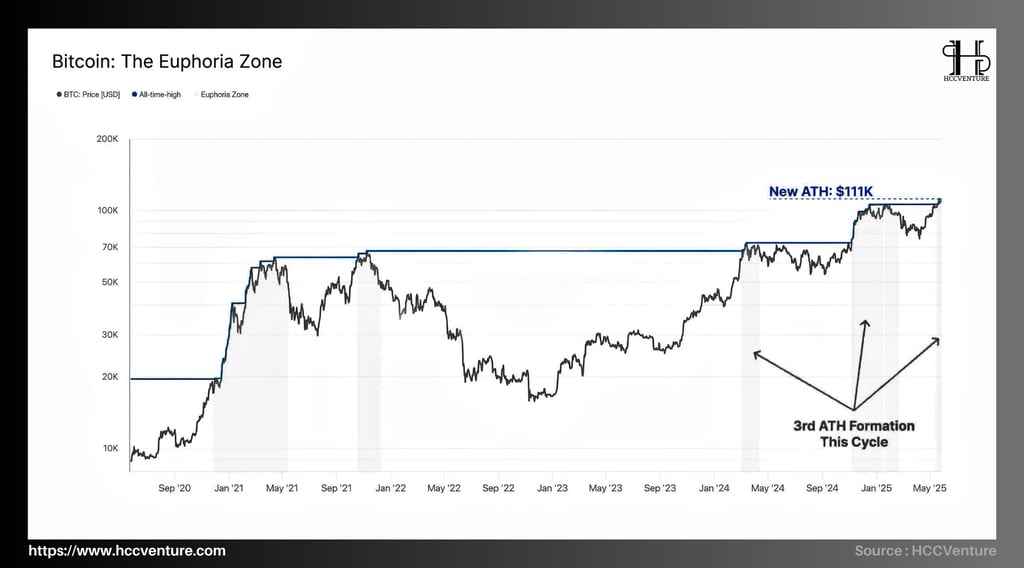
When Bitcoin breaks its old high and enters a “price discovery” phase , a familiar phenomenon often occurs:
The market's Unrealized Profit (UPP) is soaring , reflecting the large difference between the current market price and the investor's average cost of capital.
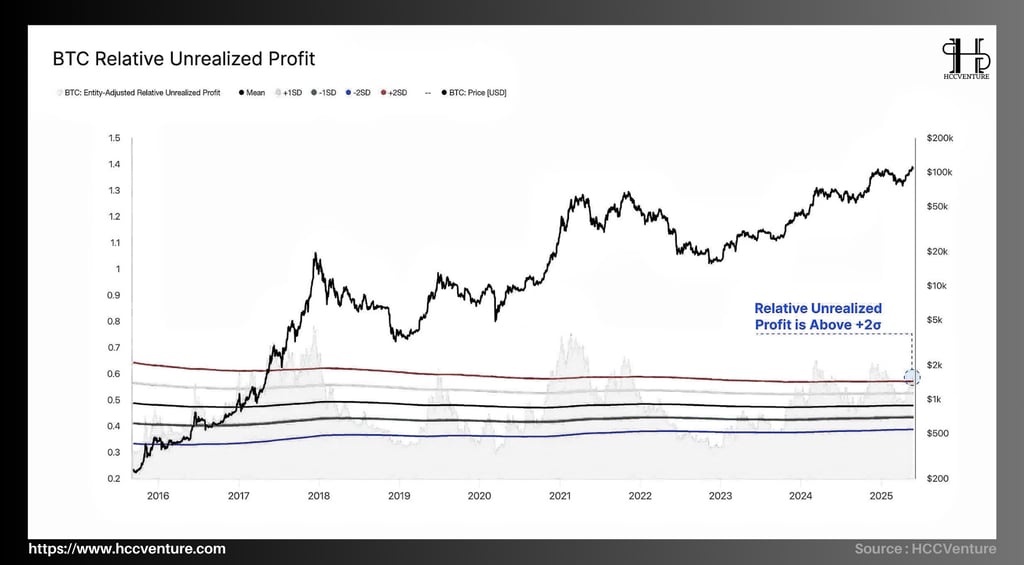
The Relative Unrealized Profit (RUP) indicator is currently above the +2σ (second standard deviation) band — a level historically recognized as a market transition into euphoria .
The time distribution ratio is 16% of the trading sessions in history that have recorded unrealized profits as high as the current level. When short-term selling pressure > new demand , the market is likely to fall into a deep technical correction phase.
When considering the Euphoria regions that crossed above the +2σ band in previous cycles:
2017 Bitcoin price cycle reversed sharply, bear market for ~45 days.
2021 cycle Bitcoin price corrected ~50% within 60 days.
Cycle 2025 is currently correcting to $104K as of now ~7 days.
Thus, high profit zones often lead to strong fluctuations , and are difficult to maintain in the long term . Maintaining an uptrend requires a large enough volume of buying money to absorb distribution pressure — which is difficult to achieve when investor sentiment shifts from accumulation to profit-taking.
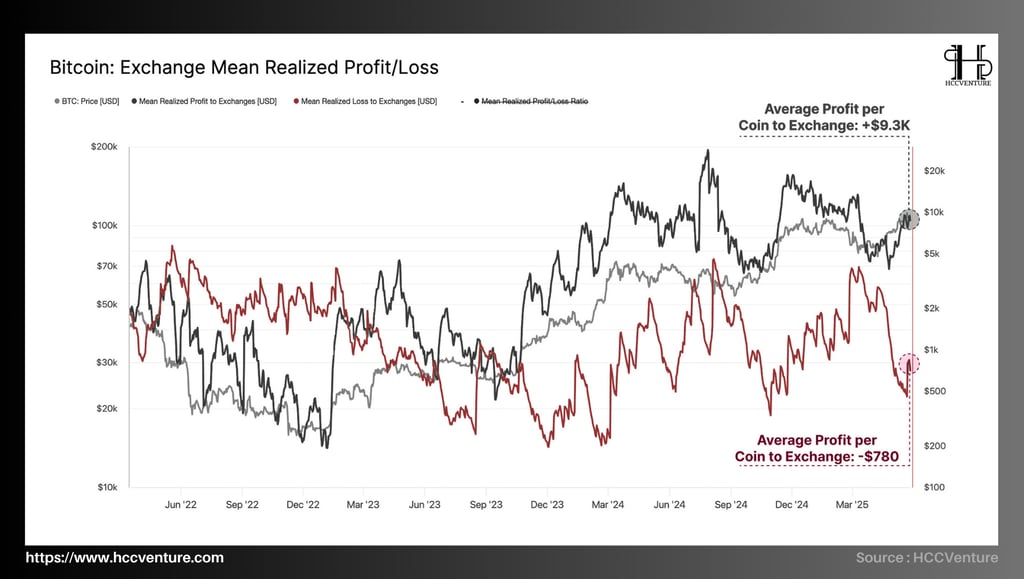

The behavior of depositing coins on the exchange is currently strongly driven by profit-taking motives, reflecting optimistic sentiment and the market being in a state of control. However, it is necessary to closely monitor the market's ability to absorb selling pressure.
The majority of coins being deposited on the exchange are in a profitable state , reflecting that:
Current spending behavior is heavily tilted toward profit taking .
Investor sentiment has improved significantly , as many are taking advantage of the high price period to realize profits.
In contrast, realized losses were very limited , suggesting:
The number of panic sellers is now almost negligible .
Investors are well-controlled in their return expectations and market behavior.
The market is operating in a healthy state , sellers are not driven by fear, but mainly based on the strategy of realizing profits when reaching target thresholds.
The 2021 period of strong profit taking with high profits often leads to a medium-term correction of 10–25% , before recovering and setting new highs.
However, the current profit/loss ratio still shows that the market has not reached the distribution top state , but is in the natural profit rotation phase.
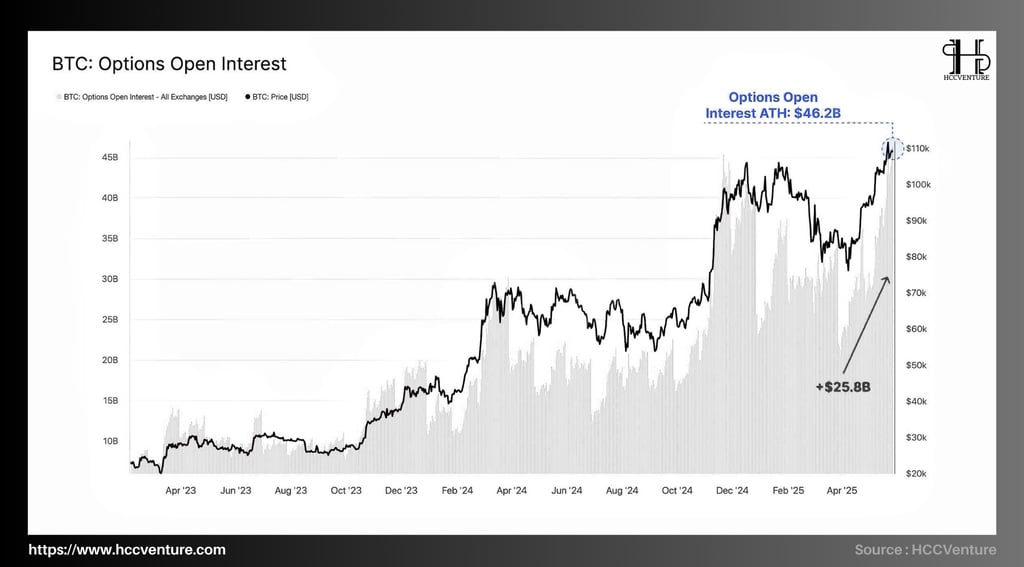
In recent weeks, the Bitcoin options market has seen a rapid and notable increase in total open interest . Specifically:
Open Interest Options increased from $20.4 billion → $46.2 billion
Absolute increase: +$25.8 billion USD
This is the all-time high (ATH) of the Bitcoin options market
This growth rate far exceeds that of the futures market , which is often a reflection of short-term speculative sentiment.
Investors today are not simply “buying-and-hoping,” but are using options to hedge downside risk (buying put options) or to expand controlled risk leverage.
Bitcoin options open interest peaking at $46.2 billion, while the price corrected slightly to $104K, is a sign of a more mature and structurally complex market.
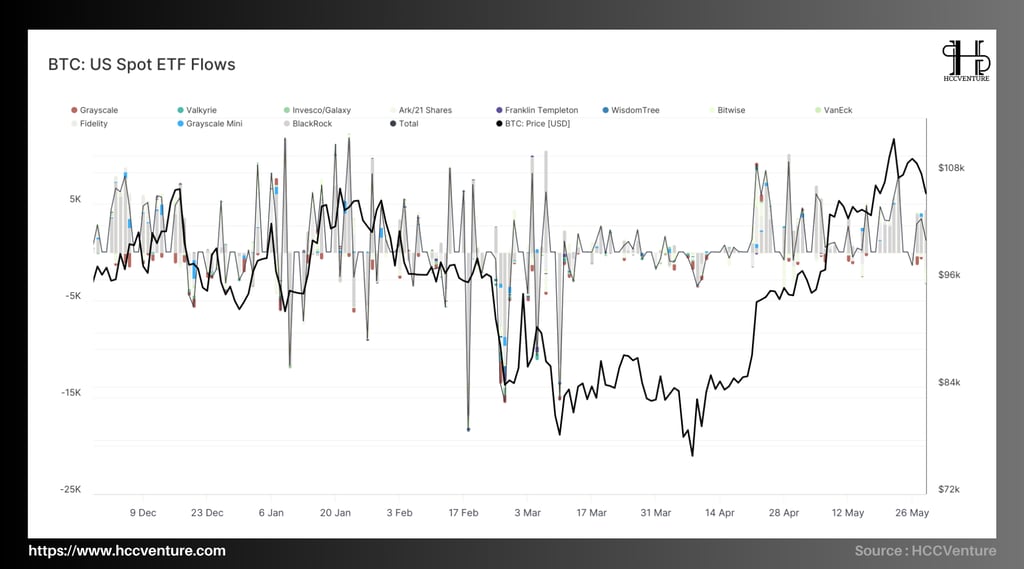
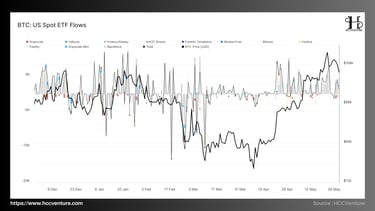
Data shows that Bitcoin spot ETFs are still seeing huge inflows, remaining above $300 million per day over the past week, a positive sign reflecting real demand and strong confidence from both retail and institutional investors.
Most of it comes from institutional investors, showing caution but determination to accumulate when prices correct.
This large cash flow creates strong buy-side pressure, helping to support and maintain market strength, especially in a bearish environment.
Bitcoin is currently trading around $104,000, down significantly from its previous peak. However, ETF inflows remain steady, showing:
Long-term sustainable trust
Technical bottoming ability
With strong support from ETFs and stability in on-chain indicators, Bitcoin is likely to soon establish a hard bottom and trend up again in the coming weeks.
Evaluation and Conclusion
Bitcoin has just set a new all-time high (ATH) of $111,000 – the third highest in the current bull run. This price point has triggered significant increases in many market segments:
Increased investor profits and profit-taking activity, up over 75%
Exchange flow increased sharply
Significant growth in futures and options up 15-20% week over week
Buying cash flow from spot ETFs remains stable at an average of over 300 million USD/day
Bitcoin is entering a price discovery phase, with a strong and steady bullish momentum reinforced by both on-chain and technical indicators. However, technical correction pressure is inevitable, and the $92k–96k zone will be the key zone for the market to maintain its growth status.
The hot rally over the past few weeks has pushed some valuation metrics (MVRV, NUPL) close to overbought territory.
Funding rates in the derivatives market have shown signs of increasing sharply → traders use higher leverage, increasing the risk of "liquidation flush".
Widespread accumulation at ATH is a good sign, but be wary of extreme consensus investing behavior.
Once again we give our opinion on potential projects in the crypto market. This is not investment advice, consider your portfolio. Disclaimer: The views expressed in this article are solely those of the author and do not represent the platform in any way. This article is not intended to be a guide to making investment decisions.
API & Data : Glassnode
Compiled and analyzed by HCCVenture
Join our telegram community: HCCVenture
Explore HCCVenture group
HCCVenture © 2023. All rights reserved.


Connect with us
Popular content
Contact to us
E-mail : sp_contact@hccventure.com
Register : https://linktr.ee/holdcoincventure
Disclaimer: The information on this website is for informational purposes only and should not be considered investment advice. We are not responsible for any risks or losses arising from investment decisions based on the content here.
TERMS AND CONDITIONS • CUSTOMER PROTECTION POLICY
ANALYTICAL AND NEWS CONTENT IS COMPILED AND PROVIDED BY EXPERTS IN THE FIELD OF DIGITAL FINANCE AND BLOCKCHAIN BELONGING TO HCCVENTURE ORGANIZATION, INCLUDING OWNERSHIP OF THE CONTENT.
RESPONSIBLE FOR MANAGING ALL CONTENT AND ANALYSIS: HCCVENTURE FOUNDER - TRUONG MINH HUY
Read warnings about scams and phishing emails — REPORT A PROBLEM WITH OUR SITE.