


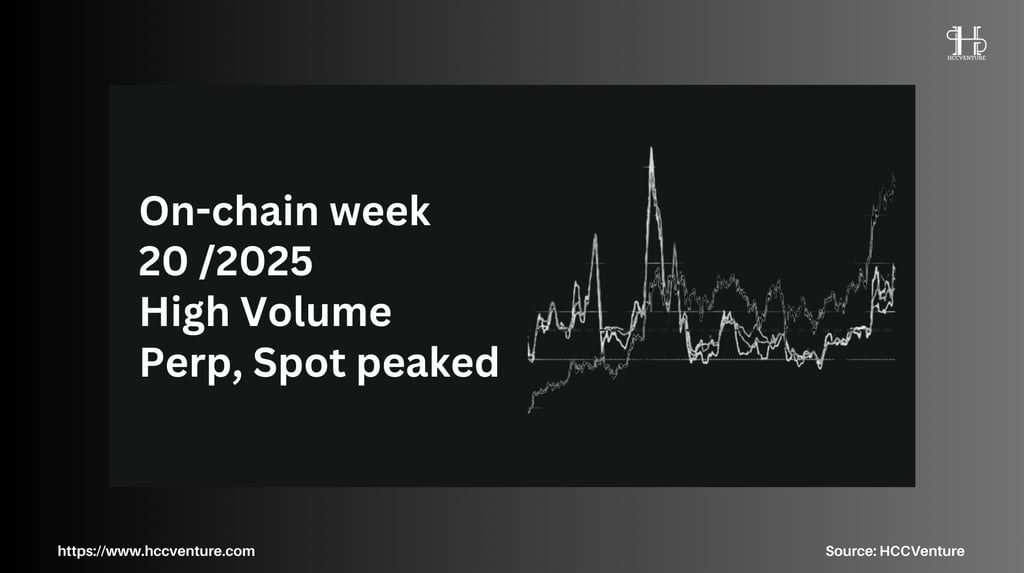
On-chain analysis week 20/2025: Derivatives trading volume spikes, Spot partitioning
In the last three sessions, Bitcoin has broken out to $104,000 – the highest level since the historical peak in December 2024. Money flow decomposition and leverage data show that real demand is pushing prices ahead; institutional money leads, the derivatives market “chases” spot so it is not too hot, but there is explosive momentum from the “short squeeze”.
5/18/20258 min read
Situation Summary
Bitcoin just completed a vertical rally of +197% (from $35,000 → $104,000) in just seven weeks. What story is the blockchain telling beneath the explosive price action?
The primary trend remains driven by spot & ETF demand – a more sustainable foundation than previous leveraged rallies. The URPD cluster shows ≈ 610k BTC changing hands in the 93–95k range – the highest since the 2023 26–28k accumulation zone.
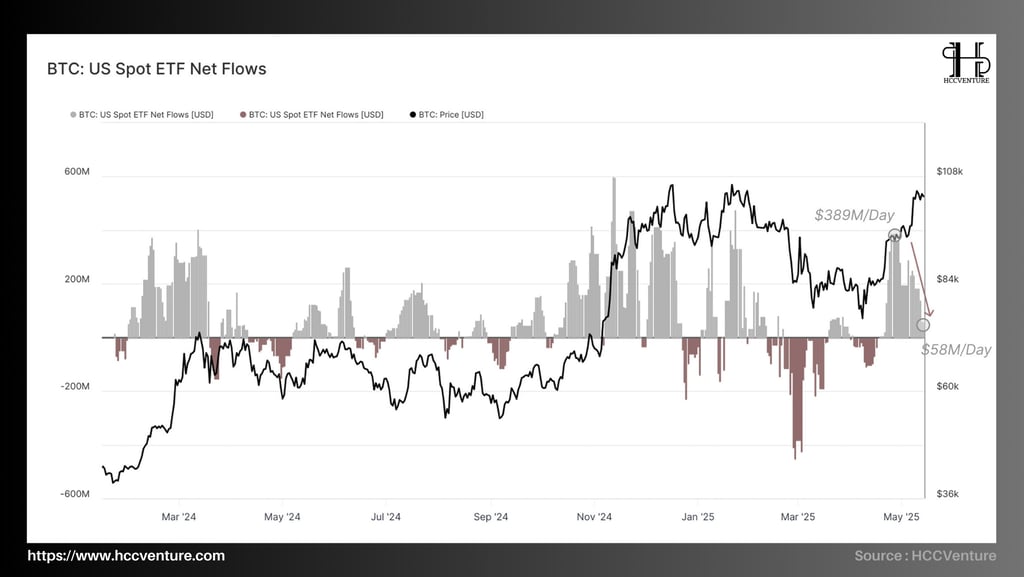
ETF – fixed supply “pump” with record inflow of 389 M USD/day (~5 700 BTC) pushing total AUM to 1.171 M BTC, only 0.9% short of setting a new ATH.
ETF inflow has dropped to $58M/day but has not turned to outflow , implying that demand remains strong despite the FOMO momentum cooling down. Showing that ETF cash flow has returned and is stronger than the previous uptrend cycle.
The 93-95k zone is the “liquidity fulcrum” ; breaking this level means that the buying cash flow has dried up, and the market is likely to enter a deep correction phase to 88k (111 DMA).
“Buy-the-dip” is still the dominant reflex; every pullback in Bitcoin below $97,000 is immediately absorbed by real demand.
OI drops 8% as Bitcoin price rises 14% -> “short squeexe” wipes out nearly $480M in Short positions. Bitcoin is on a strong real demand foundation, but the macro “climate” is volatile and leverage psychology remains fragile.
On-chain metrics analysis
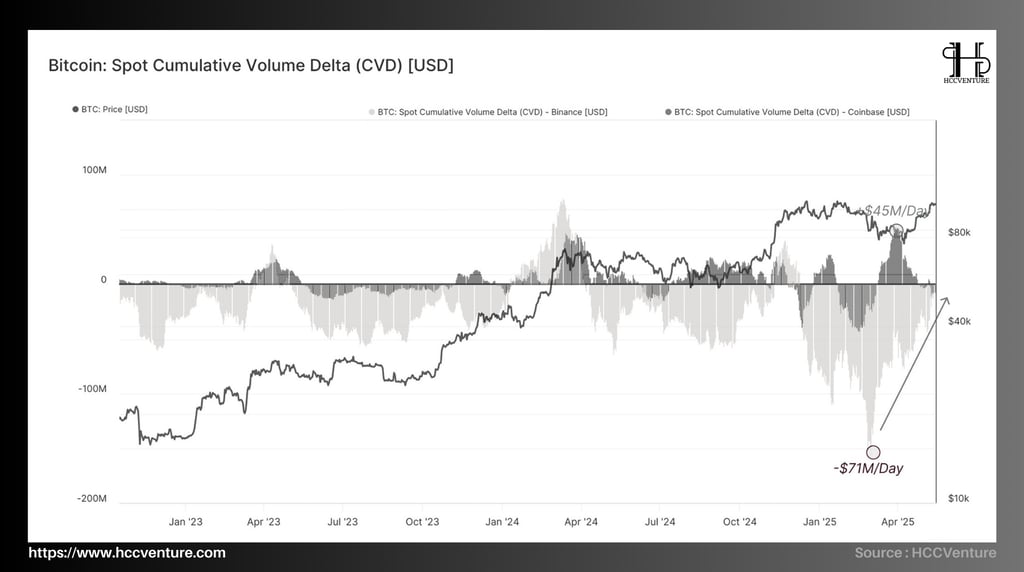
The buying power on the spot order book is telling a positive story – as long as this “voice” doesn’t dry up, the bull run has room to expand. Coinbase and Binance Spot CVD reviews best illustrate this trend:
Coinbase Spot CVD : maintained continuous net buying from April 15, peaking at +45 million USD/day - the highest level since the launch of spot ETF (January 2024).
Taker-buy volume accelerates right as ETFs record inflows and prices break out of $93,000
Physical demand is driven by institutions , not leveraged cash flows.
Spot buyers are willing to “pay a premium” – a sign of confidence in the trend.
Binance Spot CVD : net selling narrowed from -71 million USD/day (March 18) to only -9 million USD – Asian selling pressure cooled down significantly.
Active selling pressure on Binance has gradually decreased to near equilibrium.
Sellers “run out of cheap goods” after a long distribution chain.
Higher prices make sellers hesitant to open additional short spot positions.
Meanwhile, the URPD 93-95K index shows that more than 600,000 BTC are changing hands, Spot CVD confirms that this volume is actually absorbed by active buying orders -> The synchronization between on-chain accumulation & spot demand is a necessary condition to maintain the mid-term bullish structure.
The spot market bias has tilted towards the buyers, if CVD stays positive on both Coinbase and Binance, it will be difficult for Bitcoin to return to the $97,000 zone.
If Spot CVD on Coinbase surpasses the old peak of +45M, the possibility of extending the Bitcoin target to 110-115k USD is activated. The US market will be vibrant and US demand will increase very quickly in the near future.
Since the official listing of Bitcoin spot ETFs (BlackRock, Fidelity, Ark/21Shares, etc.), the market has had a transparent “window” to gauge traditional investor appetite.
ETF wallet inflow/outflow data helps us quantify three core factors: confidence, buying power, and trend durability .
On average over the past 30 days, ETFs have collected over 44,100 net BTC, nearly completely offsetting the March outflows, when Bitcoin corrected below $73,000.
ETFs are becoming the cycle driver, no longer a secondary factor as the buying intensity is large enough to drive the market around $300 million per day in BTC purchases.
Although inflows have decreased, they have not turned negative yet – a clear contrast to the 2021 cycle, when inflows reversed very quickly to prolonged outflows. This implies that institutional risk appetite for Bitcoin has become more “durable” .
Institutions remain net buyers , adding over 44k BTC in a month – enough to reestablish an uptrend even as retail selling wanes.
The current pause reflects money “breathing” , not withdrawal; as long as inflow remains above $50 million/day, the medium-term bullish structure is not broken.
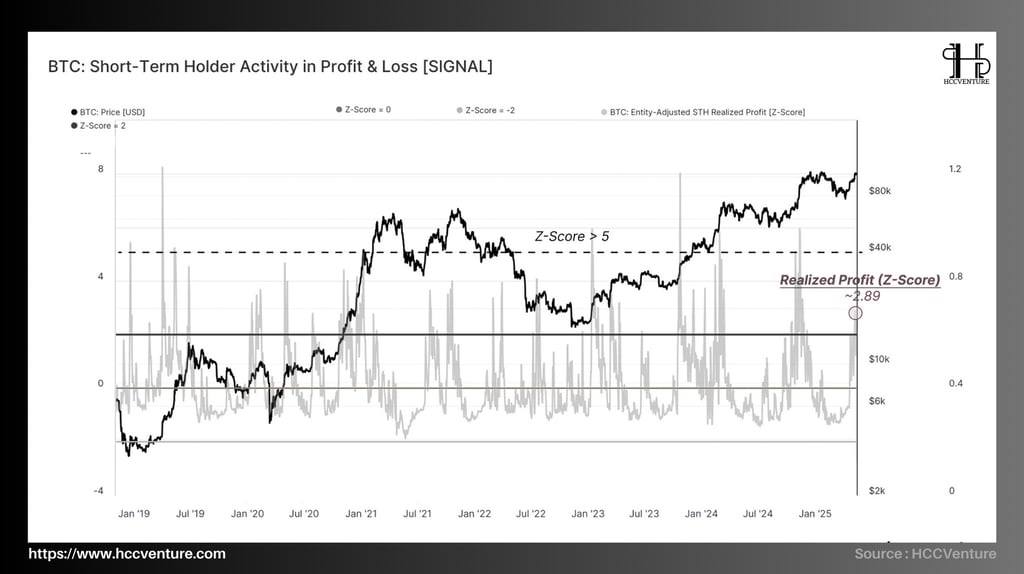
The STH Supply in Profit/Loss (STH Supply in Profit/Loss) dropped to 0.03, indicating that the market has “drained” the weak sentiment – similar to the macro bottom a year ago. The recovery to 9.2 reflects the strongest reversal speed since 2021 .
When 90% of short-term tokens are profitable, every “wind” of bad news can lead to a “harvest wave” of profits. History shows: if new inflow (ETF, spot CVD) is close to 2,000 BTC/day while the index is still greater than 9.0 → the possibility of forming a local top increases significantly.
The STH Supply in Profit/Loss indicator is currently in the “hot” zone – implying that the market has moved into a state of excitement, but is not yet too broken as long as new money flows.
The key is the demand support: if ETF & spot CVD remain strongly positive, the 109k zone can be penetrated quickly. Conversely, when capital flows cool down, the >9.0 zone of the STH-P/L index often marks a short-term top .
Investors should exploit the uptrend while being disciplined in moving stop-losses and closely monitoring ETF cash flows – the decisive factor in the bull-run's durability as it approaches its historical peak.

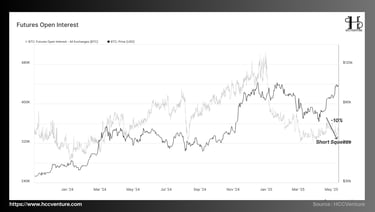
The squeeze was triggered when over 34,000 BTC contracts were forcibly closed within 48 hours – equivalent to $3.5 billion in margin evaporated (estimated in notional value).
This is the largest deleveraging since the 12-Mar-2024 crash , confirming that the derivatives market “follows” rather than “leads” spot.
Meanwhile, the OI/Market-Cap ratio fell to 1.52%, approaching the historical “neutral” zone of 1.4 – 1.6%. With the Funding rate returning to +5 bps/day, no longer experiencing prolonged negative interest rates, it can be said that the Short side is gradually losing its advantage.
As leverage decreases, implied volatility for the 1W term falls to 43%, a 5-week low, and the probability of a short-term “flash-crash due to chain liquidation” is significantly reduced, creating a more solid foundation for the ATH retest scenario.
The recent short squeeze not only pushed BTC price above $104,000 but also rebalanced the leverage structure in the derivatives market, pulling Futures Open Interest to a healthier level.
This reduces the risk of a short-term “liquidation bomb” and creates room for a sustainable uptrend, provided that spot-ETF cash flow continues to be maintained . Investors should pay attention to the OI threshold of 340,000 BTC: maintaining below this level is a signal confirming that the market has “shaken off” enough shorts and is ready for a new advance to the $112,000 - $115,000 zone.
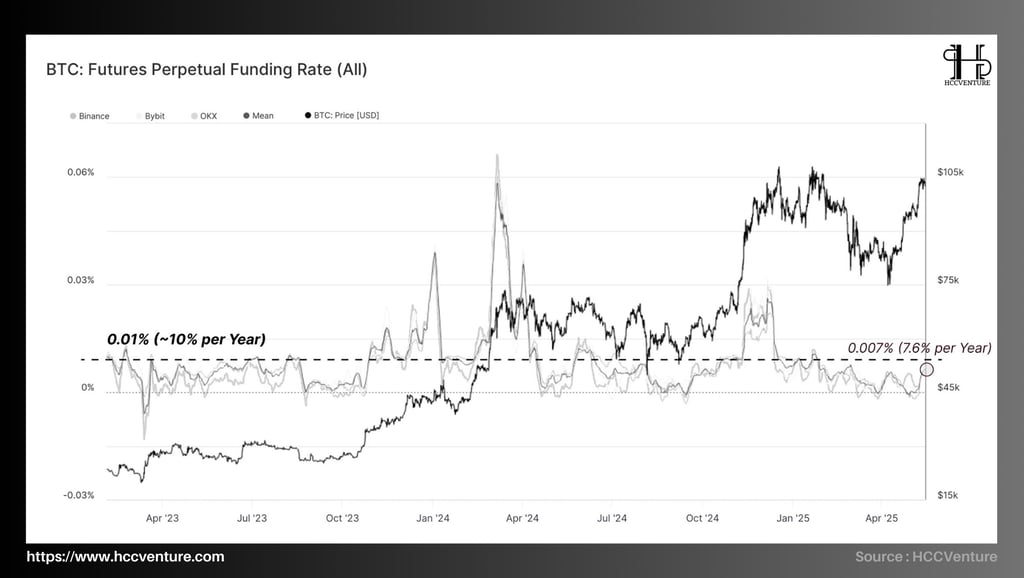
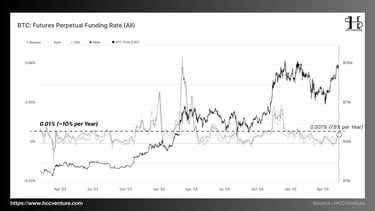
Funding rate around 0.007% shows that the derivatives market is “lagging behind” but not hindering the upward momentum of spot . The data is shown through a summary from Binance, OKX and Bybit:
Average funding rate of 3 major exchanges (Binance, OKX, Bybit) : ≈ 0.007% every 8 hours -> equivalent to 7.6%/year , lower than the historical benchmark by 0.01% (~10%/year).
Amplitude of fluctuation from the end of April to now: -0.003% → 0.011% , no extreme "spike" like the peak in January 2024 (+0.065%).
The estimated leverage ratio (OI/Spot Vol) is still in the 0.9 – 1.1 range , compared to 1.4 – 1.6 in previous euphoria periods.
Small positive funding → Long side pays moderate premium, implying that there is expectation of price increase but not yet excitement . This is consistent with the scenario of spot leading, futures following.
Since the late April squeeze, funding has reversed from a slight negative to a steady positive. The return of premium Longs has been synchronous, not explosive , suggesting that leveraged money is entering the position in a controlled manner.
Funding and OI decreased by 10% (previous analysis) → margin level is less sensitive to price fluctuations compared to the beginning of Q1. This reduces the probability of chain-liquidation pulling the price suddenly down.
The current leverage structure is healthy, allowing for a sustained advance towards the ATH of $109,000 – $112,000, provided spot/ETF inflows continue. Investors should closely monitor funding above 0.02%, a threshold that signals FOMO and a possible technical reversal.

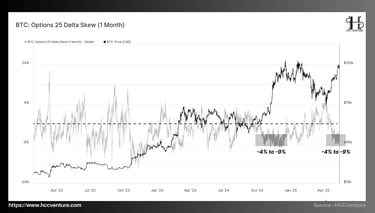
During the sideways move of $75,000–$85,000, the skew hovered around 0% indicating neutral hedging demand. When price broke above $95k, the skew plunged to −6% indicating Puts were abandoned , with traders favoring Calls to chase the rally.
If we look at previous cycles compared to the present:
T1-2024: Skew down to −12% before strong correction ⇒ market is over-excited.
Current: −6% → half tension , implying bullish expectations but no extreme FOMO yet .
Funding is only 0.007%/8h; OI down 10%. Derivatives still have a lot of room to open Long . From a risk perspective, the resonance between moderate negative skew + low leverage creates a more solid foundation than previous hot surges.
Important observation threshold:
Skew lower than −10% with IV spike → “order-implied blow-off” warning, easy to shake out.
Skew returns to greater than −2% when price has not exceeded ATH → signal of cooling down, buyers Calls to take profit, may lead to technical correction.
Options sentiment is clearly bullish but not yet overheated , reinforcing the argument that the $93,000 to $104,000 rally is supported by real demand from spot, ETFs and now options.
Defensive investors can take advantage of selling 1-month OTM delta-25 calls to collect premiums above historical averages while protecting their spot portfolio.
If skew continues to slide below −10% and funding exceeds 0.02%/8h, it is advisable to reduce leverage Long exposure, in case the market cools down by itself with a short-term flush.
In summary, the moderate negative skew is currently acting as a catalyst, not a trigger. In the absence of saturation signals, the outlook for a breakout to ATH $109,000 – $112,000 remains intact.
Evaluation and Conclusion
Spot cash flow increased strongly as ETF Spot is still the "driver" continuously attracting traditional investment capital, reaching 1.171 million BTC AUM, close to the historical peak. In addition, Coinbase AVD index maintained strong net buying, while selling pressure on Binance cooled down to -9M USD/day.
-> “Real money is driving Bitcoin’s value, unlike the trust-based and leveraged rallies of the past.
Large on-chain volume changes hands at this price range creating a synergistic cost-basis for both Short-Term Holders and ETFs. Breaking the $95,000 zone would trigger a potential supply of ~2.1M BTC in short-term profit
-> The risk of a deep correction may occur when short-term investors start to take short-term profits and create extreme fear behavior in the market while growth confidence is high.
OI futures decreased by 10% after short squeeze, funding only 0.007%/8h → low leverage risk .
25-Delta Skew (1M) at –6% shows options traders are long calls but not FOMO yet; IV around 50% is still below 2021–2022 cycle median.
→ There is still room for derivative cash flow to "catch up" with spot, helping to accelerate the trend.
As the market structure remains “spot-led, leverage-light”, the scenario of breaking ATH 109k and aiming for technical target 118,000–122,000 in summer is high probability.
-> Long-term investors maintain core positions, consider OTM call insurance with a term of 1-2 months. Short-term traders take advantage of the pullback to $97,000 - $99,000 to open Long, cut loss below $93,000.
In short , Bitcoin is currently in a “healthy” growth phase where spot cash flows play a dominant role and derivatives leverage is not saturated. As long as ETF flows remain stable and the $95,000 defense zone is protected, the trend of conquering new record price levels remains the most likely scenario.
Once again we give our opinion on potential projects in the crypto market. This is not investment advice, consider your portfolio. Disclaimer: The views expressed in this article are solely those of the author and do not represent the platform in any way. This article is not intended to be a guide to making investment decisions.
API & Data : Glassnode
Compiled and analyzed by HCCVenture
Join our telegram community: HCCVenture
Explore HCCVenture group
HCCVenture © 2023. All rights reserved.


Connect with us
Popular content
Contact to us
E-mail : sp_contact@hccventure.com
Register : https://linktr.ee/holdcoincventure
Disclaimer: The information on this website is for informational purposes only and should not be considered investment advice. We are not responsible for any risks or losses arising from investment decisions based on the content here.
TERMS AND CONDITIONS • CUSTOMER PROTECTION POLICY
ANALYTICAL AND NEWS CONTENT IS COMPILED AND PROVIDED BY EXPERTS IN THE FIELD OF DIGITAL FINANCE AND BLOCKCHAIN BELONGING TO HCCVENTURE ORGANIZATION, INCLUDING OWNERSHIP OF THE CONTENT.
RESPONSIBLE FOR MANAGING ALL CONTENT AND ANALYSIS: HCCVENTURE FOUNDER - TRUONG MINH HUY
Read warnings about scams and phishing emails — REPORT A PROBLEM WITH OUR SITE.