

On-chain analysis week 19/2026: Neutral market - accumulation demand remains low
The market is currently showing an improvement in capital flow structure, but has not yet reached a sufficiently strong conviction to confirm a full-blown acceleration cycle.
PHÂN TÍCH
5/14/202616 min read
On-chain analysis week 19/2026: Neutral market - accumulation demand remains low
The market is currently showing an improvement in capital flow structure, but has not yet reached a sufficiently strong conviction to confirm a full-blown acceleration cycle.
Analysis • 14 May, 2026


Market Summary
Bitcoin is currently trading around $81,000 after a deep correction from its peak of $120,000 to $70,000. All on-chain indicators point to a market in the initial recovery phase after capitulation, with extremely low selling pressure from all sources but still lacking strong upward momentum.
Transactions have dropped to only 20,000-30,000 transactions per day, the lowest in the entire cycle, indicating that investors have almost stopped sending Bitcoin to exchanges to sell. The market structure shows a clear stratification. However, detailed analysis using Realized Price - UTXO Age Bands shows that Short-Term Holders (1 week - 3 months) are making slight profits of 3-9%, while Medium-Term Holders (3-6 months) are still losing 8-10% with a cost basis of $88,000-$90,000.
The Coinbase Premium Index is near 0, indicating that the US/institutional market is in a neutral state, with no strong capital inflow yet. The Futures Volume Bubble Map shows green (Cooling), reflecting low futures volume and a lack of high leverage. The Token Transferred Ratio (US vs Offshore) at 1.5 shows relative balance, with no signs of FOMO from any market.
A notable divergence is occurring between traditional markets and Bitcoin. While the S&P 500 and NASDAQ are consistently reaching new historical highs in May 2026, with technology stocks surging over 20% thanks to the AI wave and Q1 earnings exceeding expectations (84% of S&P 500 companies beat EPS), Bitcoin is still trading 32% below its $120,000 peak and shows no signs of a strong recovery.
Analyzing on-chain metrics
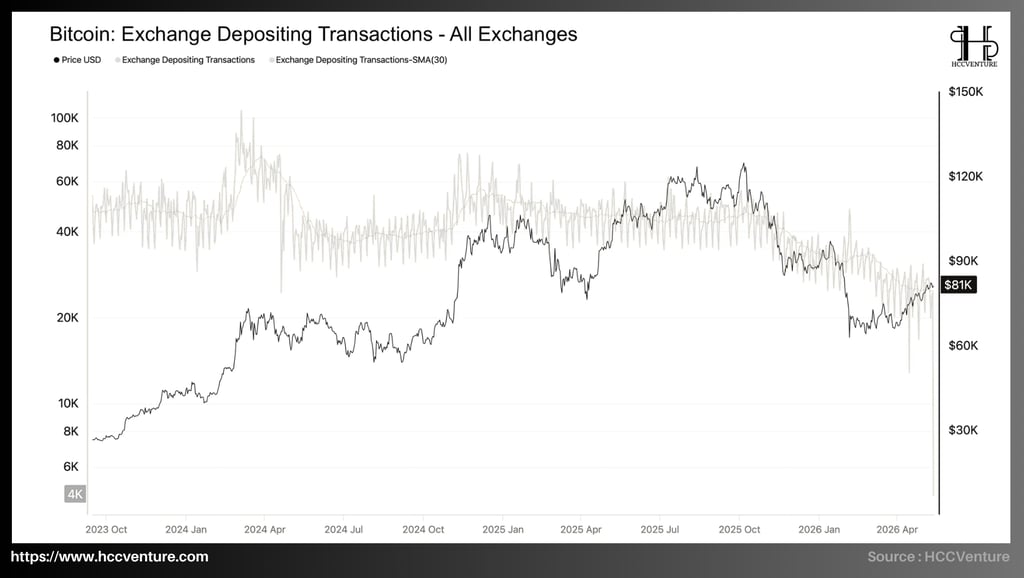
Bitcoin is currently trading around $81,000, amidst a sharp decrease in deposit transactions compared to previous distributions. The Exchange Depositing Transactions chart (the number of Bitcoin transactions transferred to exchanges) is showing important signals about investor behavior in the current period.
Looking at historical data from late 2023 to the present, we see a clear pattern: strong spikes in Exchange Depositing Transactions typically occur at or near price peaks, reflecting strong profit-taking pressure from investors. Most notably, in the current period (April 2026), Exchange Depositing Transactions have fallen to unprecedented lows since the beginning of the growth cycle. This indicator is currently fluctuating around 20,000-30,000 transactions, significantly lower than the average of 40,000-50,000 transactions throughout the 2024-2025 cycle.
In previous Bitcoin cycles, periods of low Exchange Depositing Transactions typically followed a deep correction, when weak investors were shaken out and those remaining had a more stable holding mentality. The current low level of Exchange Depositing Transactions, combined with Bitcoin's approximately 32% correction from its peak ($120K to $81K), reflects a market undergoing a rebalancing phase.
Exchange Depositing Transactions are sending a positive signal as selling pressure from transferring Bitcoin to exchanges has decreased to its lowest level in the current cycle. Although the price has corrected significantly from its peak of $120K, investors are not rushing to transfer coins to exchanges to sell off as in previous panic phases.
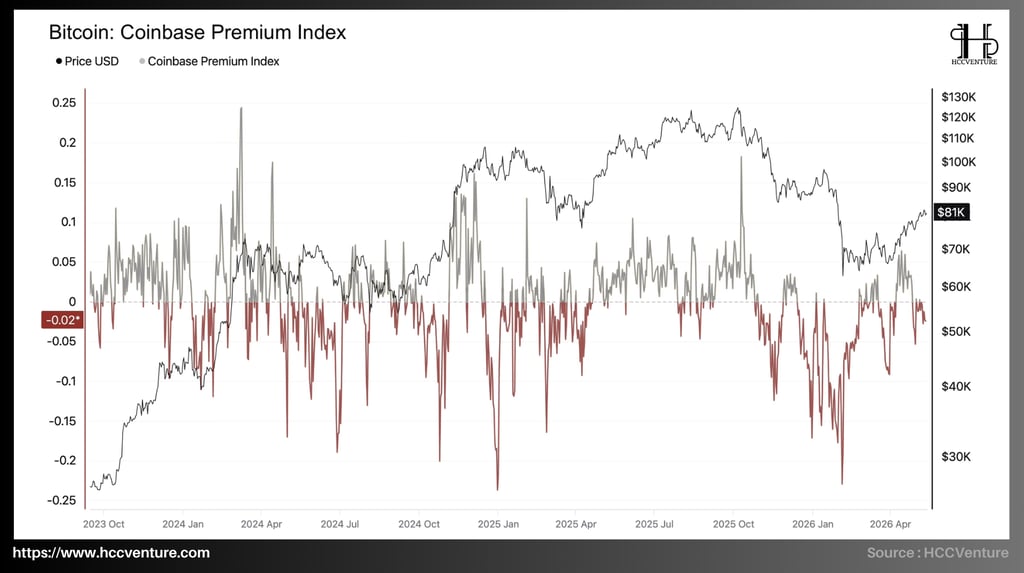
The Coinbase Premium Index is currently at -0.02, near equilibrium at 0, after recovering from a deep negative zone of -0.20 in early 2026. This index reflects the Bitcoin price difference between Coinbase (US/institutional market) and other global exchanges, and is one of the key tools for measuring the behavior of institutional and investor capital flows in the US.
Looking at historical data, we see a clear pattern: high Coinbase Premium Index spikes (>0.15) often occur at or near Bitcoin's price peaks, reflecting periods of FOMO and strong institutional capital inflows into the market. These high premiums are usually unsustainable. After each surge, the Premium Index quickly reverses and falls sharply, indicating that institutional capital tends to buy at the peak and then withdraw when the price begins to correct.
In contrast to high premium periods, deep negative Premium Index periods (<-0.15) typically occur during sharp price corrections, reflecting selling pressure from the US market or the complete absence of buying demand from institutional investors.
A notable point at the present time (April 2026) is that the Coinbase Premium Index has recovered significantly from the deep negative zone of -0.20 to -0.02, near the equilibrium point of 0. Although the price of Bitcoin is still fluctuating around $81K after the correction from $120K, the Premium Index is showing positive signs: selling pressure from the US market has decreased significantly, and the market is shifting to a neutral state.
This improvement is a stark contrast to previous correction phases, when the Premium Index could remain in deep negative territory for months. The rapid recovery of the Premium Index to near zero suggests that US/institutional investors have stopped selling off, although there are no positive signs of a strong return to buying.
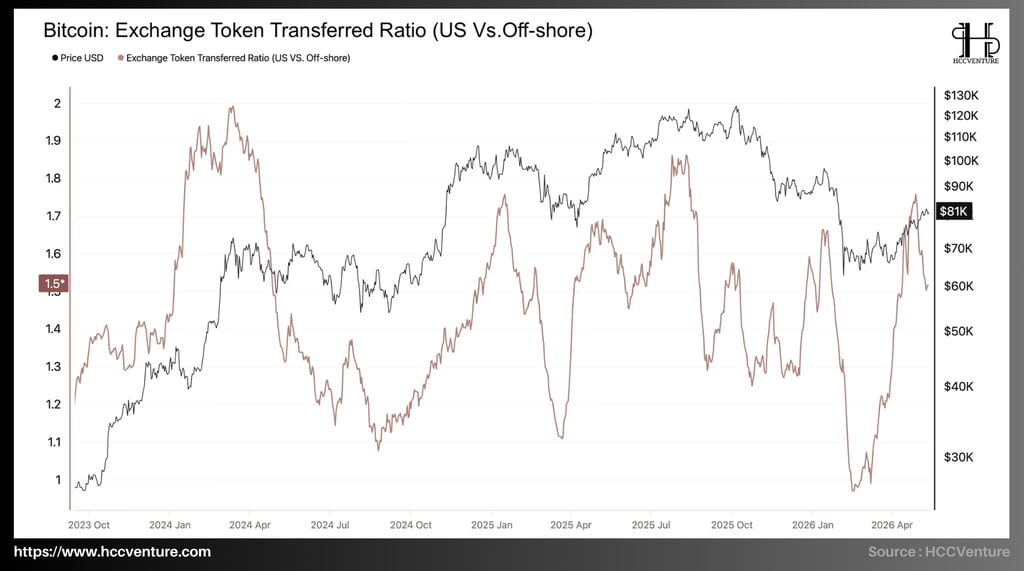
The Exchange Token Transferred Ratio (US vs. Off-shore) measures the ratio of Bitcoin transferred to US exchanges (such as Coinbase, Kraken, Gemini) compared to offshore exchanges (such as Binance, Bybit, OKX). When the ratio is greater than 1, it means that more Bitcoin is being transferred to US exchanges than offshore exchanges. Conversely, when the ratio is less than 1, offshore exchanges are receiving more Bitcoin.
One of the clearest patterns from this chart is the frequency of ratio spikes to >1.8-2.0, often occurring at or near Bitcoin's price peaks, reflecting that US investors are depositing Bitcoin into exchanges at twice the rate of offshore investors. In July-August 2025 , the ratio rose to 1.8-1.85 as Bitcoin approached the $120K region for the second time. Although it didn't reach 2.0 like the previous spike, the ratio remained unusually high, reflecting a continued tendency for US investors to aggressively take profits at high prices.
A common thread among these high ratio periods is that they mark a phase where US investors engage in significantly more aggressive selling than offshore investors. While the offshore market maintains relatively stable trading activity, US investors tend to increase their Bitcoin deposits on exchanges when prices are high to lock in profits, creating significant selling pressure and often leading to subsequent price corrections.
This record low occurred during Bitcoin's correction from $120,000 to the $70,000 range, reflecting a key phenomenon: US investors almost completely stopped transferring Bitcoin to exchanges, while the offshore market maintained relatively higher trading activity. This can be explained in two ways:
American investors sold off their Bitcoin during previous high price phases (when the ratio reached 1.8-2.0), and now there isn't much Bitcoin left to deposit on exchanges.
American investors are holding onto Bitcoin , unwilling to sell off at low prices after witnessing a significant drop from its peak.
Currently (April 2026), the ratio has recovered significantly from its record low of 0.95 to 1.5. This is a positive sign, indicating that US investors are gradually returning to the market, increasing their Bitcoin transfers to exchanges. However, the 1.5 level is still significantly lower than the extremely high ratios of 1.8-2.0 a
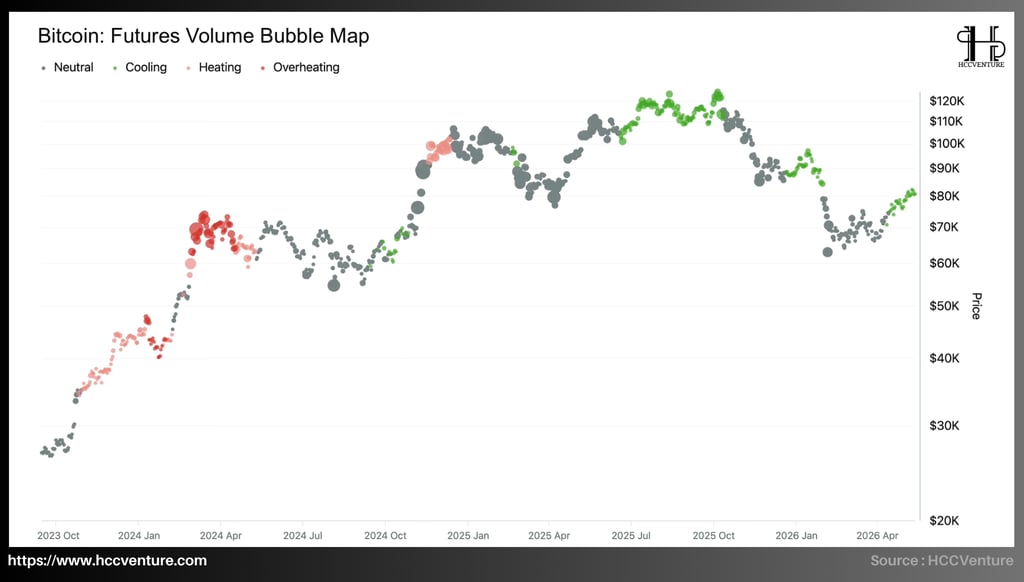
The Futures Volume Bubble Map uses the size and color of bubbles to represent futures trading volume and market "heat":
Bubble size : The larger the bubble, the higher the volume of futures.
This indicator is particularly important because high futures volume is often accompanied by high leverage, creating significant liquidation risk and volatile price movements. "Overheating" (red) phases typically mark short-term peaks, while "Cooling" (green) phases reflect a lack of leverage and speculation.
The first notable period was February-March 2024, when Bitcoin surged from $30,000 to $70,000. At the peak of $70,000, the Futures Volume Bubble Map displayed extremely large, dark red bubbles (overheating). This was a clear sign of an overheated market, with the surge in futures volume reflecting strong participation from traders using high leverage.
This "overheating" phase occurs after a strong rally from $40,000-$50,000, when the bubble begins to shift from gray to orange, then to red as it approaches $70,000. The increase in both the size and color of the bubble reflects widespread FOMO in the futures market, with traders aggressively opening long positions with high leverage to "buy the dip" of the price surge.
However, true to market trends, this "overheating" peak was quickly followed by a sharp correction. After reaching $70,000, the price of Bitcoin dropped to $60,000-$65,000, and the bubble turned from red to gray, reflecting a sharp decrease in futures volume as positions were liquidated or traders took profits/cut losses.
Despite Bitcoin reaching a record high of $120,000 (almost double its previous peak), the futures market did NOT show corresponding enthusiasm. Futures volume at $120,000 did not increase as much as at $70,000, and the green color indicates the market is in a "cooling" state, not an "overheating" state. History shows that sustained price rallies often require support from both the spot and futures markets. When such divergence occurs, the price peak is usually unsustainable, and as predicted, after reaching $120,000, Bitcoin corrected sharply down to $70,000 in the following months.
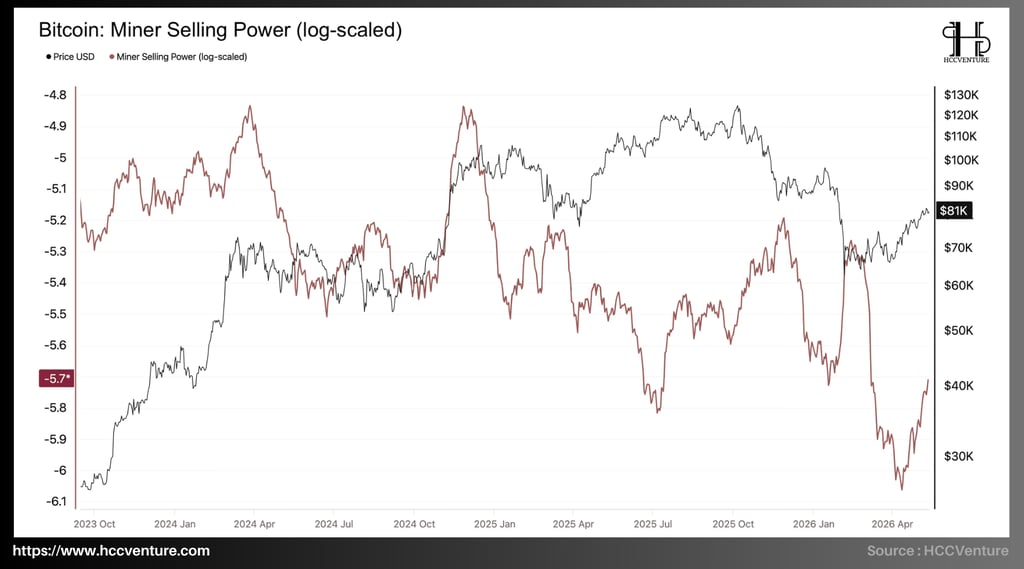
Miner Selling Power is currently at -5.7, close to the record low of -6.0 in February-March 2026, indicating extremely low selling pressure from Bitcoin miners despite the price recovery to $81,000. Miner Selling Power measures selling pressure from Bitcoin miners. Using a logarithmic scale, a higher value (closer to -4.8) means greater selling pressure from miners, while a lower value (closer to -6.0) indicates less selling pressure.
Miners occupy a unique position within the Bitcoin ecosystem: they are a source of new supply, constantly receiving Bitcoin from the mining of new blocks. To maintain operations, miners must sell a portion of their Bitcoin to cover operating costs such as electricity, equipment, labor, and other expenses. When the price of Bitcoin is high, miners tend to increase selling pressure to maximize profits. Conversely, when the price is low, miners usually try to hold onto their Bitcoin and only sell enough to cover essential expenses.
The miners' increased selling pressure at the peak is not just normal behavior, but also a crucial warning signal for the market. When Bitcoin producers – those with specific production costs and deep industry knowledge – decide to sell aggressively, it often reflects an assessment that the current price is significantly higher than its fair value or their production costs. As expected, after Miner Selling Power peaked at -4.8, the price of Bitcoin began to correct from $70K to $60K-$65K. This difference is noteworthy and can be explained in several ways:
Miners sold off their inventory at lower prices : It's possible that miners took significant profits during the price surge from $80K to $100K-$110K, so when the price reached $120K, they didn't have much Bitcoin left to sell.
Belief in higher prices : Miners may believe that the price of Bitcoin will rise even higher than $120,000, so they decide to hold onto their Bitcoin instead of selling immediately.
Increased production costs : After the halving (reducing the block reward by half), the cost of producing each Bitcoin doubled. At $120,000, miners' profit margins may not be as high as expected, so they have less incentive to sell.
Regardless of the explanation, the fact that miners did not significantly increase selling pressure at $120K is a warning sign of a lack of conviction from the Bitcoin producing group. Combined with the Futures Volume Bubble Map showing "Cooling" at $120K, this further strengthens the hypothesis that the $120K peak lacked strong support from the main market participants.
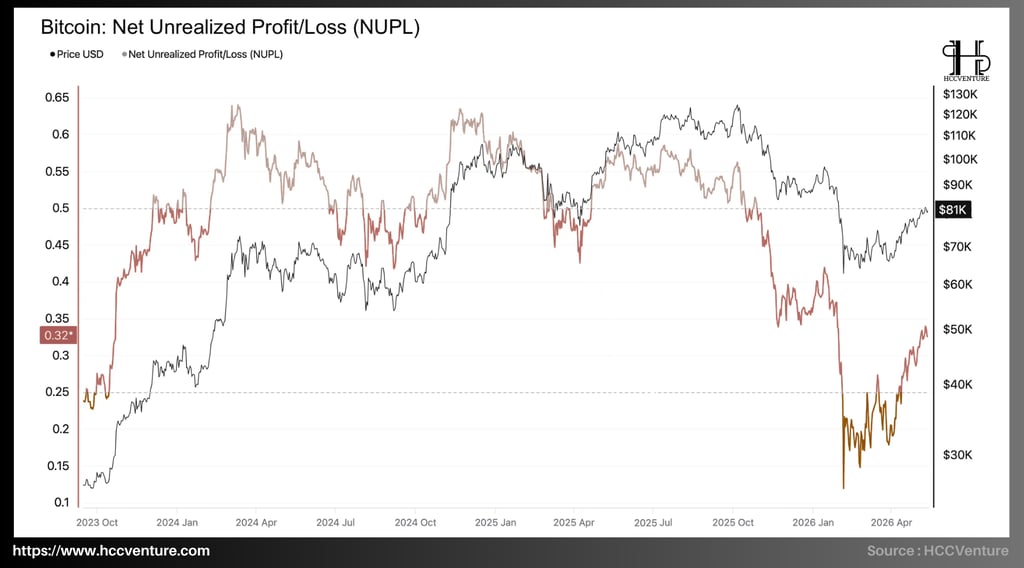
The Net Unrealized Profit/Loss (NUPL) is currently at 0.32, recovering from lows of 0.15-0.18 in February-March 2026, indicating the market is in an "Optimism/Anxiety" phase with unrealized profits at an average level. NUPL measures the ratio between unrealized profits and Bitcoin's market capitalization. This indicator reflects overall market sentiment based on whether the majority of holders are making profits or losses, and the extent of those profits/losses.
NUPL zones are categorized according to market sentiment:
NUPL > 0.75 : Euphoria/Greed - Peak of the cycle, most holders have made large profits.
0.5 < NUPL < 0.75 : Belief/Denial - Late bull market, good profit potential.
0.25 < NUPL < 0.5 : Optimism/Anxiety - Bull market at the beginning/middle or during a recovery, moderate profit.
0 < NUPL < 0.25 : Hope/Fear - Near the bottom or early stage of recovery, low returns.
NUPL < 0 : Capitulation - Cycle bottom, most holders lose money.
NUPL is a dynamic indicator that reflects not only the current price but also the cost basis distribution of all Bitcoin in the system. When many people buy Bitcoin at a high price, even if the price increases, NUPL may not increase proportionally because late buyers have little or no profit.
The first notable phase was in March 2024, when Bitcoin peaked at $70,000 after a sharp rise from $30,000. The NUPL surged from 0.25 to 0.63-0.64, reflecting that the majority of holders were making significant profits of around 63-64%. However, this NUPL level remained within the "Belief/Denial" range (0.5-0.75) and did not reach the "Euphoria" range (>0.75) seen at previous cycle peaks.
Although the price of Bitcoin doubled from $30,000 to $70,000, the NUPL (Number of Per Shares) only reached 0.64, indicating that a significant number of holders still bought Bitcoin at higher prices of $50,000-$60,000. These holders made little or no profit at $70,000, pulling the NUPL lower than the typical euphoria of a cycle peak. After peaking at 0.64, the NUPL fell to 0.53-0.58 as the price corrected to $60,000-$65,000, suggesting that some holders had taken profits and the market began a correction phase.
A NUPL level of 0.15-0.18 indicates that only about 15-18% of the unrealized profits remain in the entire Bitcoin system. This means that the majority of holders – especially those who bought during the $80K-$120K period – are in a state of significant losses or are close to breaking even at the $70K price. This low NUPL level typically marks the capitulation zone or the final stage of a correction. When the NUPL falls below 0.25, selling pressure from those with significant losses has almost subsided, and those still holding Bitcoin are usually highly convinced holders unaffected by short-term price fluctuations.
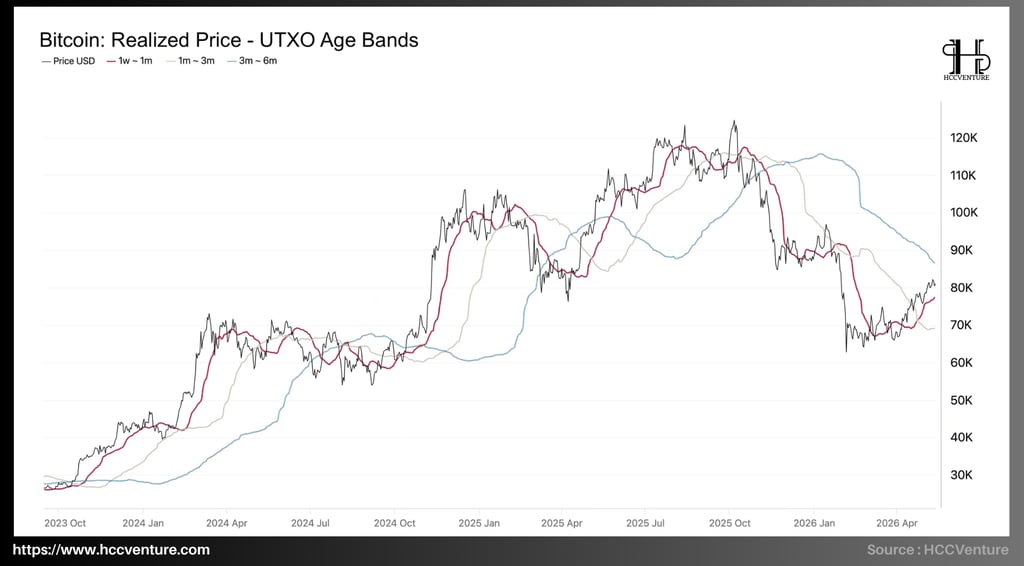
Realized Price - UTXO Age Bands measure the average price at which Bitcoin was last bought (or moved) over different time periods. UTXO (Unspent Transaction Output) is the basic unit of Bitcoin, and the "age" of a UTXO indicates when that Bitcoin was last moved. When the spot price (current price) is higher than a group's Realized Price, that group is profitable. Conversely, when the spot price is lower than the Realized Price, that group is losing money. Selling pressure often arises when a large group of holders moves from a loss to a profit (or from heavy losses to light losses), as this is when they have an incentive to take profits or cut losses.
During the period when Bitcoin surged from $30,000 to $70,000 (October 2023 - March 2024), the Realized Price of all three groups increased sharply, with the 1w~1m group (green) rising the fastest, reaching $65,000-$68,000 at its peak. This indicates that a significant amount of new Bitcoin was purchased during this period, especially at the $50,000-$70,000 price levels.
However, since the Realized Price for 1 week to 1 month only reached $65K-$68K at the peak of $70K, most short-term holders still have a certain profit "buffer" (around 3-7%). This is a relatively positive sign, indicating that not too many people bought correctly at the peak of $70K.
After the price corrected from $70K to $60K-$65K, the Realized Price of all groups gradually decreased, reflecting that Bitcoin was being sold/moved at a lower price than its peak. Specifically, when the price dropped below $60K, the spot price was 3m-6m lower than the Realized Price ($60K-$65K), indicating that those who bought 3-6 months earlier (at the peak of $70K) were now in a loss.
A particularly important point will emerge at the $120K peak in July-August 2025. When Bitcoin reaches its record high of $120K, the Realized Price of all three groups will rise to EXTREMELY HIGH LEVELS. The Realized Price of the 1w~1m group reaching $115K-$118K at the $120K peak means that the majority of new Bitcoin purchased in the last week-month was bought at $110K-$120K, very close to the peak price. Similarly, the Realized Price of the 1m~3m group at $112K-$115K shows that buyers from the previous 1-3 months also purchased at extremely high prices.
Research and Analysis
Market Summary
Analyzing on-chain metrics
Exchange Depositing Transactions
Coinbase Premium Index
Exchange Token Transferred Ratio (US vs. Off-shore)
Futures Volume Bubble Map
Miner Selling Power
Net Unrealized Profit/Loss (NUPL)
Realized Price - UTXO Age Bands
SOPR Ratio (LTH-SOPR/STH-SOPR)
Miners' Position Index (MPI)
Assessment and Conclusion
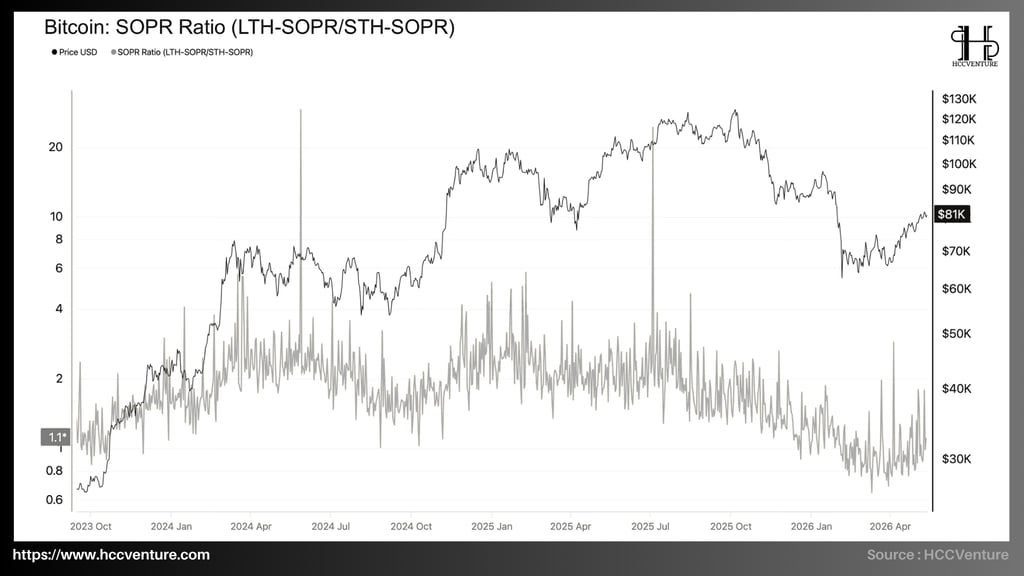
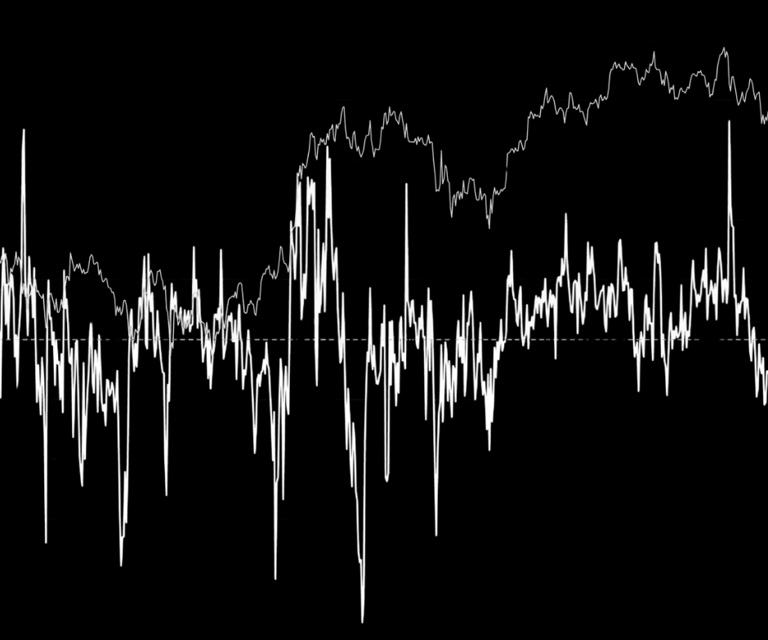
The SOPR Ratio (LTH-SOPR/STH-SOPR) is currently at 1.1, reflecting the equilibrium between selling behavior of Long-Term Holders and Short-Term Holders at the $81K price level. This indicator provides a unique perspective on market dynamics by comparing the profit/loss levels when the two main groups of holders sell Bitcoin, helping to identify distribution and capitulation phases in the market cycle.
The first phase was particularly noteworthy in March 2024, when Bitcoin peaked at $70,000. The SOPR Ratio surged to 8, even spiked to 20-25, the highest level in the entire cycle. This was an extremely strong warning sign of a market peak.
This is a typical pattern of the distribution process: LTH – those who bought Bitcoin at low prices of $20,000-$40,000 and held for more than 155 days – are aggressively taking profits at the $70,000 peak, selling Bitcoin to Short-Term Holders – those who FOMO bought at or near the peak. When the SOPR Ratio reaches extremely high levels like 8-25, this is often a sign of a local or cyclical peak, as smart money is exiting the market. After the SOPR Ratio peaks, the price of Bitcoin begins to correct from $70,000 to $60,000-$65,000, and the SOPR Ratio drops to 2-3, confirming that the strong distribution phase has ended.
In the context of Bitcoin's drop from $120K to $70K, an SOPR Ratio < 1 reflects that Short-Term Holders – those who bought during the $70K-$90K period – are panic selling to cut losses or minimize losses, while Long-Term Holders are holding onto Bitcoin without selling. This is a sign of the final stage of a correction, when weak holders have been shaken out, leaving only those with strong conviction. Historically, Bitcoin's SOPR Ratio < 1 often appears at or near the bottom of a cycle , marking the end of the capitulation phase and the beginning of the accumulation phase.
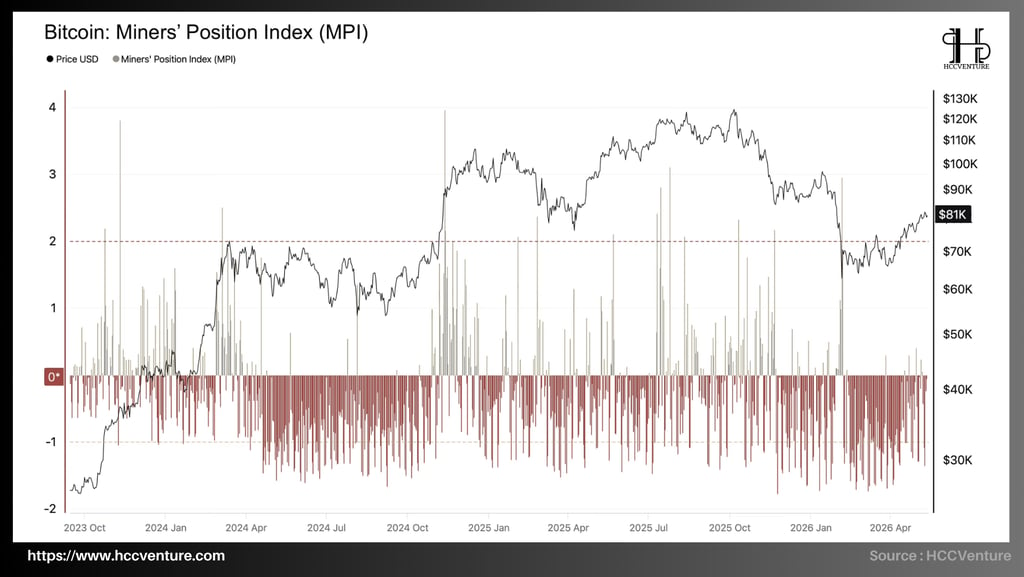
The Miners' Position Index (MPI) is currently near 0, indicating that miners are engaging in relatively normal selling activity after a period of strong accumulation (deep negative MPI of -1.5 to -1.8) during the price correction to $70,000. This index adds important insight into miner behavior by comparing current selling levels to historical averages, helping to identify periods of strong miner distribution or accumulation.
MPI measures the ratio of Bitcoin outflow from miners (the amount of Bitcoin miners send out, usually to sell) to the moving average of that outflow. Unlike Miner Selling Power, which measures absolute selling pressure, MPI measures RELATIVE selling pressure relative to the average. MPI is particularly useful for identifying times when miners are "all-in" selling (very high MPI) or "all-in" holding (very negative MPI), which often coincide with key market turning points.
One of the standout features of the MPI in this cycle is the appearance of extremely high MPI spikes (>2.5-4.0) NOT ONLY at the peak but also during the price increase, reflecting the "batch selling" strategy of miners as prices rise. After each strong selling phase (high MPI spike), miners move into an accumulation phase (negative MPI). This pattern clearly repeats throughout the cycle:
Currently (April 2026), the MPI is close to 0, indicating that miners are selling at a NORMAL level compared to the historical average. This is a significant shift from the previous period of deeply negative MPI (-1.5 to -1.8).
Assessment and Conclusion
Bitcoin is facing strong technical and psychological resistance at $88,000-$90,000. This is not only the Realized Price for Medium-Term Holders (3-6 months) but also the area where many investors bought in late 2025-early 2026 when the market was still optimistic about a surge to $120,000. As the price approaches this area, selling pressure from holders seeking to break even or cut losses will be significant. To sustainably break through $88,000-$90,000, the market needs a strong catalyst – something that is currently unclear.
A stagflation scenario is unfolding and represents the biggest risk for Bitcoin in the short term. Inflation is rising again due to high energy prices, while economic growth shows signs of slowing (Q1 GDP was only 2%, and demand destruction is beginning to appear in Asia with forecasts of a 1.5 million barrel/day drop in oil demand in Q2). In a stagflation environment, the Fed will face significant challenges in policy: cutting interest rates to support growth will push inflation higher, while keeping interest rates high will further stifle growth.
The divergence between Bitcoin and the traditional stock market is a warning sign. Typically, Bitcoin and tech stocks are highly correlated because they are both considered risk assets. However, in May 2026, tech stocks surged and reached new all-time highs thanks to their AI narratives, while Bitcoin remained weak. This suggests that capital is favoring assets with clearer fundamentals (such as tech stocks with AI growth stories) over purely speculatory assets like Bitcoin. If this trend continues, Bitcoin could continue to underperform the overall market.
Bitcoin's history shows that periods with similar structures—low selling pressure, high holder conviction, and clear overhead resistance—are often crucial accumulation phases before a more sustained growth spurt. If Bitcoin can consolidate around $75,000-$85,000 in the next few months, allowing the Realized Price of Medium-Term Holders to gradually decrease and the NUPL to rise to 0.4-0.5, the foundation for the next bull market will be more solid.
Disclaimer: The information presented in this article is the author's personal opinion in the field of cryptocurrency. This is not financial or investment advice. All investment decisions should be based on careful consideration of your personal portfolio and risk tolerance. The views expressed in this article do not represent the official stance of the platform. We recommend that readers conduct their own research and consult with experts before making any investment decisions.
API & Data : Glassnode
Compiled and analyzed by HCCVenture
Join the HCCVenture organization here: https://link3.to/holdcoincventure
Explore HCCVenture group
HCCVENTURE QUANT JSCO
© 2026 HCCVENTURE. ALL COPYRIGHTS RESERVED.


Connect with us
Popular content
Contact to us
Address: 8th Floor, Bach Dang Complex Building, 50 Bach Dang Street, Hai Chau Ward, Da Nang City, Vietnam.
Phone: 1900 1509
Gmail : sp_contact@hccventure.com
Disclaimer: The information on this website is for informational purposes only and should not be considered investment advice. We are not responsible for any risks or losses arising from investment decisions based on the content here.
TERMS AND CONDITIONS • CUSTOMER PROTECTION POLICY
ANALYTICAL AND NEWS CONTENT IS COMPILED AND PROVIDED BY EXPERTS IN THE FIELD OF DIGITAL FINANCE AND BLOCKCHAIN BELONGING TO HCCVENTURE ORGANIZATION, INCLUDING OWNERSHIP OF THE CONTENT.
RESPONSIBLE FOR MANAGING ALL CONTENT AND ANALYSIS: HCCVENTURE FOUNDER - TRUONG MINH HUY
Read warnings about scams and phishing emails — REPORT A PROBLEM WITH OUR SITE.