


On-chain analysis week 19/2025: Bitcoin is regaining momentum
Bitcoin hit a more than two-month high of $104k this past week, marking a strong move in price momentum. This recovery has brought a marked improvement in the financial position of investors, with more than 3 million BTC returning to a profitable state.
5/12/20256 min read
Situation Summary
The price recovery has brought about a significant reduction in selling pressure , with over 3 million BTC moving from a loss to a profit . At the recent bottom at $74k, over 5 million BTC were “underwater”, but that number is now down to around 2 million BTC , reflecting a rapid improvement in market sentiment.
Total Realized Cap (total capitalization at actual purchase price) has reached an all-time high of $889B , demonstrating the influx of large capital flows.
Notably, after a period of strong ETF withdrawals, the market has just recorded +4.6 billion USD inflows into BTC ETFs in the past 2 weeks — a clear sign that institutions are returning.
The market is close to the average cost of Short-Term Holders , and at the same time there is a large supply cluster around the current price , increasing sensitivity to price fluctuations.
According to Long-Term Holder behavioral analysis:
The $95k–$98k zone is where many investors are buying at breakeven → profit-taking activity may occur at the breakeven point .
As the price approached $99.9k , LTH's unrealized profit reached +350% , a level that typically triggers historic selling waves .
Notably, the volatility premium across the entire contract term is contracting — a sign that volatility expectations are undervalued . This could lead to a period of unexpectedly high volatility , followed by a large breakout or correction.
On-chain metrics analysis
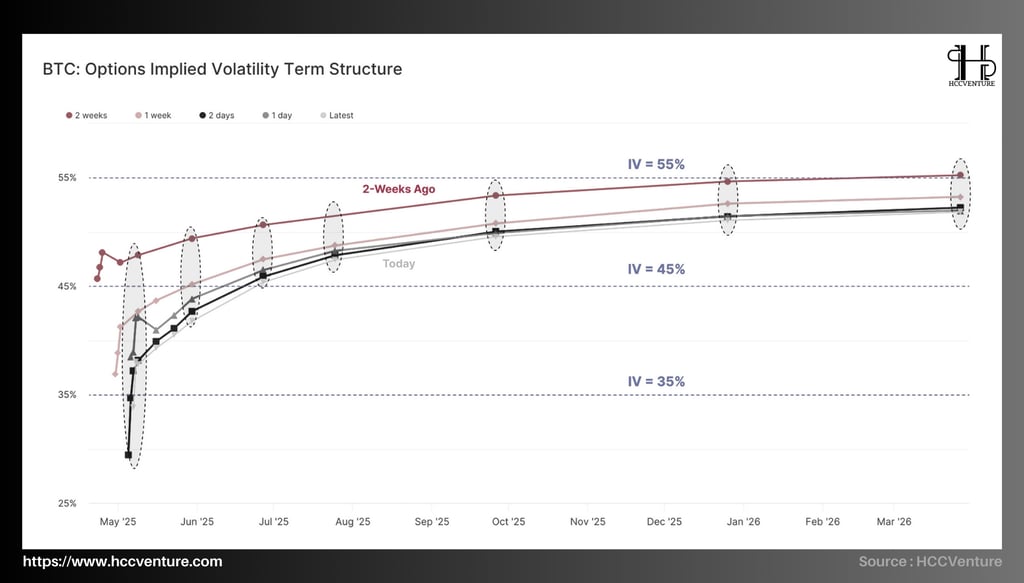
Implied Volatility Term Structure (IV) analysis shows a strong compression of volatility premiums across the entire set of options contracts. In particular:
May contracts saw the most pronounced IV decline.
Long-term options until March 2026 are now only at a premium of ~50% , a historically low number .
This suggests that the market is pricing in low volatility in the future , reflecting Bitcoin's gradual maturation as an asset . The 2023–2025 cycle sees Bitcoin trading with much lower volatility than previous cycles.
Are markets underestimating the likelihood of a major volatility shock?
With key resistance levels approaching, and potential selling pressure from LTH, the market could be caught off guard if a strong breakout occurs, followed by a rapid expansion of volatility .
Solid growth , record real market cap, and return of ETF inflows are strong signals. However, short-term resistance zones ($95k–$99.9k) are creating significant technical and psychological barriers. The compression of implied volatility suggests that the market may be underestimating the volatility risks ahead.
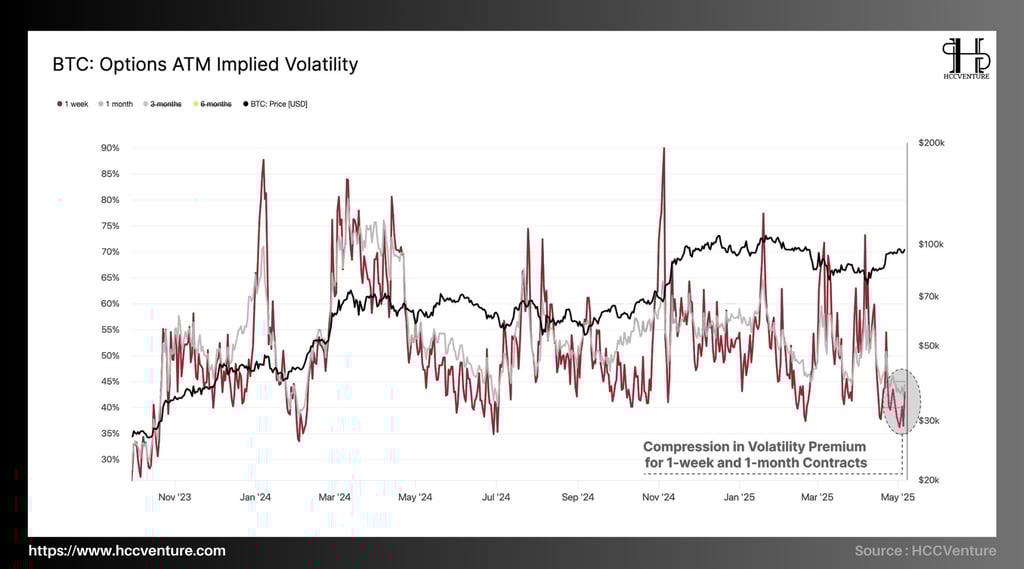
Moving to the options segment, a notable sign is forming in the market's implied volatility (IV) structure:
Both the at-the-money (ATM) IV of the 1-week and 1-month contracts are recording sharp declines .
The current level IV is the lowest it has been since July 2024 , almost a year ago.
Options traders do not expect a volatile scenario in the short term . In other words, market sentiment is currently leaning towards stability, or at least not expecting a major shock in the near term.
Periods of extremely low implied volatility often precede periods of high realized volatility.
This is a common phenomenon during repricing cycles, when market complacency is shattered by an unexpected event. Low volatility is not only an indicator of low expectations for short-term risk, but also often acts as a valuable contrarian indicator.
The market is in a state of “volatility compression” , as reflected by the extremely low implied volatility in options contracts. This could pave the way for a period of strong volatility expansion in the near future.
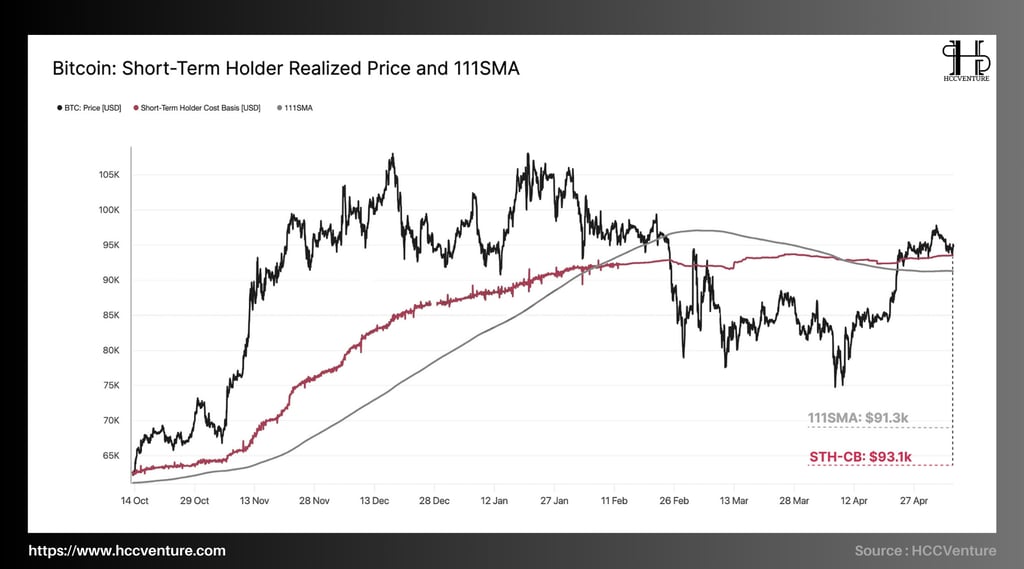
As stated in previous analyses, two price levels that are strategically important in establishing and maintaining market momentum include:
111 Day Moving Average (111DMA): $91.3k
Short-Term Holder Cost Basis: $93.2k
The recent rally in the market has successfully broken through both of these price zones , marking a clear sign of improving momentum. However, after the rally, the price has pulled back to test the demand at the aforementioned support zone — a healthy behavior if the price continues to hold.
Looking at the daily chart , Bitcoin price is currently:
Establishing a "higher high" pattern — a technical signal for a sustainable uptrend.
Attempts to consolidate in the same breakout zones show that buyers are testing the sellers' tolerance for heat.
If the price breaks below the two pattern levels , the current rally could be considered a “false breakout”, and the possibility of a reversal would increase. The current price momentum remains positive , especially as key technical levels are conquered and are being retested in an orderly manner.
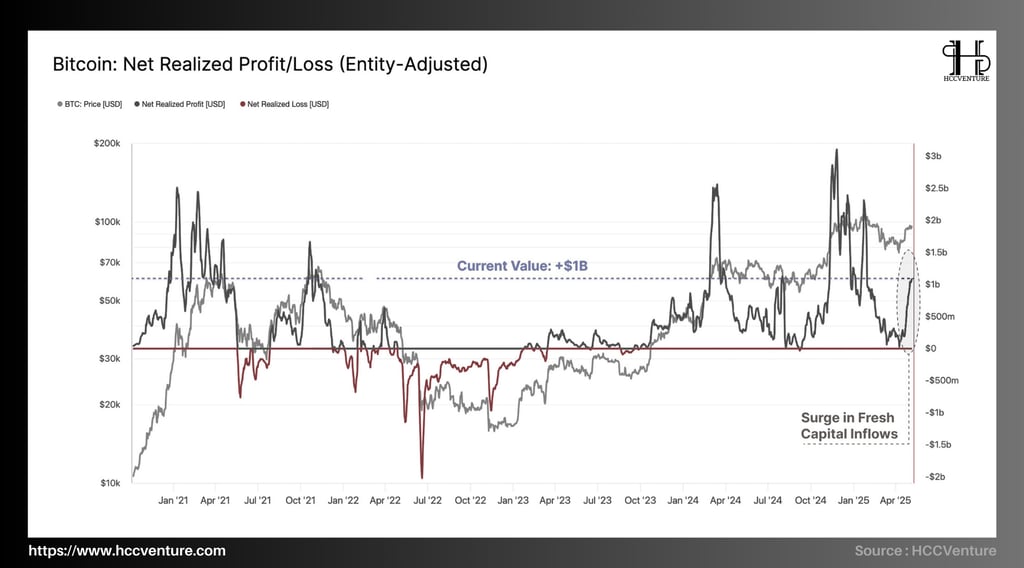
In recent weeks , the market has seen positive net inflows of over $1 billion per day , indicating:
Demand grows strongly, as buyers are ready to absorb the supply.
Profits were realized, but without a serious price drop — reflecting healthy market conditions.
The period from October 2023 to present maintains a positive structure with:
Capital inflows are consistently higher than capital outflows.
A clear sign of the return of long-term investment cash flow , especially in the context of ETFs reversing from capital withdrawal to strong capital attraction (>$4.6B in the last 2 weeks).
New demand is constantly absorbing supply. Profitable investors are strategically taking profits, without shocking the market.
Market sentiment is strengthening , as new buyers trust the current price range and are willing to pay a premium over cost.
Compared to previous cycles, the realized profits are large but not accompanied by a sharp decline, showing a sign of maturity and stability of market capital flows .
The continued inflow of capital, coupled with profits being realized on a large scale without disrupting the price structure , is extremely positive for the medium-term outlook .
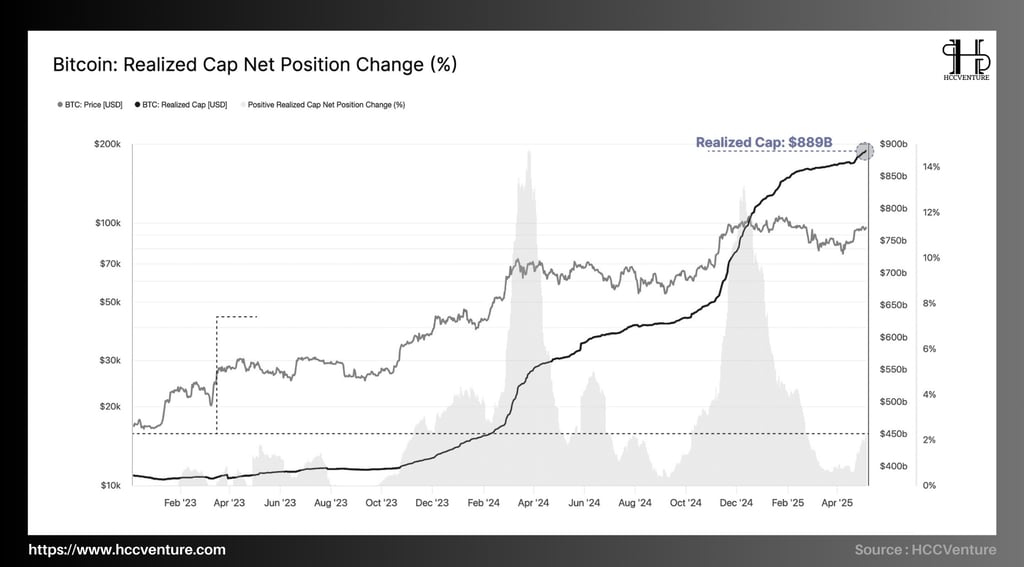
Over the past month , the Realized Cap index has increased by +2.1% , equivalent to a net increase of ~ $18B . The Realized Cap is now at an all-time high (ATH): $889B USD , reflecting:
Significant increase in new capital flowing into the network .
Investors are willing to buy and hold BTC at high prices, showing strong confidence in the medium-term growth trend .
BTC price peaked at $97.9k and then corrected slightly to the $94k area, before recovering back to the $97k area:
Shows slight profit-taking behavior but is quickly absorbed by new demand.
Liquidity is improved , cash flow into the market is more abundant.
The sharp increase in Realized Cap coincided with large flows from US ETFs (over $4.6B in the last 2 weeks) , indicating the return of institutional capital . Long-term investors tend to take profits selectively , but the market still maintains its bullish structure.
The expansion of Realized Cap in an uptrend is a healthy sign , showing the level of acceptance of new prices as a basis for investors' capital. The market is in a phase of active liquidity expansion , with the clear presence of new money flows.
The Realized Cap ATH level confirms that the market capital base has been re-established higher , strengthening the sustainability of the uptrend.
Evaluation and Conclusion
Bitcoin’s recent surge has put over +3 million BTC back into profit , significantly reducing the financial stress that has been building up among investors since the December 2024 all-time high.
Inflows of over $4.5 billion were recorded in the last two weeks , reversing the previous trend. This shows that institutional confidence has been restored thanks to positive price movements and a more stable macro environment.
The Realized Cap Index increased +2% over the past month , reaching a new record high of $889 billion USD . Showing the re-entry of new investors, willing to accept the current high price range as a capital level.
Implied Volatility (IV) in short-term options (1 week – 1 month) is currently at its lowest level since July 2024. This is typically a counter-cyclical signal , suggesting that the market is underpricing the possibility of strong volatility in the near future .
However, the current volatility undervaluation could set the stage for larger moves in the near term – both bullish and corrective. Therefore, investors should maintain a cautious strategy, use corrections to allocate strategic capital, and closely monitor for breakout signals or trend confirmations in the near term.
Join the HCCVenture community to get the latest market information. Once again, we give our opinion on potential projects in the crypto market. This is not investment advice, consider your portfolio. Disclaimer: The views expressed in this article are solely those of the author and do not represent the platform in any way. This article is not intended to guide investment decisions.
API & Data : Glassnode
Compiled and analyzed by HCCVenture
Join our telegram community: HCCVenture
Explore HCCVenture group
HCCVenture © 2023. All rights reserved.


Connect with us
Popular content
Contact to us
E-mail : sp_contact@hccventure.com
Register : https://linktr.ee/holdcoincventure
Disclaimer: The information on this website is for informational purposes only and should not be considered investment advice. We are not responsible for any risks or losses arising from investment decisions based on the content here.
TERMS AND CONDITIONS • CUSTOMER PROTECTION POLICY
ANALYTICAL AND NEWS CONTENT IS COMPILED AND PROVIDED BY EXPERTS IN THE FIELD OF DIGITAL FINANCE AND BLOCKCHAIN BELONGING TO HCCVENTURE ORGANIZATION, INCLUDING OWNERSHIP OF THE CONTENT.
RESPONSIBLE FOR MANAGING ALL CONTENT AND ANALYSIS: HCCVENTURE FOUNDER - TRUONG MINH HUY
Read warnings about scams and phishing emails — REPORT A PROBLEM WITH OUR SITE.