


On-chain analysis week 18/2025: Bitcoin returns to old bottom, recovery or decline?
Bitcoin price is now facing its first major wave of resistance after a strong rally since early 2024. After surpassing the psychological $70,000 mark and approaching the $94,000 region, buying pressure has slowed as the price approaches important technical and on-chain distribution range levels.
5/6/20257 min read
Market Summary
Bitcoin is now facing its first major technical resistance zone after its strong rally since the beginning of the year. Specifically, the price is trying to overcome the 111DMA (111-Day Moving Average) around $92,000.
The leverage ratio has dropped significantly , indicating that speculative capital has been purged. Long-Term Holders (LTHs) continue to hold firmly, with “HODLing” behavior dominating.
Despite the slight correction in prices, institutional money flows remain positive. Specifically, the most recent strong day saw $1.54B USD poured into Bitcoin ETFs , demonstrating long-term confidence from institutional investors.
Potential supply from long-term investors (LTHs) – this group is currently holding unrealized profits of over +350% , a number large enough to trigger large-scale profit-taking.
A large cluster of coins is “lying” above the current price – implying that many investors are “waiting to break even” to exit. As the price approaches this zone, selling pressure from the “break even” group may increase, creating short-term supply pressure.
The market is currently in a state of supply-demand balance , with a slight bias towards the positive side as accumulation behavior still prevails.
On-chain metrics analysis
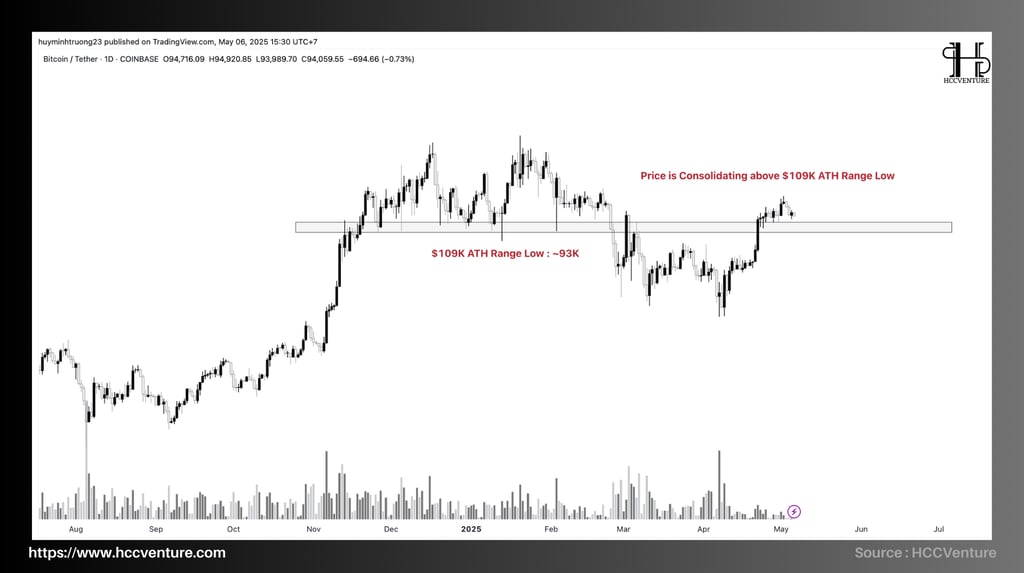
Bitcoin price is approaching the first technical resistance zone at $93,000–$95,000 — the bottom of the accumulation phase that lasted from November 2024 to February 2025.
The price breaking the previous downtrend and establishing a “higher highs” pattern indicates an important structural shift is taking place in market sentiment.
However, the current bullish momentum is still facing profit-taking pressure as well as psychological and technical resistances, especially considering the context of short-term investors approaching break-even points.
Although profit-taking pressure is increasing from short-term investors, if the market maintains the $93,000–$95,000 price range in the coming time, this could establish a new support zone and open up room for medium-term growth.
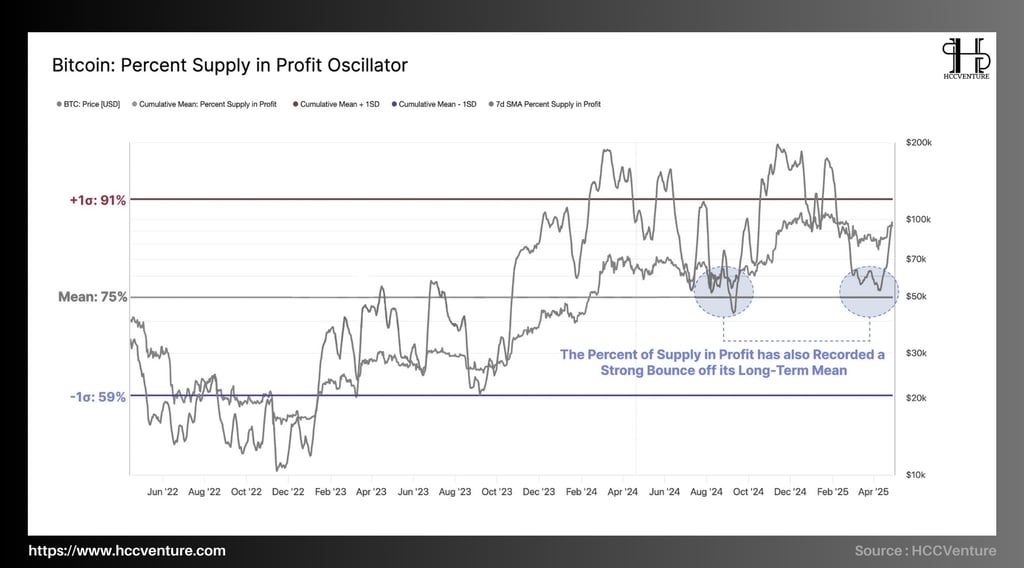
The Percent Supply in Profit index shows that the proportion of profitable supply is currently at 88% , significantly higher than the long-term average of 75% , and approaching the +1σ (91%) threshold .
This is the area where historical corrections often occur due to the market being "overvalued", increasing the momentum of mass profit taking, notably:
The 88% supply in profit ratio means that the majority of investors are in profit, except for a small group that bought in between December 2024 and February 2025 (the $95,000–$100,000 price range).
The index has bounced sharply from its long-term average (75%) , similar to past recovery cycles (highlighted in the figure by the two blue ellipses). This suggests that investor expectations have been “reset” after the recent correction — a positive factor supporting the current recovery.
Compared to the June 2023 and March 2024 periods, when the index also bounced from ~75% to ~90%, the market then experienced strong growth. If this pattern repeats, we can expect a new extended uptrend.
The strong recovery of Percent Supply in Profit from the historical average reflects that the majority of investors have exited their losing positions and are holding on in the expectation that prices will continue to rise.
In the long term, the market re-establishing a new cost level, eliminating weak positions from the recent decline, is a sign of a more sustainable price foundation.
If it stays above 75% for the next few weeks, this will strengthen the possibility of a medium- to long-term uptrend. However, profit-taking pressure around the $95,000–$100,000 zone is present, requiring a clearer breakout of money flow to overcome this barrier.
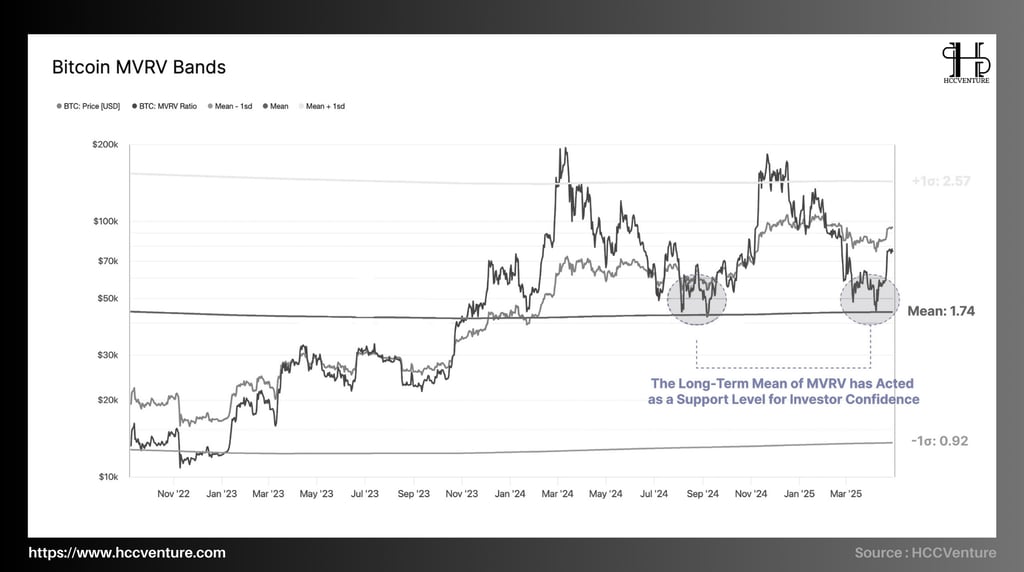
The long-term average of MVRV is 1.74 , which acts as a demarcation line between market phases: below this level is recovery – accumulation, above this level is a bull market.
MVRV in the most recent period has fallen to exactly the long-term average level , then bounced back strongly — reflecting a healthy "reset" of investor expectations.
The chart shows the trend:
The +1σ (2.57) level is considered the peak of the euphoric state. In the mid-2024 period, when MVRV crossed this level, the market reached its peak and then corrected strongly.
The -1σ (0.92) threshold represents a deep bear market, which is still far from this zone, indicating that the level of systemic risk is not high.
It is noteworthy that in both recent times (September 2024 and March 2025), the MVRV index bounced right at the long-term average line, reinforcing its strong support role in terms of psychology and valuation.
The market is in a re-accumulation and recovery phase , after most short-term expectations were corrected through a natural reset. This reflects weak capital flows and speculation leaving the market, creating a healthier foundation for a sustainable growth.
The fact that MVRV remains above its long-term average (1.74) shows that investor confidence remains strong, and the potential for further upside is there, especially if MVRV continues to rise above 2.0.
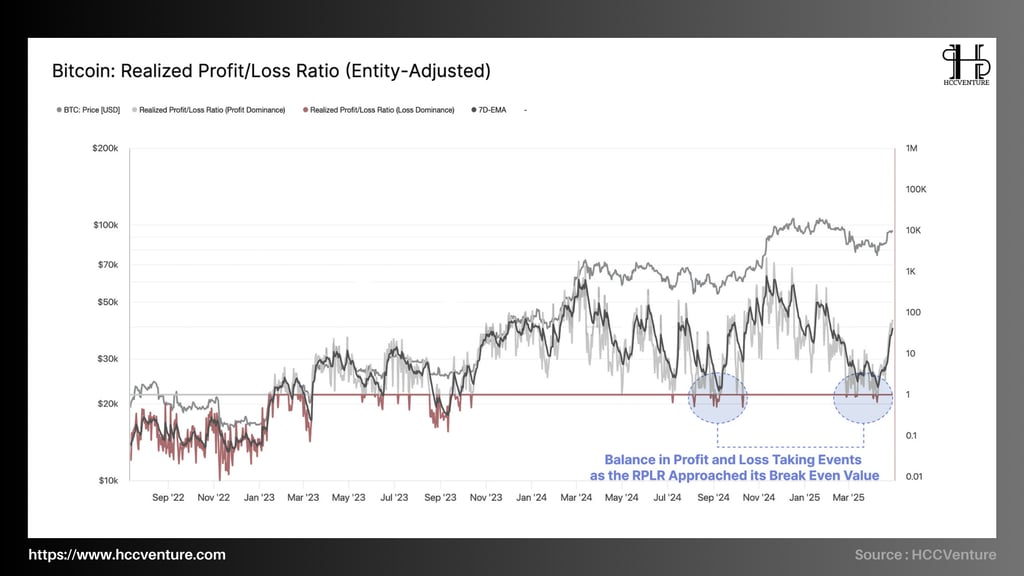
During the strong correction period from mid-2024 to early 2025, RPLR repeatedly touched level 1 , representing neutrality and a natural reset in investor behavior. This is a period of balance between profit-taking and loss-cutting selling pressure , which is typical of accumulation zones.
At two major bottoms in September 2024 and March 2025 (marked by blue circles), the RPLR index approached level 1 and then bounced back — indicating the end of the “reset” phase and the beginning of a recovery cycle.
At the moment, RPLR is bouncing back to the > 1 zone , indicating that profitable trades are increasing – this can only happen when:
Investors believe that prices will continue to increase, so they gradually start taking profits.
The market has enough demand to absorb the selling pressure → recovery confidence is maintained.
RPLR approaching and bouncing from zone 1 is a positive signal , showing that investor sentiment is shifting from pessimism to well-founded optimism.
The balance in the previous period helped eliminate "weak hands" and at the same time created opportunities for strong cash flow to accumulate, laying the foundation for a durable recovery.
If RPLR stays above 1 for a long period of time, this is a clear sign of a market in a stable growth phase, but be wary when RPLR increases too strongly (>1.5 in a short period of time) — it could be an extreme “take-profit” phase.
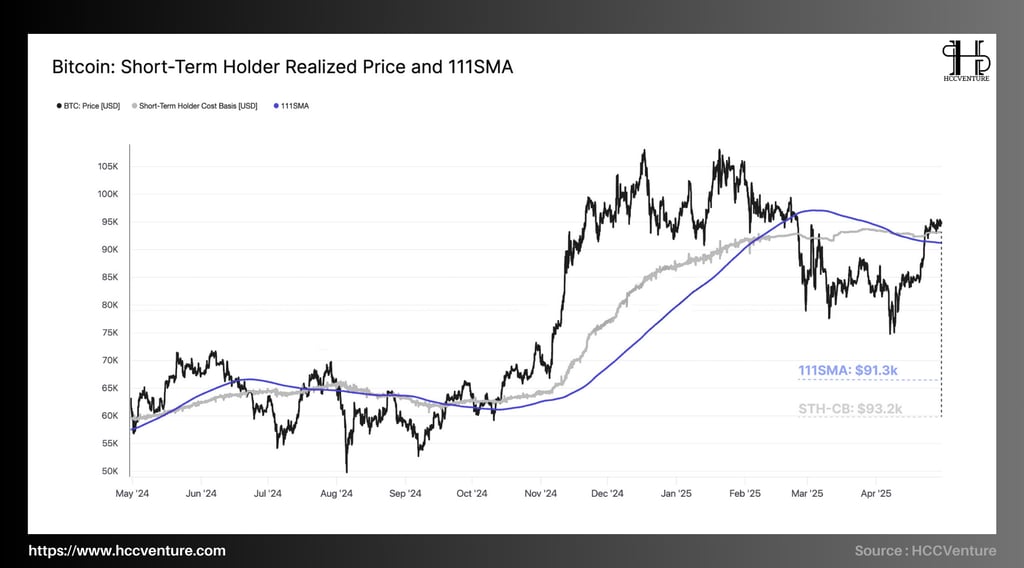
Currently, Bitcoin price has broken above both the 111DMA ($91.3k) and the Short-Term Investor Cost Basis ($93.2k) . This shows a strong increase in market momentum.
Current 111DMA price : 91.3k USD .
Short-term Investor Cost Basis : $93.2k .
However, this is not a solid signal for continued growth, but also depends on the ability to maintain prices above these levels.
If Bitcoin can stay above the 111DMA and the Cost Basis of Short-Term Investors , the market will be able to continue the uptrend. However, if the price is rejected and falls below these levels, it could lead to a resumption of the downtrend and many investors will suffer unrealized losses.
From the above analysis, we can see that the current market is somewhat positive. Bitcoin price breaking through important levels such as 111DMA and Short-term Investor Cost Basis shows a fairly strong level of momentum.
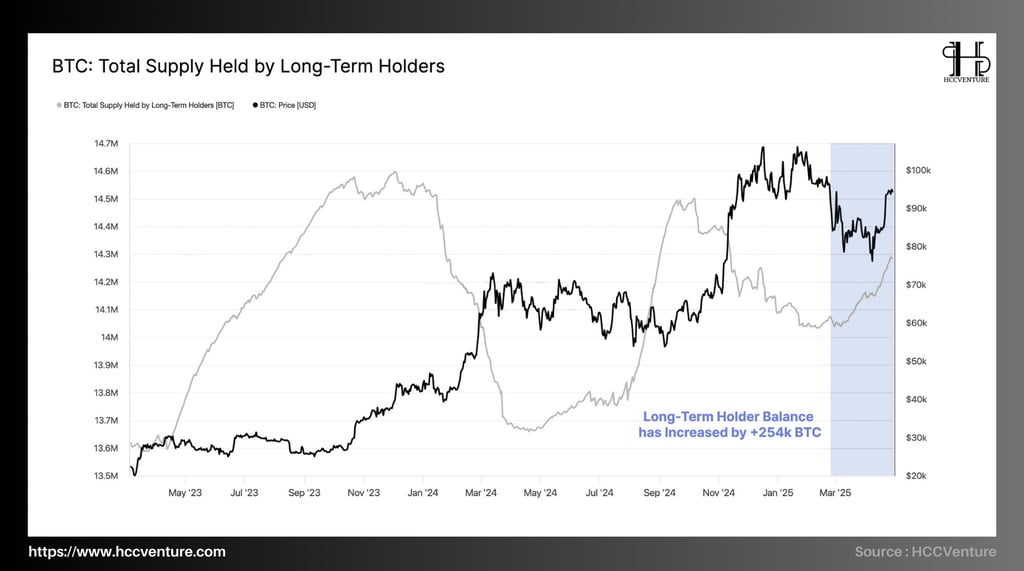
Amid the improving market, the behavior of Long-Term Holders has shown a marked increase in asset holding, also known as "HODLing".
The behavior of this group is often decisive in determining the long-term trend of the market.
Spending Volume of Long-Term Holders : Despite the improvement in market conditions, the spending volume of long-term investors remains relatively low. This suggests that HODLing is the main behavior of this group in the current period.
Accumulation Continues : The amount of Bitcoin owned by long-term investors continues to grow, with over 254,000 BTC moving past the 155-day mark since the recent low. Importantly, the majority of this was accumulated at prices above $95,000 .
The increase in the volume of Bitcoin held by long-term investors shows that the accumulation pressure is much stronger than the selling trend. This implies that this group no longer intends to sell at current prices, because they expect the potential for future price increases.
With the spending volume of long-term investors low and the accumulation pressure increasing, the market is showing positive signs for a strong growth trend.
Evaluation and Conclusion
After a strong rally over the past two weeks, Bitcoin’s price momentum is now facing a wave of important resistance. Notably, the price has broken through three important levels: the short-term investor cost basis , the 111-day moving average (111DMA) , and the low of $109K from the historical high. These are key price levels that act as important inflection points in the market trend.
This is a crucial moment for the Bitcoin market. The fact that Bitcoin has broken through these levels is a positive signal for a short-term bullish trend. However, to ensure stability and continued growth, the price needs to hold above these levels. Otherwise, the price may return to the accumulation zone, and many investors will face unrealized losses, putting great pressure on market sentiment.
Despite this, a major structural shift has taken place in the Bitcoin economy, indicating that much of the speculative excess has been eliminated. However, investor behavior remains relatively mild, with no aggressive profit-taking or stop-loss trading. Furthermore, the Long-Term Holders group has largely remained silent, remaining out of the market during this period.
This creates a rather sensitive market environment, susceptible to strong volatility or shocks that can come from any direction. Therefore, investors need to be cautious and continue to monitor the market's movements, especially when important levels are the next decisive factor for Bitcoin's trend.
In short, if Bitcoin can stay above these levels, the market could continue its uptrend. Otherwise, the market could return to an accumulation or bearish phase, making it difficult for current investors.
Join the HCCVenture community to get the latest market information. Once again, we give our opinion on potential projects in the crypto market. This is not investment advice, consider your portfolio. Disclaimer: The views expressed in this article are solely those of the author and do not represent the platform in any way. This article is not intended to guide investment decisions.
API & Data : Glassnode
Compiled and analyzed by HCCVenture
Join our telegram community: HCCVenture
Explore HCCVenture group
HCCVenture © 2023. All rights reserved.


Connect with us
Popular content
Contact to us
E-mail : sp_contact@hccventure.com
Register : https://linktr.ee/holdcoincventure
Disclaimer: The information on this website is for informational purposes only and should not be considered investment advice. We are not responsible for any risks or losses arising from investment decisions based on the content here.
TERMS AND CONDITIONS • CUSTOMER PROTECTION POLICY
ANALYTICAL AND NEWS CONTENT IS COMPILED AND PROVIDED BY EXPERTS IN THE FIELD OF DIGITAL FINANCE AND BLOCKCHAIN BELONGING TO HCCVENTURE ORGANIZATION, INCLUDING OWNERSHIP OF THE CONTENT.
RESPONSIBLE FOR MANAGING ALL CONTENT AND ANALYSIS: HCCVENTURE FOUNDER - TRUONG MINH HUY
Read warnings about scams and phishing emails — REPORT A PROBLEM WITH OUR SITE.