

On-chain analysis week 17/2026: Long-term Holders have not yet acted
Short-Term Holder Realized Profit has spiked to a high of $4.4 million/hour, reflecting increased profit-taking activity in strength but still effectively absorbed by the market without causing a cascade distribution.
PHÂN TÍCH
5/4/202613 min read
On-chain analysis week 17/2026: Long-term Holders have not yet acted
Short-Term Holder Realized Profit spiked to a high of $4.4 million/hour, reflecting increased profit-taking activity that was nevertheless effectively absorbed by the market without causing a distribution cascade, confirming that profit-taking is proceeding in an orderly manner.
Analysis • 4 May, 2026


Market Summary
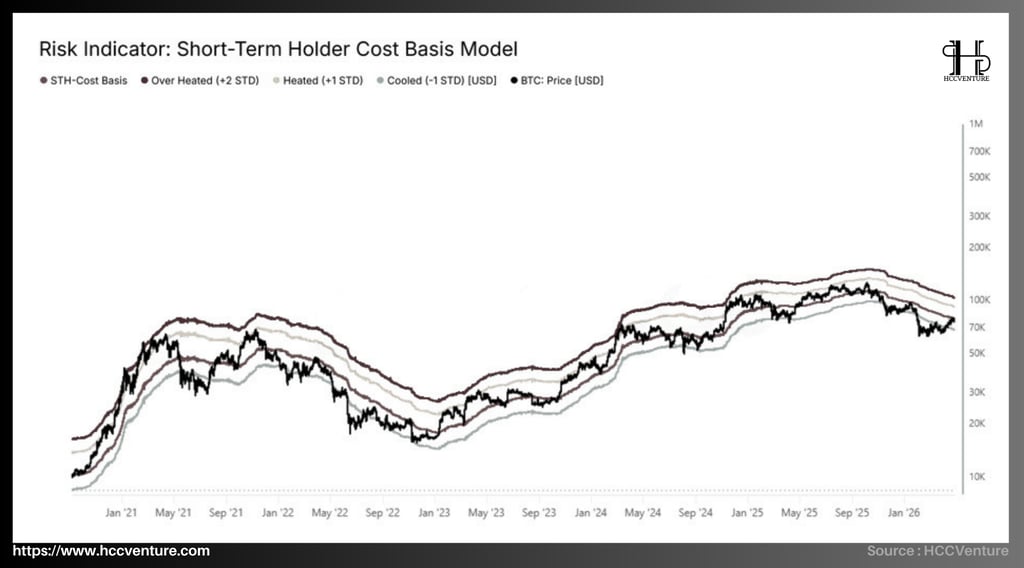
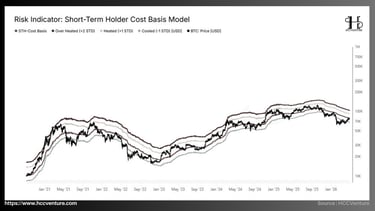
Bitcoin is currently reflecting a fragile equilibrium, where the price is being held back below the crucial True Market Mean (~$78K–$79K) , while lacking sufficient momentum to break through the medium-term resistance structure. The repeated rejection at this price level has a clear quantitative meaning: the market has not yet been able to fully absorb the supply above, especially from short-term investors whose capital costs are concentrated around the $80K–$81K range .
The Short-Term Holder Realized Profit indicator recorded a surge to approximately $4.0–4.4 billion per hour , nearly three times higher than the historical warning threshold (~$1.5 billion/hour) which has repeatedly coincided with local peaks throughout the year. Compared to the cyclical bottom phases, where realized profits remained low and money flow was primarily accumulating, the current state is typical of a distribution within a range , i.e., distribution within a sideways trading range.
Spot selling pressure has decreased significantly, as evidenced by the Cumulative Volume Delta gradually returning to a neutral state, indicating that active selling pressure is no longer absolutely dominant. However, new buying remains limited and selective, insufficient to create the necessary liquidity expansion for a sustainable uptrend.
Trapped Below Market Mean, but with an unprecedentedly healthy on-chain and off-chain foundation. Supply cleared on URPD, deep derivative supply drain, record fund holdings, tightly controlled unrealized losses, record-breaking stablecoin liquidity expansion, and strong long-term HODLing holders have created an environment where downside risk is minimized while potential upside remains significant.
Bitcoin is demonstrating the structural strength of a more mature cycle, where being stuck below the True Market Mean is not a sign of weakness but rather a selective accumulation phase with solid liquidity and HODLing. With spot demand stabilizing, ETF inflows returning, a potential record short bias squeeze, and profit-taking tightly controlled, the market is poised for the next rally when the catalyst emerges.
Analyzing on-chain metrics
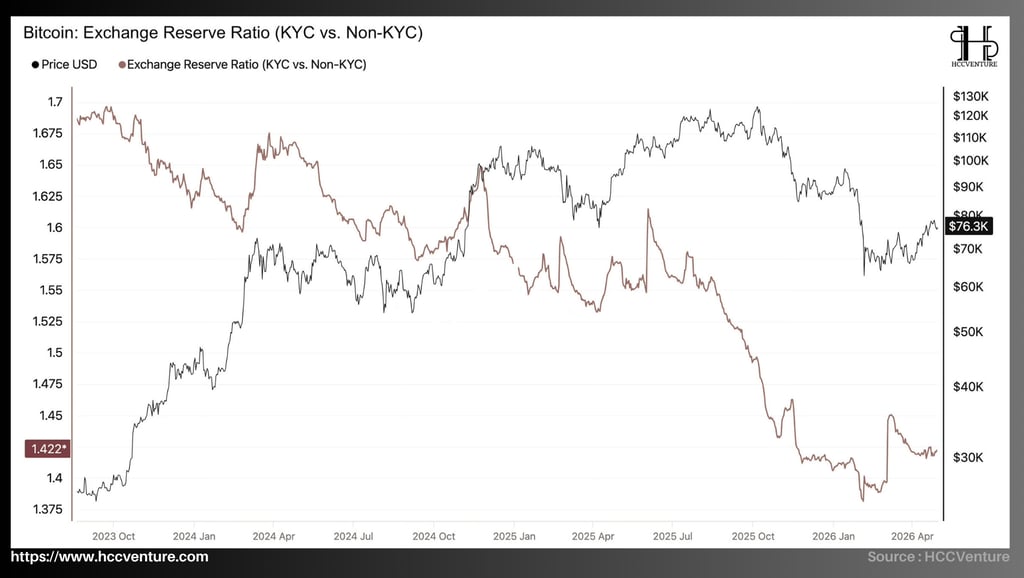
Bitcoin is currently stabilizing around $76,300 after reclaiming its True Market Mean and approaching Short-Term Holder Cost Basis. In this context, the Exchange Reserve Ratio (KYC vs. Non-KYC) – the ratio of Bitcoin reserves on exchanges between KYC and Non-KYC accounts – is at a record low of 1.422 , providing the most important on-chain lens regarding HODLing behavior and the shift of supply off exchanges.
The current rate maintains a deep and stable downward trend at historical lows, confirming that Bitcoin supply is continuously leaving exchanges, especially KYC-verified accounts, creating the strongest foundation for spot demand and a sustainable recovery. From late 2023 to mid-2025, the Exchange Reserve Ratio maintained a high level of 1.65–1.7, coinciding with a period of high market volatility and significant selling pressure from exchanges. By the end of 2025 and early 2026, the index has fallen sharply and stabilized at 1.422* – significantly lower than its historical peaks.
Compared to its historical high of around 1.7, the current level has fallen by more than 16%, confirming that supply on the exchange is shrinking to its maximum. Compared to previous temporary lows (around 1.5–1.55 during periods of stability), the 1.422* level is a record low, demonstrating strong HODLing activity, with supply increasingly shifting to cold wallets and Non-KYC, reducing widespread selling pressure on the market.
The sustained decline of the Exchange Reserve Ratio (KYC vs. Non-KYC) to approximately 1.42 confirms a fundamental liquidity restructuring process in the Bitcoin market. Supply is leaving centralized exchanges – particularly KYC platforms – on a scale large enough to alter the supply-demand balance in the medium term. This creates a market environment where structural selling pressure is significantly weakened , while also forming the necessary conditions for a sustainable uptrend in the future. However, in its current state, with demand not yet strong enough to fully absorb the remaining supply, the market remains sideways with a tendency towards accumulation.
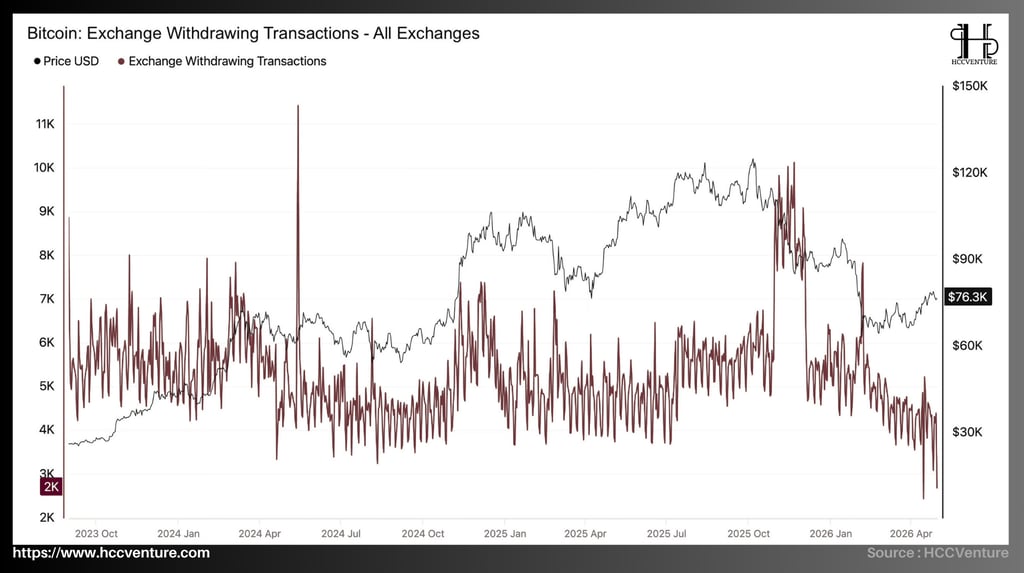
Exchange Withdrawing Transactions - All Exchanges – The number of Bitcoin withdrawals from all exchanges is at a record low, providing the most important on-chain lens in HODLing behavior and the shift of supply away from exchanges. The current withdrawal volume is only around 2,000–3,000 transactions per day, confirming that BTC withdrawals from exchanges have sharply decreased to a record low, supply is being held tighter than ever, and creating the strongest foundation for spot demand and a sustainable recovery.
In late 2023 – early 2024, the number of withdrawal transactions remained stable around 5,000–6,500 transactions/day , with occasional spikes exceeding 10,000 transactions , reflecting strong asset withdrawal activity as the market entered its growth phase. By mid-2025, when the price of Bitcoin reached the $90,000–$120,000 range , this indicator continued to maintain high levels and high volatility, often exceeding 8,000–9,000 transactions/day . This was a period where capital tended to be withdrawn from exchanges for custody, reflecting asset transfers after profit-taking or reallocation.
However, since the end of 2025 to the present, the index has declined significantly, currently fluctuating around ~4,000 transactions/day , approaching its lowest point in 12 months. This current level is approximately 50–60% lower than the most recent peak , indicating a marked decrease in the intensity of asset withdrawals from the exchange. The decline in Exchange Withdrawing Transactions reflects a significant shift in investor behavior. During strong bull market phases, increased withdrawal transactions are typically linked to two main drivers: long-term accumulation (self-custody) and capital reallocation after profit-taking. Conversely, when this index declines, it implies that both of these drivers are weakening .
A notable point is that historically, the peaks of the withdrawal index often coincide with high price levels or periods of high volatility. Specifically, the most recent peak of the index (~10,000 transactions/day) occurred when BTC was trading around the $110K–$120K range , reflecting large-scale asset shifts off exchanges amidst market euphoria. Conversely, the current level (~4,200) occurred when the price only recovered to $70K–$78K , indicating that this recovery was not accompanied by a corresponding liquidity outflow . This confirms that the current price surge is more technical in nature than supported by strong on-chain accumulation. The direct consequence is that available liquidity on exchanges has not significantly decreased , thereby reducing the likelihood of sharp price squeezes due to supply shortages.
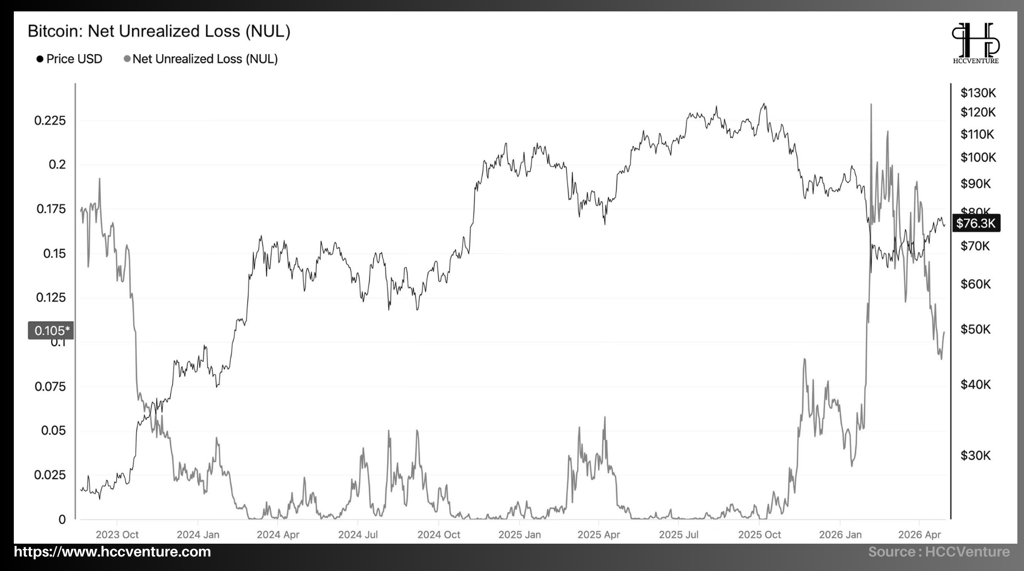
Net Unrealized Loss (NUL) – the total unrealized loss on the entire Bitcoin supply – is at a record low of 0.105*, providing the most important on-chain lens through which the market is experiencing stress. The current NUL level maintains a deep and stable downward trend at the lowest point of the cycle, confirming that unrealized losses in the market are tightly controlled, showing no signs of capitulation, and directly supporting spot demand and a sustained recovery.
Historically, Net Unrealized Loss (NUL) has reached record highs above 0.2–0.225 during periods of intense stress around mid-2025, coinciding with deep drawdowns when a large portion of supply fell into loss zones. Conversely, lows below 0.05 typically appear just before or during sustained rallies, when the market has completed de-risking and supply is tightly held.
Notably, during the sharp correction in late 2025 – early 2026, NUL surged to around 0.22 , the highest level in the entire current cycle. This is a sign of a typical liquidity shock, where a large number of investors – especially those who bought near the peak – suffered losses. Currently, the index has fallen to around 0.105 , equivalent to a drop of more than 50% from its most recent peak , reflecting a systematic "uncompression" of the losing pressure.
NUL is one of the most direct indicators reflecting market sentiment, particularly the level of financial stress among investors. When this indicator is high, the market is often under significant underlying selling pressure as investors seek to cut losses or mitigate risk. The current level (~0.10) shows that a significant portion of investors are still experiencing losses, but this is no longer as systemic as during the peak period in early 2026.
The current Net Unrealized Loss (NUL) indicator at ~0.105 confirms that the Bitcoin market has experienced a significant relief phase from losses following the previous sharp correction. The more than 50% drop from the most recent peak (~0.22) is clear evidence that the weak supply absorption process has been effective.
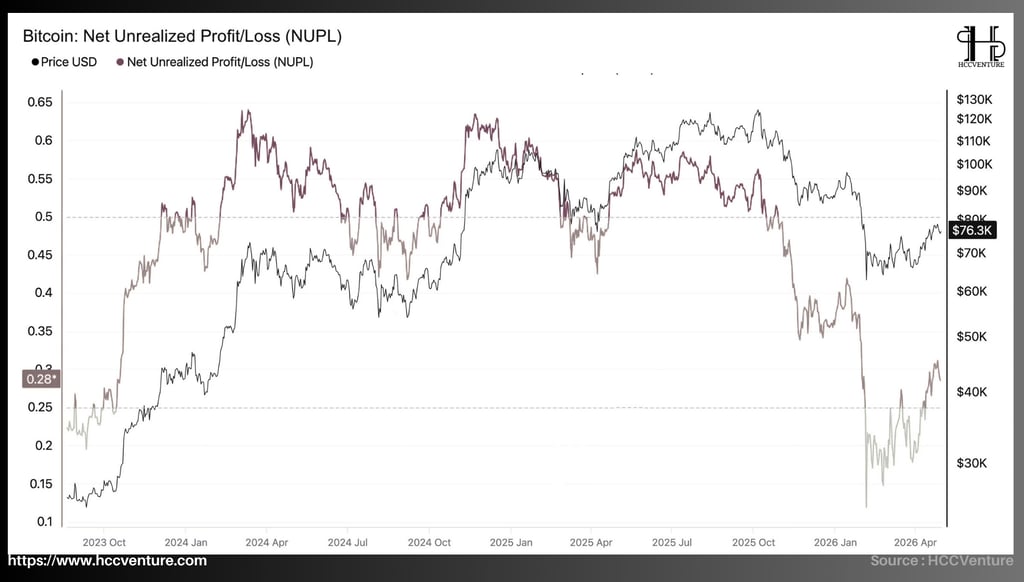
Net Unrealized Profit/Loss (NUPL) is currently trading around ~0.28 , a significant recovery from the recent bottom of ~0.18–0.20 during the early 2026 correction, but still significantly lower than previous cyclical peaks of ~0.60–0.65 . The current level reflects an intermediate state: the market has moved out of a loss-dominated valuation zone, but has not yet reached a euphoric state where unrealized profits are widespread throughout the system.
During the period from late 2023 to Q1/2024, the NUPL surged from approximately 0.25 to 0.60 , corresponding to the profit-taking phase as Bitcoin rose from the $30,000–$40,000 range to $70,000–$80,000 . This represents a shift from "Belief/Denial" to "Optimism," where a significant portion of the supply returned to a profitable state. Subsequently, during the sharp correction in late 2025–early 2026, the index plummeted to approximately 0.18–0.20 , equivalent to its lowest level in over 18 months, indicating that a substantial portion of the market returned to a break-even or loss-making state.
Currently at around 0.28 , NUPL has recovered approximately 40–50% from its most recent low , but remains significantly below its cyclical peak (~0.60), confirming the market is in a recovery phase but has not yet entered a profit-taking phase. The current level of ~0.28 sits just above the crucial transition threshold of 0.25 , confirming that the market has moved out of the fear zone , but has not yet entered the optimism zone. Compared to its most recent low (~0.18), the current level is approximately 55% higher , indicating a significant psychological recovery. However, compared to the peak (~0.60), the market is still lacking about 50% of its profit-taking potential , reflecting a lack of upward momentum.
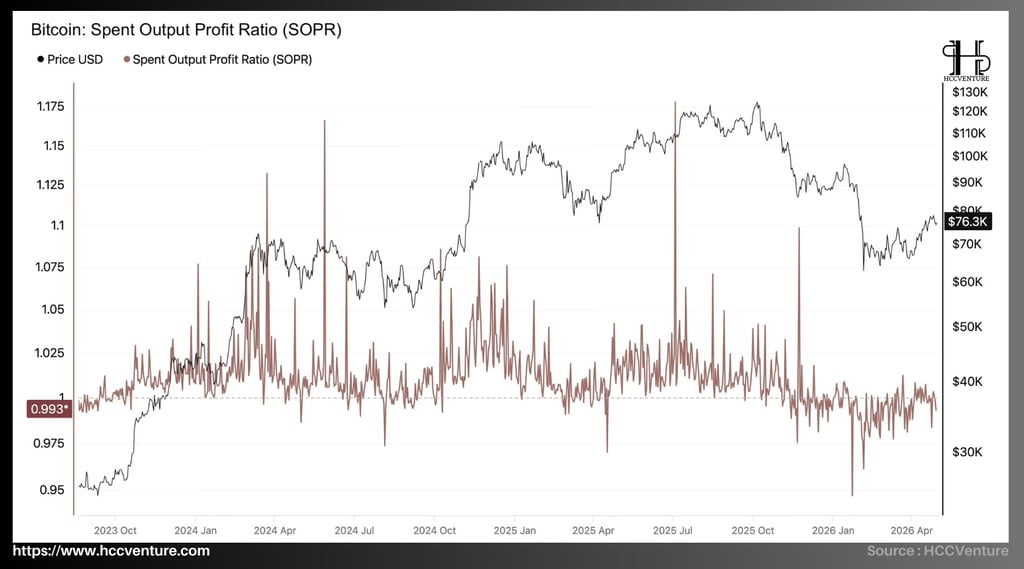
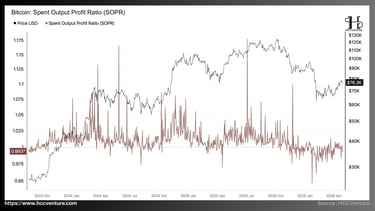
The Spent Output Profit Ratio (SOPR) is currently fluctuating around ~0.99–1.00 , with the most recent recorded level at ~0.993 , reflecting a balance between profits and losses in on-chain transactions. Compared to previous periods when SOPR frequently remained above 1.05–1.10 during strong growth phases, the current level suggests the market has shifted to a neutral state, where profit-taking activity has significantly decreased and selling pressure is no longer widespread.
When SOPR > 1: the market is realizing profits, and the uptrend is strengthened.
When SOPR < 1: the market is under selling pressure, which usually occurs during a correction phase.
When SOPR fluctuates around 1: the market is in equilibrium.
Historically, the SOPR has peaked above 1.15–1.175 during periods of strong euphoria around 2025, coinciding with peak prices when profit-taking exploded. Conversely, lows below 0.95 often appear in deep bear markets when realized losses prevail. Currently, the SOPR at 0.993* is not only significantly lower than its historical peaks but is also stabilizing near 1.0 – considerably higher than the temporary lows below 0.95 during previous stress periods. Compared to its historical high of around 1.175, the current level is down more than 15%, confirming that realized profit/loss is tightly controlled and the market is no longer in an overheated or capitulated state.
SOPR is a direct indicator of investor on-chain spending behavior, reflecting whether coins being sold are generating profits or losses. With the current level near 1.00 , the market is largely trading around break-even , suggesting investors tend to exit positions at the purchase price rather than waiting for higher profits. Profit-taking momentum has weakened significantly , a stark contrast to periods when SOPR remained above 1.05+, where profits were consistently realized. Market sentiment is defensive , prioritizing capital preservation over risk expansion.
The Spent Output Profit Ratio (SOPR) is currently fluctuating around ~0.99–1.00 , with the most recent recorded level at ~0.993 , reflecting a balance between profits and losses in on-chain transactions. Compared to previous periods when SOPR frequently remained above 1.05–1.10 during strong growth phases, the current level suggests the market has shifted to a neutral state, where profit-taking activity has significantly decreased and selling pressure is no longer widespread.
When SOPR > 1: the market is realizing profits, and the uptrend is strengthened.
When SOPR < 1: the market is under selling pressure, which usually occurs during a correction phase.
When SOPR fluctuates around 1: the market is in equilibrium.
Historically, the SOPR has peaked above 1.15–1.175 during periods of strong euphoria around 2025, coinciding with peak prices when profit-taking exploded. Conversely, lows below 0.95 often appear in deep bear markets when realized losses prevail. Currently, the SOPR at 0.993* is not only significantly lower than its historical peaks but is also stabilizing near 1.0 – considerably higher than the temporary lows below 0.95 during previous stress periods. Compared to its historical high of around 1.175, the current level is down more than 15%, confirming that realized profit/loss is tightly controlled and the market is no longer in an overheated or capitulated state.
SOPR is a direct indicator of investor on-chain spending behavior, reflecting whether coins being sold are generating profits or losses. With the current level near 1.00 , the market is largely trading around break-even , suggesting investors tend to exit positions at the purchase price rather than waiting for higher profits. Profit-taking momentum has weakened significantly , a stark contrast to periods when SOPR remained above 1.05+, where profits were consistently realized. Market sentiment is defensive , prioritizing capital preservation over risk expansion.
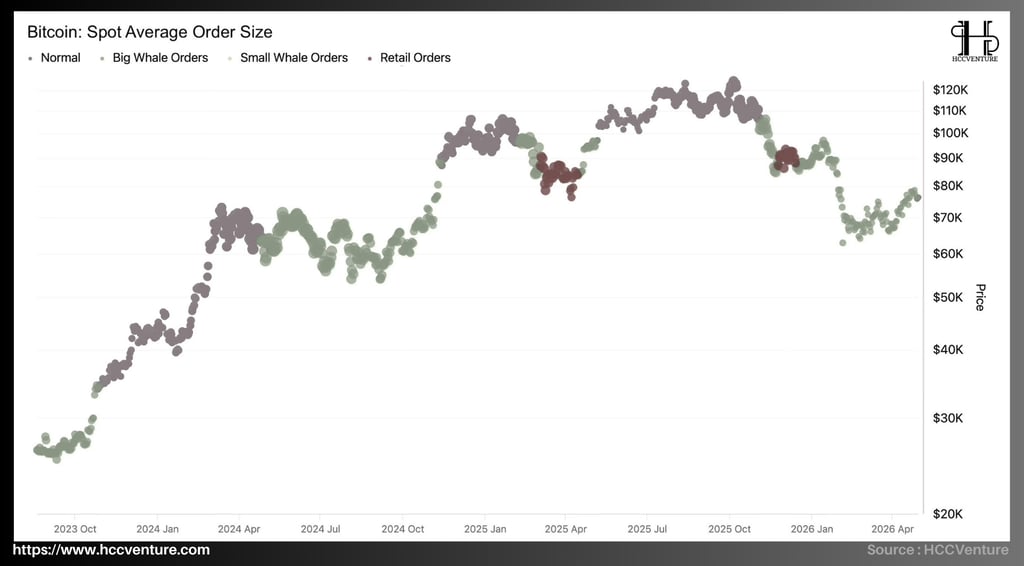
Spot Average Order Size provides a direct view of the money flow structure by order size, thereby separating the behavior of investor groups including retail, small whale, and big whale. Data updated to date shows Bitcoin price fluctuating around $76,000 , while the order structure in the spot market is clearly shifting towards a dominance of large-scale (whale) money flows , and retail participation has weakened significantly compared to previous peak phases of the cycle.
Spot Average Order Size provides a direct view of the money flow structure by order size, thereby separating the behavior of investor groups including retail, small whale, and big whale. Data updated to date shows Bitcoin price fluctuating around $76,000 , while the order structure in the spot market is clearly shifting towards a dominance of large-scale (whale) money flows , and retail participation has weakened significantly compared to previous peak phases of the cycle.
However, as we entered 2025, and especially after establishing a peak near $110,000–$115,000 USD , this structure changed significantly due to a marked decrease in the frequency and density of retail orders , the emergence of more large-scale orders (big whale orders) at higher price levels, and a shift in market dominance to institutional and large-capital investors. This reflects the transition from the "markup phase" to the "distribution phase" in market cycle theory.
Compared to the bottom of the 2022–2023 cycle, when prices were around $16,000–$20,000 , the current structure is distinctly different: instead of the quiet accumulation of smart money, the market is now in a redistribution state with a clear presence of large capital flows at high price levels .
Our assessment and conclusions
Bitcoin is currently operating in a state of being "anchored" below key cost thresholds, with the True Market Mean (~78K–79K USD) and Short-Term Holder Cost Basis (~80K USD) continuing to act as structural resistance ceilings. The repeated failure of the price to reach these areas confirms that supply from short-term investors has yet to be absorbed, thus maintaining distribution pressure during rallies.
The derivatives market structure is clearly skewed towards defensiveness, with funding rates remaining negative for an extended period and net short positioning reaching record highs in the current cycle . This reflects a prevailing risk-averse sentiment and indicates a lack of confidence in the potential for an extended uptrend. However, this very imbalance creates a unique technical environment where the market is compressed by large short positions amidst thin liquidity; any improvement in spot demand could trigger forced upward movements (short covering), leading to rapid and sharp price shifts.
STH Realized Profit remains high (~$4.4 million/hour), SOPR fluctuates around 1, and NUPL remains in the neutral zone (~0.45–0.5), indicating that unrealized profits are still being realized steadily, and market behavior is still leaning towards distribution rather than accumulation. Simultaneously, the Spot Average Order Size structure confirms that current cash flow is dominated by large-cap stocks, while retail participation, while necessary to sustain the expansion phase, has not yet returned significantly.
From an overall perspective, the market is in a state of unstable equilibrium: on the one hand, it is supported by the accumulation zone below and signs of stabilizing capital flows, while on the other hand, it is constrained by supply pressure at cost levels and a lack of sustainable demand. Under these conditions, the price structure does not show an extension of the trend, but reflects a prolonged rebalancing process within a narrow range.
Bitcoin is currently operating in a controlled sideways state, limited by cost resistance above and accumulation support below, while trend momentum depends entirely on the ability of sufficiently large real money flows to absorb supply and re-establish the growth structure.
Disclaimer: The information presented in this article is the author's personal opinion in the field of cryptocurrency. This is not financial or investment advice. All investment decisions should be based on careful consideration of your personal portfolio and risk tolerance. The views expressed in this article do not represent the official stance of the platform. We recommend that readers conduct their own research and consult with experts before making any investment decisions.
API & Data : Glassnode
Compiled and analyzed by HCCVenture
Join the HCCVenture organization here: https://link3.to/holdcoincventure
Research and Analysis
Market Summary
Analyzing on-chain metrics
Bitcoin : Exchange Reserve Ratio (KYC vs Non.KYC)
Exchange withdrawing transactions - All Exchange
Bitcoin : Net Unrealized Loss (NUL)
Net Unrealized Profit/Loss (NUPL)
Bitcoin Spent Output profit ratio (SOPR)
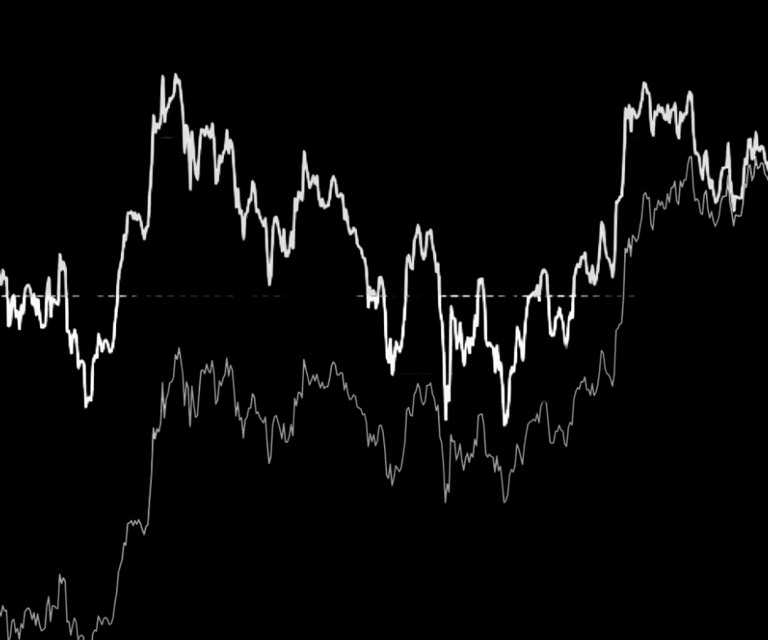
Short-term holder basis model
Spot average order size
Assessment and Conclusion
Explore HCCVenture group
HCCVENTURE QUANT JSCO
© 2026 HCCVENTURE. ALL COPYRIGHTS RESERVED.


Connect with us
Popular content
Contact to us
Address: 8th Floor, Bach Dang Complex Building, 50 Bach Dang Street, Hai Chau Ward, Da Nang City, Vietnam.
Phone: 1900 1509
Gmail : sp_contact@hccventure.com
Disclaimer: The information on this website is for informational purposes only and should not be considered investment advice. We are not responsible for any risks or losses arising from investment decisions based on the content here.
TERMS AND CONDITIONS • CUSTOMER PROTECTION POLICY
ANALYTICAL AND NEWS CONTENT IS COMPILED AND PROVIDED BY EXPERTS IN THE FIELD OF DIGITAL FINANCE AND BLOCKCHAIN BELONGING TO HCCVENTURE ORGANIZATION, INCLUDING OWNERSHIP OF THE CONTENT.
RESPONSIBLE FOR MANAGING ALL CONTENT AND ANALYSIS: HCCVENTURE FOUNDER - TRUONG MINH HUY
Read warnings about scams and phishing emails — REPORT A PROBLEM WITH OUR SITE.