


On-chain analysis week 17/2025: Crucial moment, signals gradually become clearer
After a short correction, Bitcoin has rebounded to the $94.7K area, close to its previous high. The recovery was driven by optimism about possible tariff relief from the US. Bitcoin spot ETFs recorded their largest inflow in weeks – $1.54B. This is an extremely positive sign, showing acceptance and participation from institutional investors, pushing the price out of the accumulation zone.
4/29/20257 min read
Situation Summary
Bitcoin has surged to $94,700 , fueled by optimism regarding the potential easing of tariffs between the US and China . The price action has moved above the key Short-Term Traders’ Average Cost Basis (STH) at $92,900.
The percentage of supply in profit increased from 82.7% to 87.3% as BTC returned to the $94K price zone, reflecting that 5% of the BTC supply changed hands during the most recent correction.
A Short Term Investor Profit/Loss Ratio (STH P/L Ratio) of 1.0 generally means that many investors are currently at break-even .
Despite the price increase, the funding rate turns negative → a signal that the majority of the market is leaning towards short positions , reflecting short-term skepticism or hedging strategies.
Strong ETF flows can act as a long-term support, underpinning a more sustainable growth cycle – especially when these flows are more strategic than speculative.
On-chain metrics analysis
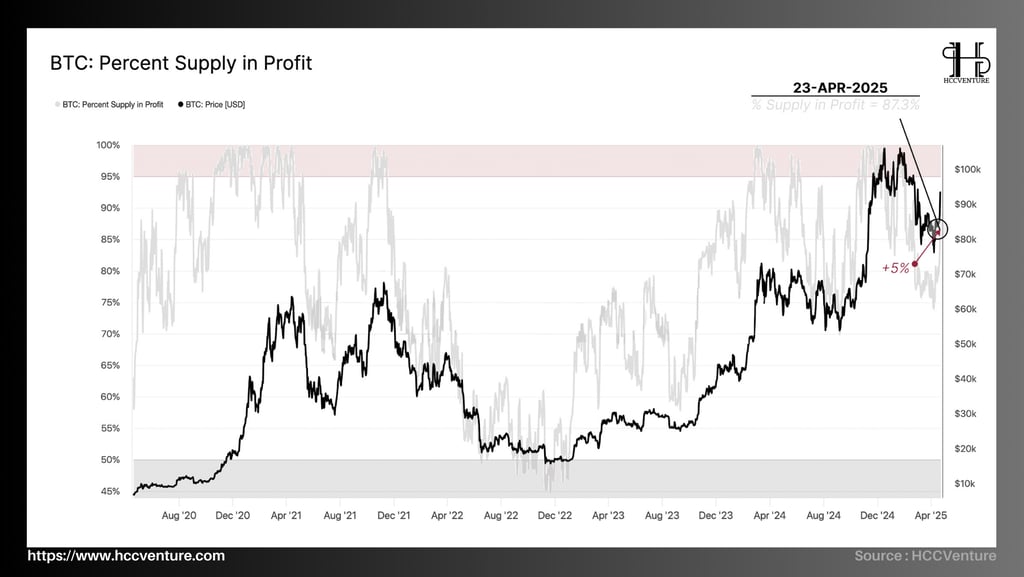
During the most recent strong recovery, when Bitcoin price rose to $94,300 , the market recorded a clear improvement in the Percent Supply in Profit. Specifically:
The ratio has jumped to 87.3% , a significant bounce from the bottom recorded in March 2025.
The last time Bitcoin traded around $94,000 , the percentage of supply in profit was just 82.7% .
This suggests that nearly 5% of circulating supply was transferred during the correction period – demonstrating strong cumulative buying activity at the recent lows .
Most investors are making nominal profits , which contributes to positive market sentiment .
Investors who bought at the March lows have returned to profit , supporting a more stable market structure.
History shows that the euphoria phase usually occurs when Percent Supply in Profit remains stable above 90% for a long period of time . Reflecting the wide spread of profits and high confidence in the community -> leading to the possibility of entering the parabolic growth phase.
If the market maintains its bullish momentum and Percent Supply in Profit crosses the 90% mark , this could be the start of a new acceleration phase with the expectation that the market will enter a state of FOMO and money flows will spread widely.
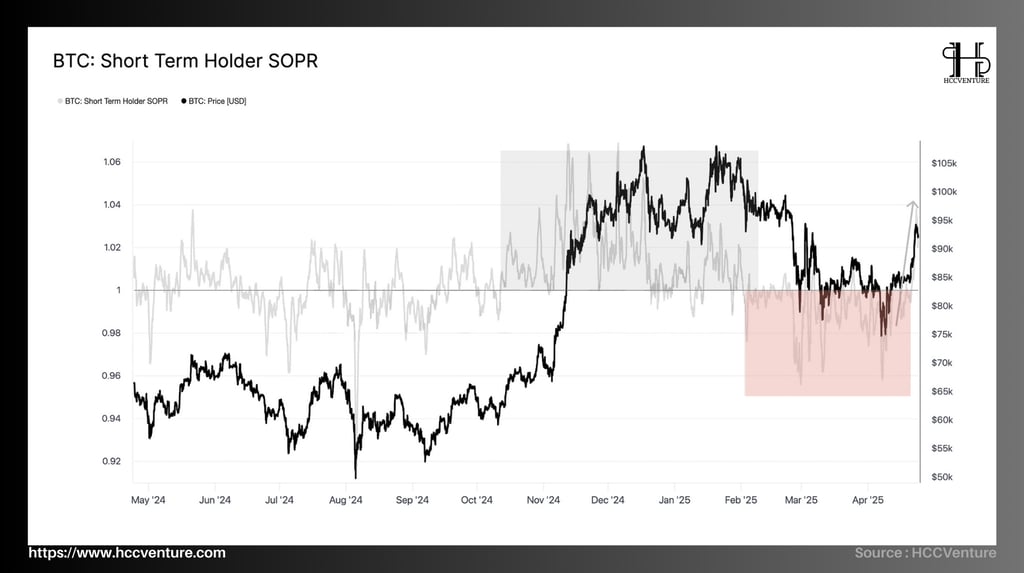
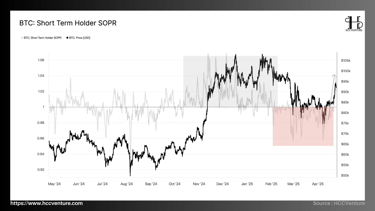
STH-SOPR has broken above the 1.0 breakeven level for the first time since late February 2025. This shows that the majority of short-term investors have moved from losing to profitable positions and are taking action to realize profits.
In the recent rally, it is the recent buyers who are the dominant group realizing profits .
This is a sign that short-term speculative money has reached the expected profit threshold and started selling.
STH-SOPR remaining above 1.0 is usually a characteristic of a bullish uptrend .
Short-term investors tend to continue to "hold orders" when expecting the price to continue to increase → this supports the upward momentum of Bitcoin price.
However, every time STH-SOPR increases sharply and reaches a peak, there is also the possibility of short-term corrections due to short-term profit-taking pressure.
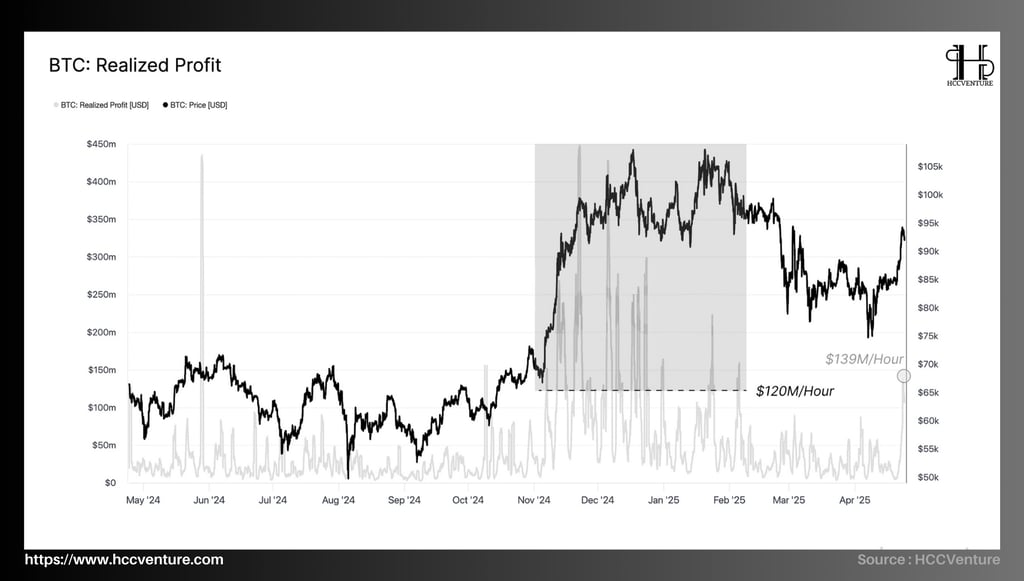
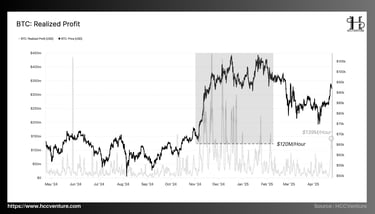
After a strong rally that took Bitcoin to the $94.7k region , the market is now at a crucial crossroads where profit-taking behavior will play a pivotal role in determining the next trend.
Total Realized Profit on the hourly chart skyrocketed to $139.9 million/hour .
This is about 17% higher than the average baseline threshold of $120 million/hour .
The increase in realized profits shows that many investors are taking advantage of this rally to lock in profits . However, if the market can absorb this selling pressure without breaking the trend , this will be an extremely positive sign of internal strength.
This reflects that buying pressure is still strong enough to balance supply from profit-taking.
Conversely, if selling pressure from profit-taking exceeds buying pressure , causing prices to fall sharply below technical support levels, the market will confirm a "dead cat bounce" pattern - that is, a short-term recovery that fails and continues the downtrend.
This pattern is similar to previous relief rallies , when positive sentiment was short-lived and then quickly weakened.
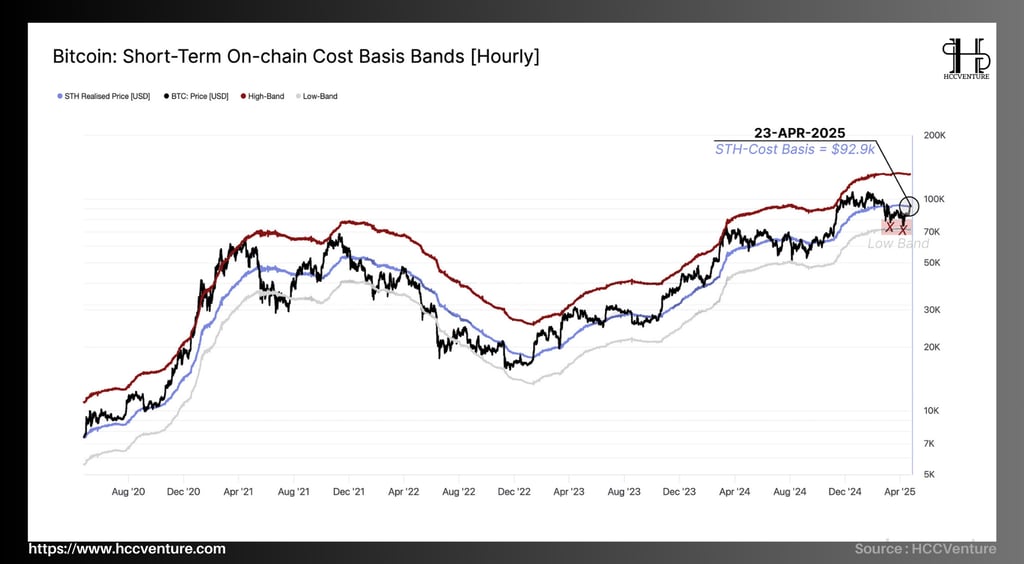
During this rally, Bitcoin temporarily broke above the $92.9k mark , which is the Average Cost of Ownership for Short-Term Investors (STH) . Historically, this is an extremely important on-chain threshold :
When BTC is above this level , most short-term investors are taking temporary profits , creating conditions for bullish sentiment to spread .
Conversely, if the price is below this mark, short-term investors are mostly losing money , prompting sell-off behavior, leading to downward pressure on prices.
During the July–September 2024 period , Bitcoin also had a recovery phase beyond the STH-Cost Basis threshold, but failed to maintain the upward momentum → leading to a deeper correction .
The current rally has a similar historical pattern where BTC price has crossed a psychological level but has not maintained it long enough to confirm an overall trend change from “Bearish” to “Bullish”.
Short-term investor sentiment is improving , however, a real regime shift still needs to be confirmed more clearly – i.e. holding and consolidating above $92.9k for several consecutive trading sessions .
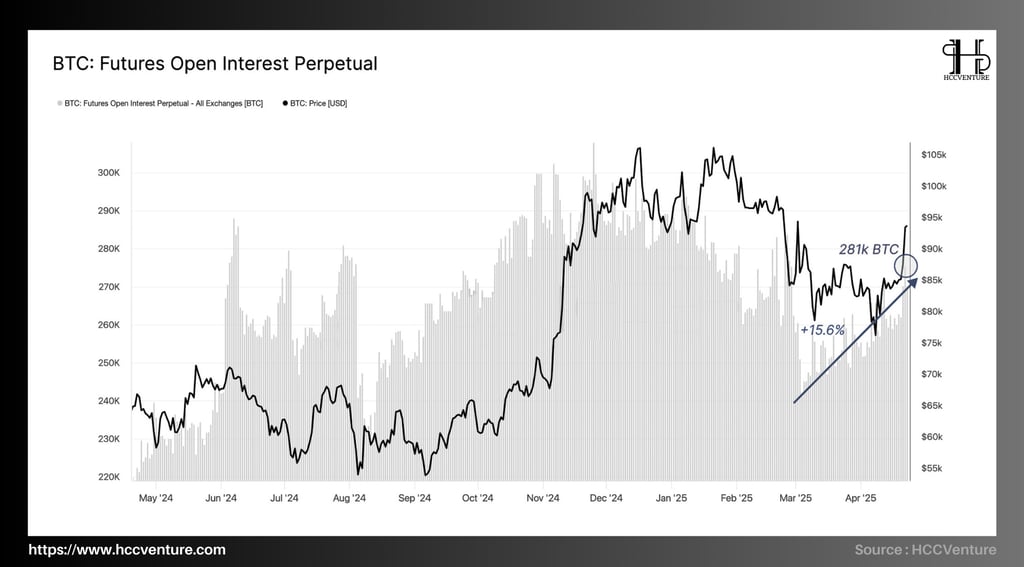
Amid a strong market recovery, data from the derivatives market shows a notable trend: traders are betting on the downside through perpetual contracts .
Open Interest (OI) on perpetual contracts increased from 243k BTC (early March) to 281k BTC , equivalent to +15.6% . This is a significant increase in open position volume , reflecting that:
Traders are increasingly using leverage ;
And most of the newly opened positions are on the short side – expecting the price to correct after the increase.
When the market is in a recovery trend, and short positions increase , this often opens up risks for short sellers :
If the price continues to rise → many short positions are liquidated → creating a short squeeze (forced to buy back BTC to close positions), causing the price to continue to push up.
In addition, increasing leverage makes the market more volatile , because just a slight price move to the liquidation zones → creates a chain reaction → large price fluctuations occur quickly.
A sensible strategy at this point is to closely monitor technical resistance zones, funding rates and Open Interest behavior – to determine whether the market is consolidating or about to break out due to a squeeze effect.
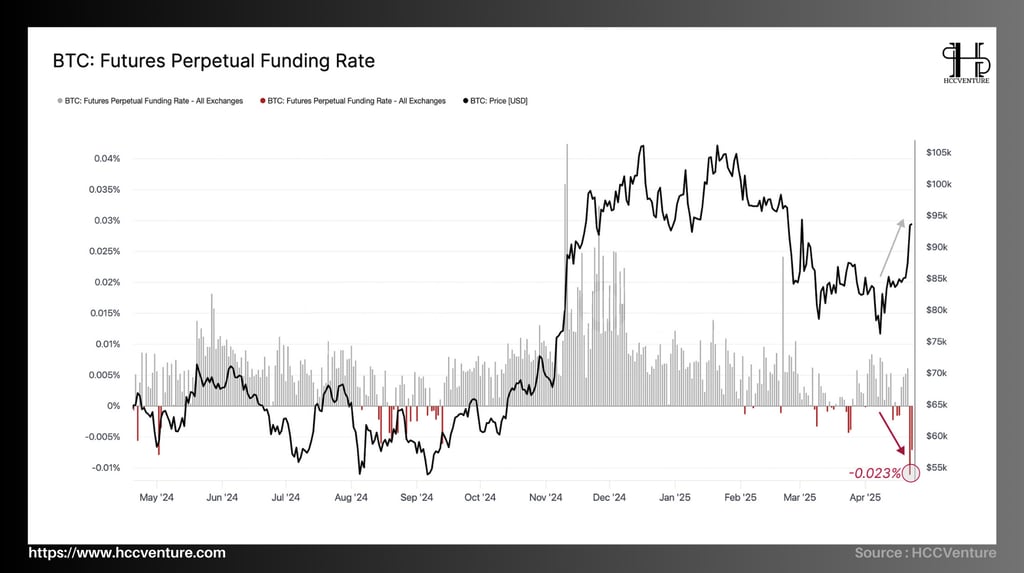
The most notable event currently in the derivatives market is the sharp increase in Open Interest – accompanied by a significant decrease in Funding Rate to a negative level (-0.023%) .
This is a particularly important combination signal, often signaling the possibility of a short squeeze . Short positions are paying a premium for long positions , with the majority of traders on perpetual platforms betting on the downside.
There is an easy to observe trend when the divergence is in the middle, Open Interest increases (many people enter new positions) and Funding Rate is negative (most people lean towards short) -> the market falls into crowded trade.
If the price continues to increase slightly → short positions start to hit stop-loss or liquidation zone → short squeeze is triggered → the price will be pushed up strongly in a short time .
The market is currently in a psychologically sensitive position . Although derivatives traders are pessimistic, the spot market is showing signs of recovery thanks to:
Spot ETFs see strong net absorption ($1.54B),
And the signal from long-term investors (STH & LTH) is improving.
If the shorts continue to be too crowded and the price remains above $92.9k (STH-Cost Basis) → the risk of short squeeze is very high .
Evaluation and Conclusion
Bitcoin's strong recovery, especially as its price surpassed $94,000, reflects a combination of macro optimism and a shift in investor sentiment.
Positive signals regarding the US-China tariff agreements have triggered a price rally, helping Bitcoin regain its Short-Term Holder Cost Basis and push the Supply-to-Earn ratio up to 87.3%.
Several Onchain indicators suggest that Bitcoin is undergoing a constructive recovery, with the added element of a “short squeeze” forming in futures markets.
With a Supply to Profit Ratio of 87.3%, this is an indicator that the majority of the current Bitcoin supply is providing profits to investors.
The futures market is witnessing a short squeeze, meaning that short sellers of Bitcoin are forced to buy back Bitcoin when the price rises higher than they expected.
One of the key signs of this recovery is the return of institutional capital. Exchange Traded Funds (ETFs) recorded inflows of up to $1.54 billion in a single day.
Bitcoin is on a strong recovery path, but the Short-Term Holding Cost level will be a key factor in determining the next market trend. If Bitcoin can hold above this level and push the price higher, a strong bullish phase could be seen in the near future.
Join the HCCVenture community to get the latest market information. Once again, we give our opinion on potential projects in the crypto market. This is not investment advice, consider your portfolio. Disclaimer: The views expressed in this article are solely those of the author and do not represent the platform in any way. This article is not intended to guide investment decisions.
API & Data : Glassnode
Compiled and analyzed by HCCVenture
Join our telegram community: HCCVenture
Explore HCCVenture group
HCCVenture © 2023. All rights reserved.


Connect with us
Popular content
Contact to us
E-mail : sp_contact@hccventure.com
Register : https://linktr.ee/holdcoincventure
Disclaimer: The information on this website is for informational purposes only and should not be considered investment advice. We are not responsible for any risks or losses arising from investment decisions based on the content here.

TERMS AND CONDITIONS • CUSTOMER PROTECTION POLICY
ANALYTICAL AND NEWS CONTENT IS COMPILED AND PROVIDED BY EXPERTS IN THE FIELD OF DIGITAL FINANCE AND BLOCKCHAIN BELONGING TO HCCVENTURE ORGANIZATION, INCLUDING OWNERSHIP OF THE CONTENT.
RESPONSIBLE FOR MANAGING ALL CONTENT AND ANALYSIS: HCCVENTURE FOUNDER - TRUONG MINH HUY
Read warnings about scams and phishing emails — REPORT A PROBLEM WITH OUR SITE.