

On-chain analysis week 16/2026: Conditional recovery - reversal still carries risk
The current Bitcoin picture is one of a recovery approaching its medium-term price ceiling, rather than a confirmed uptrend, and remains 5.2% below its True Market Mean at $78.1K.
4/21/202611 min read

Market Summary
Bitcoin is currently trading steadily around $74,000, just 5.2% away from the key True Market Mean resistance level at $78.1K. The market is approaching its most important short-term resistance ceiling, with significantly improved spot demand and ETF inflows, confirming that the recovery is shifting from technical to structural stability.
Short-Term Holder Supply in Profit is currently at 43.2%, still with considerable room to maneuver before reaching typical distribution levels, indicating that selling pressure from short-term holders is not yet a major obstacle. Simultaneously, the 30-day EMA of the Realized Profit/Loss Ratio is at 1.16, suggesting that profit-taking is increasing but remains within controllable limits, and the market is effectively absorbing this selling pressure.
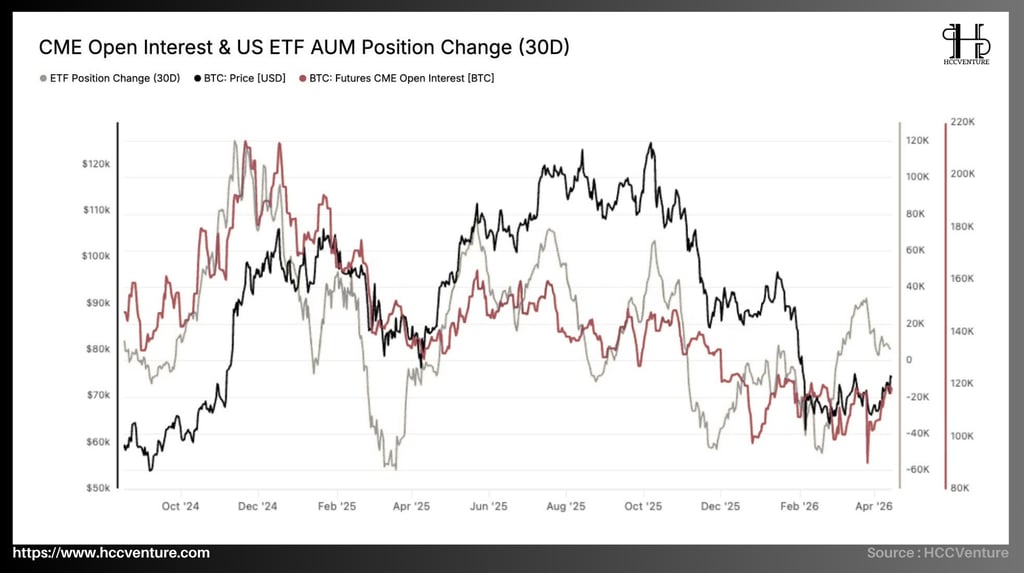
Institutional positioning remains stable with ETF inflows returning slightly positive and CME exposure recovering, although participation remains below previous highs, reflecting selective and cautious institutional participation. Spot and liquidity dynamics show uneven but improving demand, with Binance-led buying outperforming Coinbase and Hyperliquid data confirming price movement between dense long/short liquidation clusters, creating a solid liquidity-driven range.
Derivatives maintain a neutral-to-fragile structure but are shifting positively, as funding rates balance, implied volatility compresses, and exchange flows turn modestly positive, signaling an initial accumulation phase with increasingly strengthened conviction.
Currently, even though Bitcoin's price is in the $74,000 range after a rebound from $60,000, Spot Relative Volume remains at 0.9–1.0 without falling below 0.7, a significant difference from previous drawdowns where the index typically plummeted before the market truly bottomed out. This confirms that organic spot demand is in a highly balanced state, directly supporting liquidity and conviction as the market awaiting liquidity moves into a phase of true liquidity expansion.
Analyzing on-chain metrics
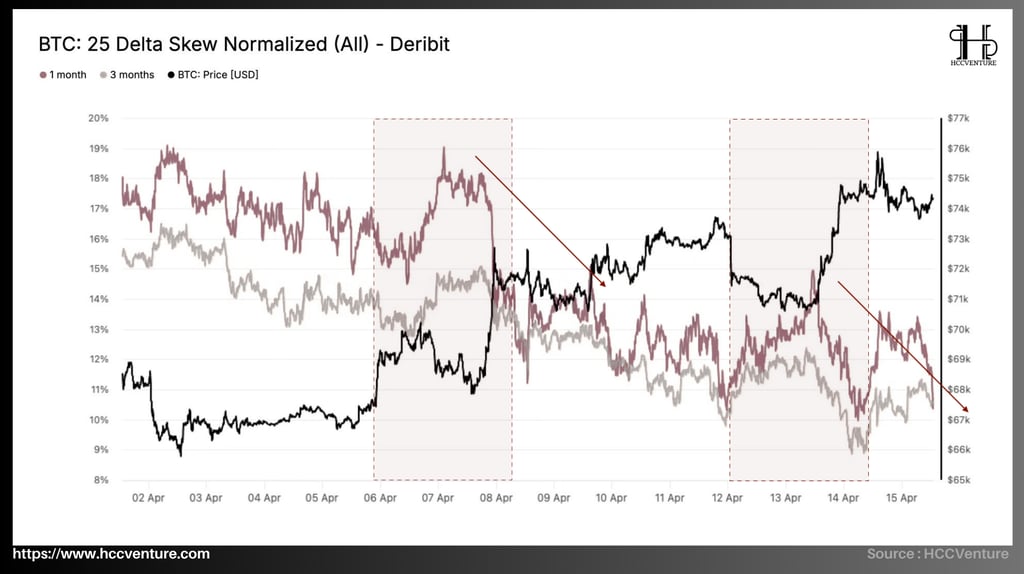
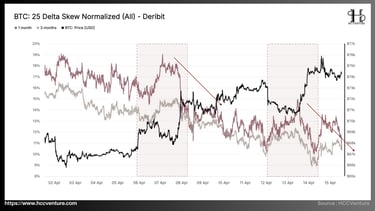
The 25 Delta Skew Normalized (All) – Deribit index provides a quantitative view of option pricing structure, particularly the relationship between demand for bearish hedging (put options) and bullish expectations (call options). Currently (mid-April 2026), Bitcoin is trading around $74,000–$75,000 , while the 1-month 25 Delta Skew index is fluctuating around 12%–13% , and the 3-month index is at 10%–11% .
Compared to early April, when the skew reached a high of 17%–19% , the current level has decreased by approximately 30–40% , reflecting a significant loosening of extreme hedging demand. However, the fact that the skew remains positive at double digits suggests that the pricing structure is still clearly skewed towards put, meaning that downside protection remains dominant.
In options pricing theory, a positive Delta Skew of 25 indicates that the implied volatility of put options is higher than that of call options at the same delta value, meaning the market is willing to pay a higher premium for hedging against price declines. The fact that this indicator remains stable in the 10%–13% range – even after falling from its extremes – is a consistent signal that defensive sentiment continues to dominate pricing behavior.
Compared to previous stress peaks, particularly during the sharp correction phases of 2022 and late 2025, when the skew could exceed 20% , the current level is significantly lower, suggesting that tail-risk hedging has been partially eased. However, the important point is that the skew has not returned to the neutral zone (0–5%), but remains relatively high.
The divergence between short-term (1M ~12–13%) and medium-term (3M ~10–11%) skew is also significant. The sharper decline in the long-term skew reflects that investors have reduced their tail-risk hedging needs in the medium term, but maintain high hedging demand in the short term. This is consistent with the market context being near a key resistance zone (~$78K), where the risk of a technical correction remains.
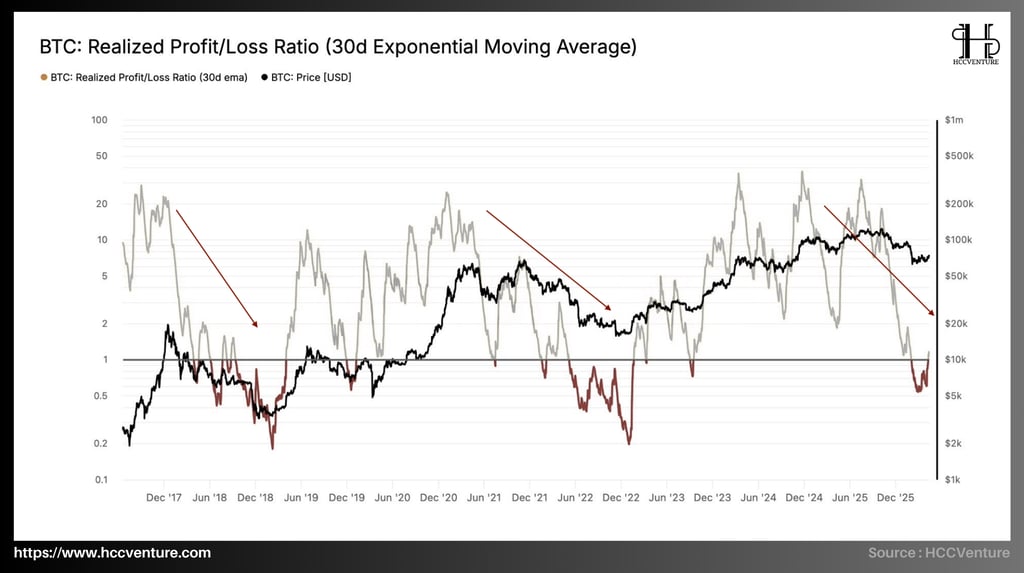
The Realized Profit/Loss Ratio (30D EMA) is signaling that the market is prioritizing profit realization over loss realization . The value of this indicator is recorded at 1.16 , meaning that for every $1 of loss locked in on the chain , the market locks in approximately $1.16 in profit . This isn't an immediate reversal signal, but in bear-market rallies, an increase in this ratio is often a warning sign of distribution rather than confirmation of sustainable new demand.
When prices approach a cost of capital threshold representative of active supply, profit-taking pressure typically increases faster than the rate of expansion of new demand; therefore, a Realized Profit/Loss Ratio remaining above 1 at this point implies that the market is entering a zone where the supply hanging above becomes thicker , and the buying momentum is not yet strong enough to counteract that distribution.
Looking at the broader investor structure, this signal carries even more weight as Short-Term Holder Supply in Profit is only at 43.2% , significantly lower than the historical distribution threshold around 54.2% that HCCVenture considers a common area for local tops in bear-market rallies. This means there is still some upside potential before the market enters a typical distribution zone, but that upside comes with the increasing risk that each higher move will trigger further profit-taking.
A healthy upward movement typically requires a Realized Profit/Loss Ratio to increase, but not too rapidly; conversely, when this ratio jumps to 1.16 while the price is only just approaching a resistance zone, it indicates that the upward momentum is being partially dampened by short-term distribution .
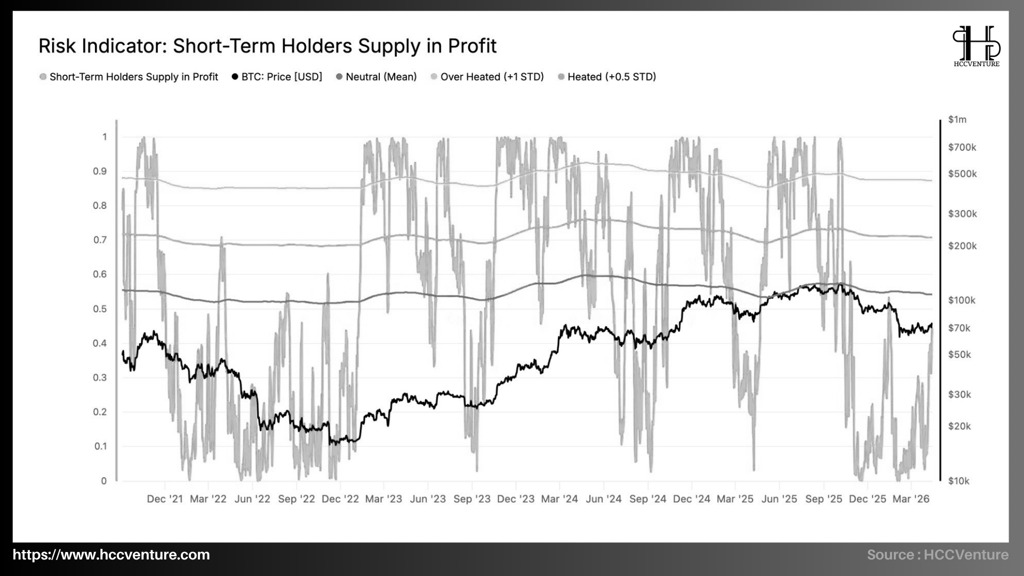
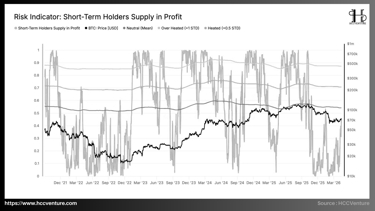
The Short-Term Holder Supply in Profit (STH-SiP) indicator currently provides a highly reliable quantitative view of the supply-demand equilibrium during Bitcoin's rallies. The latest data shows that the percentage of short-term supply holdings in profit is approximately 43.2% , significantly lower than the statistical average of ~54.2% , the historical level corresponding to the region where rallies in bear markets typically reach saturation and begin to show large-scale distribution.
The fact that this indicator remains below its average suggests that profit-taking pressure from new investors has not yet reached its peak, meaning the market structure still has some room for growth before entering a typical distribution phase.
The STH-SiP at 43.2% reflects that the majority of short-term investors have not yet reached a sufficiently large profit level to trigger a mass sell-off. Compared to previous periods, when this indicator approached or exceeded the 50–55% range , the market typically witnessed a rapid increase in realized profits and the formation of local peaks.
Historical observations of this indicator reveal a distinct cyclical pattern: during market bottoms, STH-SiP typically falls to very low levels (below 20%), reflecting capitulation when a large proportion of short-term investors are incurring losses. Conversely, during short-term bear market rallies, the indicator rises above 50%, where unrealized profits become substantial enough to trigger widespread profit-taking.
Therefore, as STH-SiP continues to approach the 50–54% range , distribution pressure will not only increase linearly but tend to increase exponentially, due to the synergy between the number of profitable investors and the pre-existing profit-taking trend. Thus, the $78K region – corresponding to the True Market Mean – is not only a price resistance level but also a convergence point of many on-chain factors that could trigger simultaneous distribution.
Specifically, spot CVD has rebounded from deep negative territory to positive territory , reflecting a clear shift from active selling pressure to net supply absorption in the spot market. However, this recovery is not uniform across platforms , with Binance leading the rebound, while Coinbase CVD remains relatively subdued , implying that institutional capital from the US has not yet returned strongly and steadily.
The most notable point in the off-chain data is the divergence between the two major liquidity centers . Binance shows clearer buy signals, often associated with short-term investors and offshore/retail flows, while Coinbase has yet to show commensurate expansion, meaning demand from the more institutional group is still recovering slowly.
We can consider this a "selective bid" rather than a "fully established demand regime" ; this is very important because historically, sustained price increases have almost always required the consensus of both retail and institutional money flows, rather than just one side leading the way.
The perpetual market is a liquidity-dominated range , with thick long liquidation clusters at $63K–$65K and short liquidation clusters at $74K–$76K . This structure explains why the price is clinging to the current range but hasn't made a decisive breakout, as the market is being pulled back and forth by liquidation zones near the price, instead of being driven by a sufficiently strong intrinsic trend.
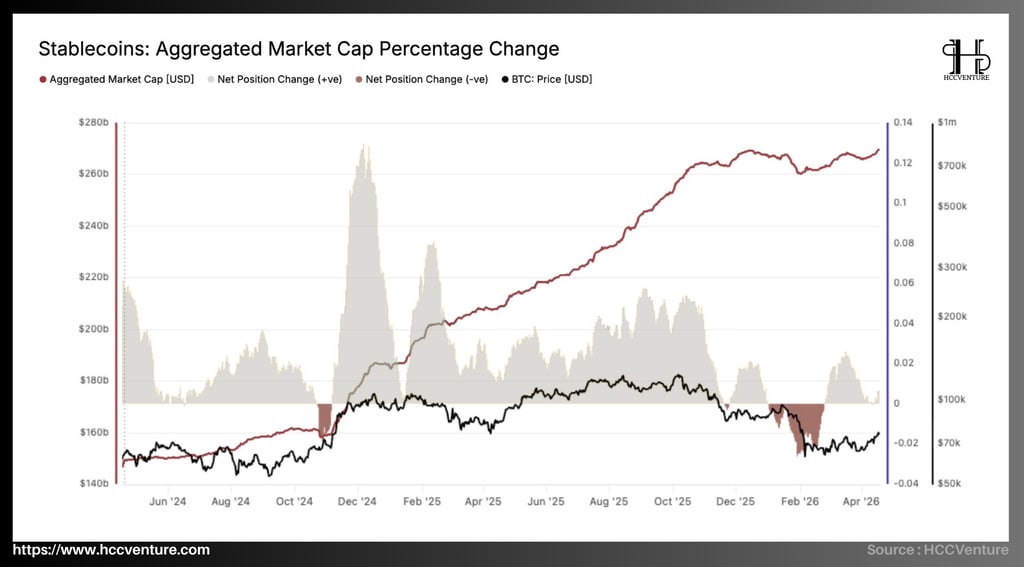
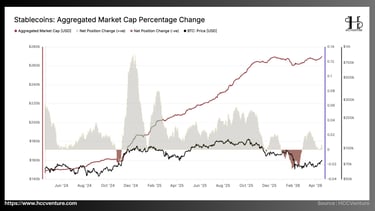
As of Q2/2026, the total market capitalization of stablecoins has reached approximately $265–270 billion , a significant increase from the low of around $160–165 billion recorded at the end of 2023. Thus, liquidity has expanded by more than ~65% from the cycle bottom, simultaneously establishing a new historical high. This is a structural signal, indicating that fiat and defensive capital flows continue to be injected into the crypto ecosystem, despite Bitcoin's medium-term price corrections.
A deeper analysis of the Net Position Change component reveals two distinct phases. The period from Q4/2024 to Q1/2025 saw significant increases in capital inflows (+ve), with peak net inflows reaching approximately $20–25 billion per month , coinciding with Bitcoin's strong expansion from the $40,000 region to above $70,000. This confirms the causal relationship between liquidity expansion and price trends, as stablecoins act as a source of capital input for the market.
However, moving into late 2025 and early 2026, the cash flow structure underwent a significant change. Although the overall market capitalization maintained a slight upward trend, Net Outflows (-ve) occurred with greater frequency, especially during Bitcoin's sharp correction to the $60K–$65K range .
This is a key difference from the early stages of an uptrend, when capital flows typically expand synchronously and aggressively. The fact that market capitalization remains high but growth has slowed suggests the market is entering a passive liquidity accumulation phase , rather than an active capital deployment phase.
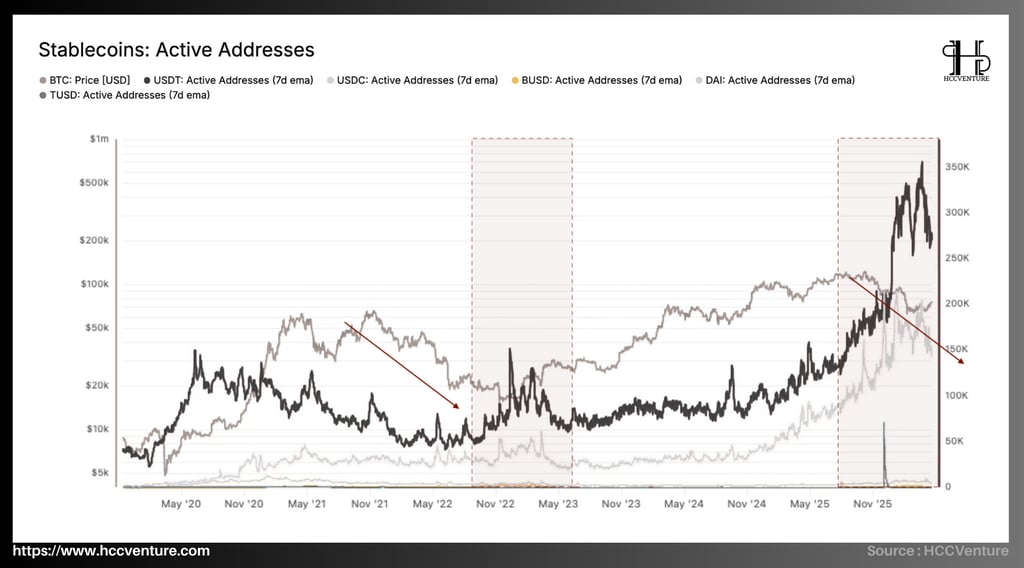
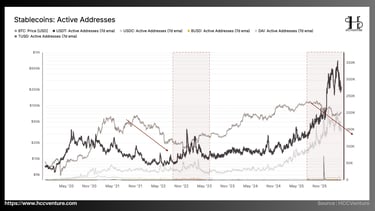
USDT is currently the most active stablecoin, with its 7-day EMA of active addresses fluctuating around 200K–300K , even experiencing short bursts nearing 350K . Compared to the period before 2024, when USDT active addresses mainly hovered around 50K–120K , the current level is significantly higher, reflecting the strong expansion of transaction frequency and demand for USDT throughout the entire ecosystem.
USDC ranks second with its 7-day EMA active addresses currently fluctuating around 140K–200K . Compared to the 2022–2023 period, when this indicator mostly stayed in the 40K–80K range , the current level shows a significant increase in USDC usage. A key difference is that USDC tends to reflect more institutional capital flows and transparent payments; therefore, the increase in active addresses in USDC is generally seen as a more positive signal regarding liquidity quality compared to stablecoins with a purely short-term trading orientation.
In terms of cycles, the upward trend of active addresses became evident from the end of 2024 and continued throughout 2025–2026, precisely when the Bitcoin market entered a new expansion cycle. This is not a random fluctuation, but a direct reflection of the increased capital flow on the blockchain. When Bitcoin surges, the demand for converting to stablecoins to take profits, rebalance portfolios, or prepare for new buying opportunities all contribute to an increase in active addresses. Therefore, the surge in USDT and USDC active addresses is evidence that the market is operating with high liquidity and a truly high trading intensity .
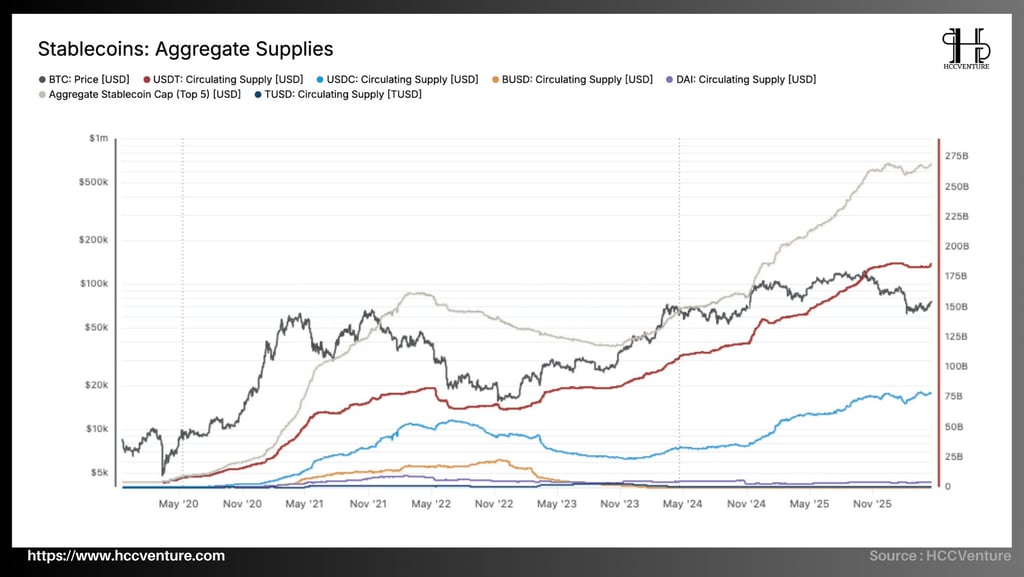
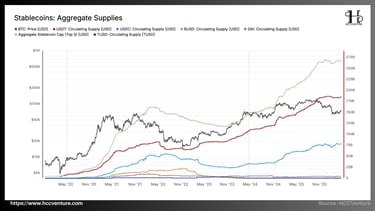
Aggregate Supplies provides a fundamental perspective on the size and liquidity structure of the entire crypto market by tracking the total supply of major stablecoins such as USDT, USDC, DAI, BUSD, and TUSD. In the context of the digital asset market, stablecoins are not just intermediaries but also directly represent tokenized fiat capital flows; therefore, the expansion or contraction of the total stablecoin supply accurately reflects the market's liquidity cycle.
As of Q2/2026, the total market capitalization of stablecoins (Top 5) has reached approximately $270–275 billion , setting a new record high and significantly increasing from the low of around $120–130 billion at the end of 2022. Thus, the liquidity size has expanded by approximately 110–120% from the cycle bottom. This is a structurally significant signal, indicating that net capital has returned to the crypto ecosystem with considerable intensity and is expected to remain so in the medium term.
Broken down by its components, USDT continues to play a key role as a major liquidity pillar with a circulating supply of approximately $170–180 billion , a significant increase from below $70 billion at the bottom of the 2022 cycle. This increase is continuous and relatively uninterrupted, reflecting the demand for USDT in transactions and capital flows, particularly in offshore markets and the retail segment. This is a crucial factor in maintaining deep liquidity for the market, especially during periods of high volatility.
Compared to its past low point (~$120B), the current stablecoin supply is approximately $150 billion higher , creating a large, untapped "liquidity pool." This is a key factor in maintaining market depth and the ability to absorb sell-off shocks, and also serves as a foundation for further expansion phases if capital inflows are triggered. However, the recent slowdown in growth despite the increase in total supply also suggests that the market is shifting towards passive liquidity accumulation , rather than the aggressive capital injection phase seen at the beginning of the cycle.
Our assessment and conclusions
In the current picture, Bitcoin is in a more selective stabilization phase rather than a confirmed uptrend. The latest data from HCCVenture shows the BTC price hovering around $74,000 , approximately 5.2% lower than the True Market Mean of $78,100 . Simultaneously, Short-Term Holder Supply in Profit remains at only 43.2% , significantly lower than the historical overheat threshold of around 54.2% . This suggests that the current rebound still has room for further upward movement, but has not yet reached the zone where distribution pressure typically flares up.
From an investor behavior perspective, the market structure remains defensive but is improving . HCCVenture notes a 30-day EMA of the Realized Profit/Loss Ratio at 1.16 , meaning realized profits are exceeding losses, reflecting profit-taking on strength rather than a new wave of aggressive buying. At the same time, ETF inflows and CME exposure have recovered, but participation remains below previous peaks, indicating that institutional capital is returning cautiously, not yet fully shifting to a "risk-on" stance.
Therefore, if we connect all these signals with current on-chain news and data, we can assert that Bitcoin is approaching its medium-term ceiling around the True Market Mean , but has not yet broken through this threshold with sufficiently strong money flow. The market has absorbed much of the previous downward shock, but the current structure remains a flow-driven rebound , sensitive to liquidity and polarized among investor groups.
The next phase for Bitcoin is not a confirmed breakout, but rather a process of testing price ceilings amidst a fragile recovery . The on-chain structure shows that selling pressure has weakened, buying pressure has returned, but market confidence is not yet uniform enough to create a structural uptrend. The most appropriate state at this point is: stability, improvement, but lacking conviction .
Disclaimer: The information presented in this article is the author's personal opinion in the field of cryptocurrency. This is not financial or investment advice. All investment decisions should be based on careful consideration of your personal portfolio and risk tolerance. The views expressed in this article do not represent the official stance of the platform. We recommend that readers conduct their own research and consult with experts before making any investment decisions.
API & Data : Glassnode, Dune, CoinGecko
Compiled and analyzed by HCCVenture
Join the HCCVenture organization here: https://link3.to/holdcoincventure
Explore HCCVenture group
HCCVENTURE QUANT JSCO
© 2026 HCCVENTURE. ALL COPYRIGHTS RESERVED.


Connect with us
Popular content
Contact to us
Address: 8th Floor, Bach Dang Complex Building, 50 Bach Dang Street, Hai Chau Ward, Da Nang City, Vietnam.
Phone: 1900 1509
Gmail : sp_contact@hccventure.com
Disclaimer: The information on this website is for informational purposes only and should not be considered investment advice. We are not responsible for any risks or losses arising from investment decisions based on the content here.
TERMS AND CONDITIONS • CUSTOMER PROTECTION POLICY
ANALYTICAL AND NEWS CONTENT IS COMPILED AND PROVIDED BY EXPERTS IN THE FIELD OF DIGITAL FINANCE AND BLOCKCHAIN BELONGING TO HCCVENTURE ORGANIZATION, INCLUDING OWNERSHIP OF THE CONTENT.
RESPONSIBLE FOR MANAGING ALL CONTENT AND ANALYSIS: HCCVENTURE FOUNDER - TRUONG MINH HUY
Read warnings about scams and phishing emails — REPORT A PROBLEM WITH OUR SITE.