


On-chain analysis week 16 / 2025: Growth in a time of weakness
Amidst the uncertainty over trade policy between China and the United States, hard assets continue to outperform: Gold hit a new all-time high of $3,300/oz, reflecting strong safe-haven flows. Bitcoin remains above $80,000, despite correction pressure from the stock market and venture capital flows.
4/23/20257 min read
Situation Summary
Bitcoin recorded the sharpest decline in the current cycle , marking a severe correction period. However, the drawdown is still within the acceptable range of a bull-market , similar to previous growth cycles (2013, 2017, 2021).
Notably, the median drawdown in this cycle is significantly lower than in previous cycles, indicating solid market demand and a more mature ownership structure .
Liquidity in the digital asset ecosystem continues to tighten , as shown by: a sharp decrease in capital inflows; Stablecoin supply is flat , no longer a growth driver as before. Altcoins and assets outside of BTC–ETH are particularly sensitive to liquidity shocks, recording a drawdown of more than -40% since the December 2024 peak .
The market is currently facing the largest unrealized losses in history . However, the majority of the losses are coming from new investors , while Long-Term Holders remain in the overall profit position .
On-chain metrics analysis
Global financial markets have seen a bout of volatility over the past week , largely driven by the announcement of new US tariffs and escalating trade tensions.
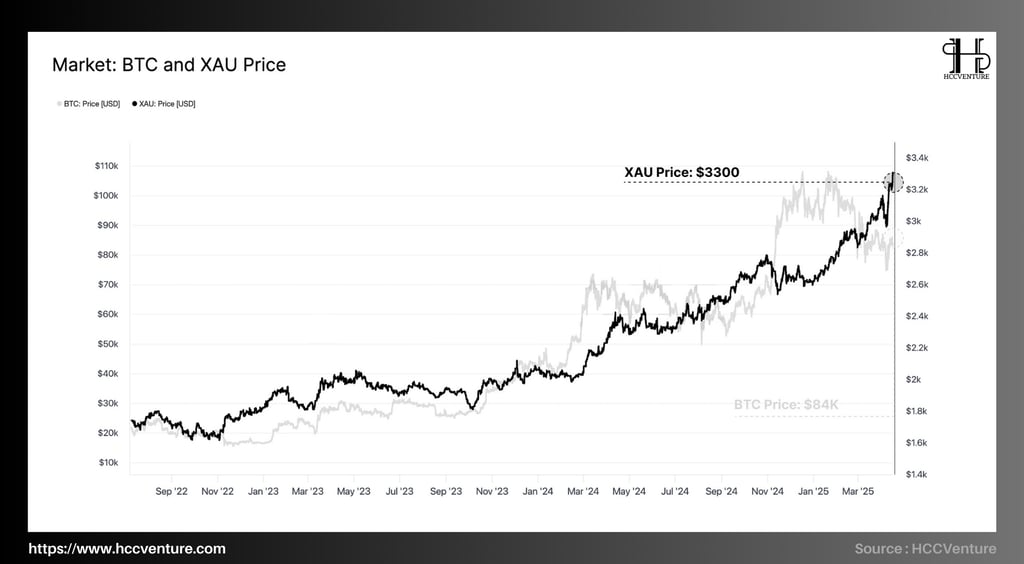
Despite the general market being under pressure, two hard assets – gold and Bitcoin – reacted strongly but diverged over time :
Gold hits new historical peak at $3,300/oz :
Beyond its traditional role as a “safe haven,” gold has hit a new all-time high of $3,300/oz , registering impressive growth amid uncertainty.
Gold buying is driven by the need to store assets that are neutral , protected from national monetary and policy risks.
Bitcoin Holds Above $80,000:
BTC initially fell sharply to $75,000 , due to a systemic initial reaction alongside other risk assets.
However, the quick recovery back to the $85,000 mark , offsetting the entire decline, shows significant intrinsic strength .
Currently, Bitcoin has stabilized and "sideways" in the post-shock range , while many other assets continue to decline.
The performance of gold and Bitcoin over the past volatile week is not only a safe-haven response , but also a macro indicator of a medium- to long-term shift in the role of reserve assets .
With more countries and financial institutions taking an interest in “globally neutral” assets , we can expect the role of Bitcoin and gold to continue to strengthen in the coming years, especially as geopolitical tensions and macro uncertainty persist.
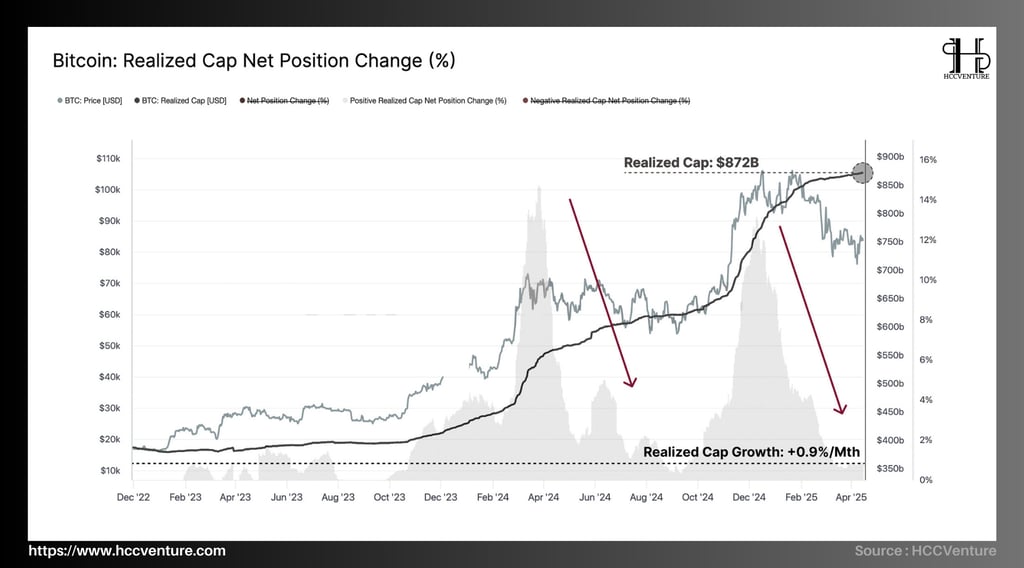
Bitcoin's Realized Cap is now at an all-time high of $872 billion – a testament to the scale of money that has flowed into the market during the recent bull cycle.
However, it is worth noting that the capital growth rate is now only +0.9%/month , which is almost flat. The sharp decline in growth rate shows an important reality: “ New capital flows into the market are slowing down significantly.”
The fact that capital flows are still growing (albeit weakly) during the crisis is a positive signal of the stability of long-term confidence , especially from institutional investors or long-term holders. However, the reality shows that:
Investors are tending to "sit still" , limiting the allocation of additional capital in the short term.
Low liquidity combined with high macro volatility often leads to defensive behavior, prolonging the accumulation or sideways phase of prices.
In the short term, the market may continue to trade in a “sideways-to-soft” state, but with the capital flow base still positive, Bitcoin is still maintaining a healthy macro structure in the long term .
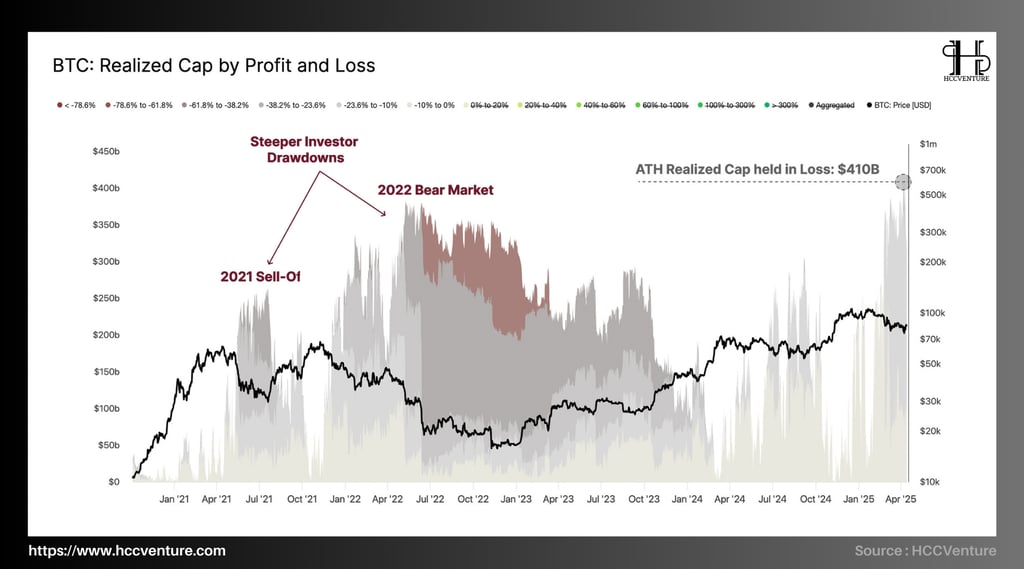
Amidst the volatile market and prevailing “risk-off” sentiment, assessing the level of unrealized loss in the Bitcoin network is crucial to understanding the pressure investors are under .
The Realized Cap (real capitalization) value corresponding to the amount of BTC in loss has reached a historical peak (ATH) of $410 billion USD , when the BTC price corrected to $75,000.
This is higher than previous severe declines such as:
May 2021 sell-off
Bear market in 2022
Although the total capitalization is suffering unprecedented losses, it is important to emphasize that the majority of investors are currently suffering relatively mild drawdowns , commonly in the range of -10% to -23.6% .
In contrast, in previous cycles: 2021 & 2022 , many investors suffered heavy losses of up to -61.8% or even -78.6% .
This shows lower individual tolerance , even though the total network damage is higher (since BTC has a much larger market cap today than in 2021-2022).
The market is currently in a state of tension, but the macro structure has not yet broken. The fact that many investors only suffered slight losses reflects that the market sentiment has not reached the point of panic, and the possibility of recovery is still high if there are supporting signals from the macro or capital flows.
However, pressure from a large amount of BTC in the loss zone could limit the upside momentum in the short term as investors tend to "break-even sell".
Despite the increasing loss pressure, the market structure remains significantly more stable than in previous bear cycles, showing that Bitcoin is maturing and has growing resilience in the face of global economic volatility.
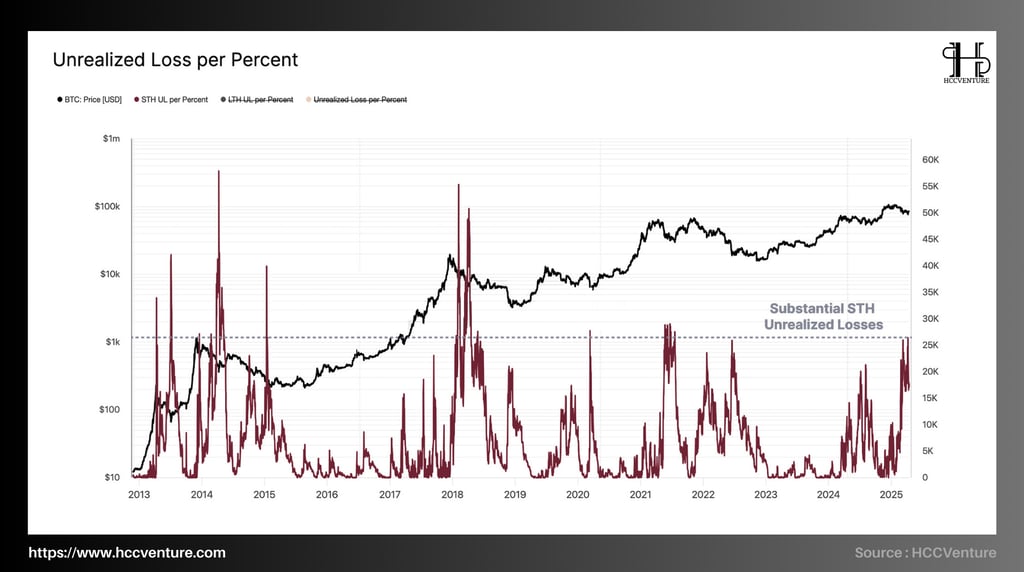
Unrealized Loss per Percent Drawdown is recording very high levels , representing relatively severe losses for short-term investors (STH) – those who bought in recent weeks.
The current loss level is equivalent to:
Early 2018 bear cycle
May 2021 sell-off
Bear market in 2022
Even though BTC only corrected ~10-15% from the peak, STH suffered relatively large losses because they often bought at high prices near the peak and had little time to accumulate.
STH is often a group that is easily affected by market psychology and is easy to sell off when prices fall. Therefore:
The fact that STH is taking a big loss is a potential warning of short-term selling pressure .
Without strong recovery signals from prices or new cash flow, this group could create a panic sell wave.
However, Long-Term Holders (LTH) are making profits, showing that the market is still being “held up” by steadfast people.
The level of loss of STH is equivalent to previous down cycles, and this is a signal that the market is entering the "psychological test" phase of weak investors . Meanwhile, the group of long-term investors is still controlling the market, opening up opportunities if selling pressure decreases.
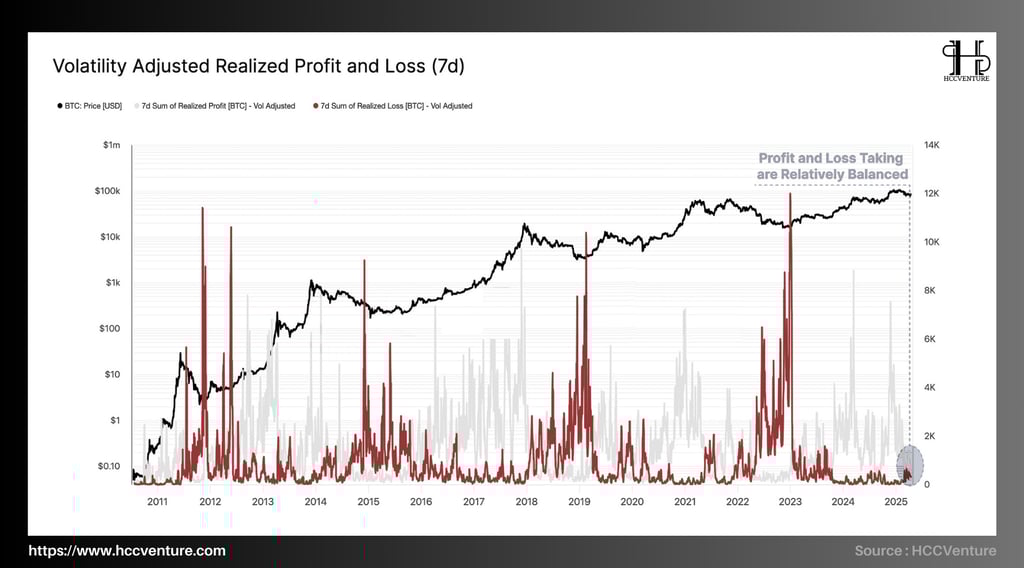
Volatility Adjusted Realized PnL. Psychological "Balance" of Market
From the beginning of 2024 until now, the volume of BTC profit-taking and stop-loss (after adjusting for volatility) is almost equal , shown by the intersection of the two lines (circle marked on the right of the chart). This reflects a neutral market sentiment , with no strong profit-taking trend or panic selling.
In the period when the market is looking for a balance point after the strong increase at the end of 2023, this state means:
Investors have not been forced to sell too much.
There is also no clear signal of new FOMO money pushing up prices.
LTH is still in a state of real profit , meaning they have no pressure to sell. However, there is a sensitive point to watch for, the 2024 peak buyers are gradually "converting" into LTH (after 155 days of holding).
If prices continue to stagnate or fall further:
This new LTH group will start to incur losses , increasing the total unrealized losses in this group.
History shows that when LTH starts to lose heavily , it is usually a confirmation signal that a bear market has been established (albeit with a delay from the price peak).
Market sentiment is currently in a “transition” zone, with realized profit/loss levels fairly balanced. This is not a bearish signal , but it is a sensitive time to closely observe the factors that transition to a bear market , especially from the behavior of newly formed long-term investors.
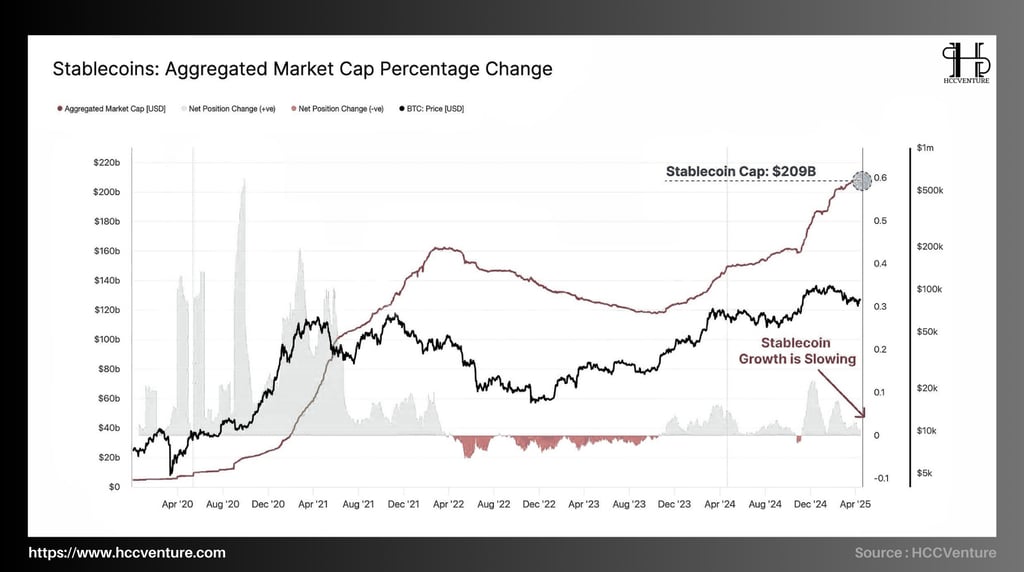
Since the beginning of 2024, the stablecoin capitalization has been steadily increasing . However, the volatility percentage chart (bottom of the chart) shows that the growth rate has slowed down significantly since the end of Q1/2025.
Stablecoins as a measure of market liquidity:
They are “ digital dollars ” — representing money that is ready to flow between digital assets.
Is the underlying asset in most CEX and DEX exchanges.
When stablecoin supply increases → signal money is flowing in → liquidity improves.
Conversely, when the growth rate slows down or decreases → reflects:
New money flow into the market is down.
Investors may be pulling out.
Signals of a market in a "tightening" liquidity phase .
If the stablecoin capitalization starts to decline in absolute terms , it is a signal that the market is shrinking. If the capitalization increases sharply again, it could be a preparation phase for a new bullish wave .
Evaluation and Conclusion
Despite its stability, Bitcoin has undergone its steepest correction in the 2023–2025 cycle. This price drop has hit short-term investors – those who bought at the recent peak – hard. This group is now bearing the brunt of unrealized losses .
New investors are under heavy pressure of losses. They are easily affected psychologically, leading to the possibility of a sell-off. However, Long-Term Holders are hardly affected, still holding large profits , due to having bought in from previous cycles. Showing strong confidence and experience in overcoming fluctuations .
The current phase reflects a healthy correction , not a crisis. Bitcoin’s relative strength – along with Gold’s – shows a growing macro position .
The slowing growth in stablecoin supply , coupled with the balance between realized profits and losses , reinforces the view that the market is in a neutral liquidity state , not yet entering a panic phase.
While the market remains volatile, the calmness of long-term investors , combined with capital still flowing into core assets , suggests this may just be a mid-cycle correction , rather than the start of a macro bear market.
Join the HCCVenture community to get the latest market information. Once again, we give our opinion on potential projects in the crypto market. This is not investment advice, consider your portfolio. Disclaimer: The views expressed in this article are solely those of the author and do not represent the platform in any way. This article is not intended to guide investment decisions.
API & Data : Glassnode
Compiled and analyzed by HCCVenture
Join our telegram community: HCCVenture
Explore HCCVenture group
HCCVenture © 2023. All rights reserved.


Connect with us
Popular content
Contact to us
E-mail : sp_contact@hccventure.com
Register : https://linktr.ee/holdcoincventure
Disclaimer: The information on this website is for informational purposes only and should not be considered investment advice. We are not responsible for any risks or losses arising from investment decisions based on the content here.
TERMS AND CONDITIONS • CUSTOMER PROTECTION POLICY
ANALYTICAL AND NEWS CONTENT IS COMPILED AND PROVIDED BY EXPERTS IN THE FIELD OF DIGITAL FINANCE AND BLOCKCHAIN BELONGING TO HCCVENTURE ORGANIZATION, INCLUDING OWNERSHIP OF THE CONTENT.
RESPONSIBLE FOR MANAGING ALL CONTENT AND ANALYSIS: HCCVENTURE FOUNDER - TRUONG MINH HUY
Read warnings about scams and phishing emails — REPORT A PROBLEM WITH OUR SITE.