


On-chain analysis week 15/2025: BTC/ETH continues to fall sharply, the market cannot reverse
Bitcoin price dropped sharply from the $85k region to $76k, breaking the psychological and technical support zone. Meanwhile, Altcoins such as Ethereum, Solana, and especially XRP also recorded a wide horizontal decline - reflecting the overall market sentiment turning to the defensive. On-chain indicators have reached important thresholds
4/14/20259 min read

Market Summary
The announcement of new US tariffs has sent shockwaves through global financial markets, with many indices recording their worst trading session since March 2020. The digital asset market was not spared from the storm, as capital outflows were strong, leading to a wave of liquidity loss and widespread negative investor sentiment .
Money flows into Bitcoin, Ethereum and major digital assets have almost completely stopped , putting great pressure on liquidity and pushing up investment opportunity costs.
The total altcoin market capitalization has plummeted from $1 trillion in December 2024 to $583 billion today – a drop of nearly 42% in less than four months.
According to consensus analysis from technical models and on-chain data , the $93,000 area is the key price zone that needs to be recaptured for the market to restore its mid-term uptrend.
On the upside, the $65,000–$71,000 support zone acts as the last stronghold for buyers. Losing this zone would lead to increased risks from a technical perspective.
On-chain metrics analysis
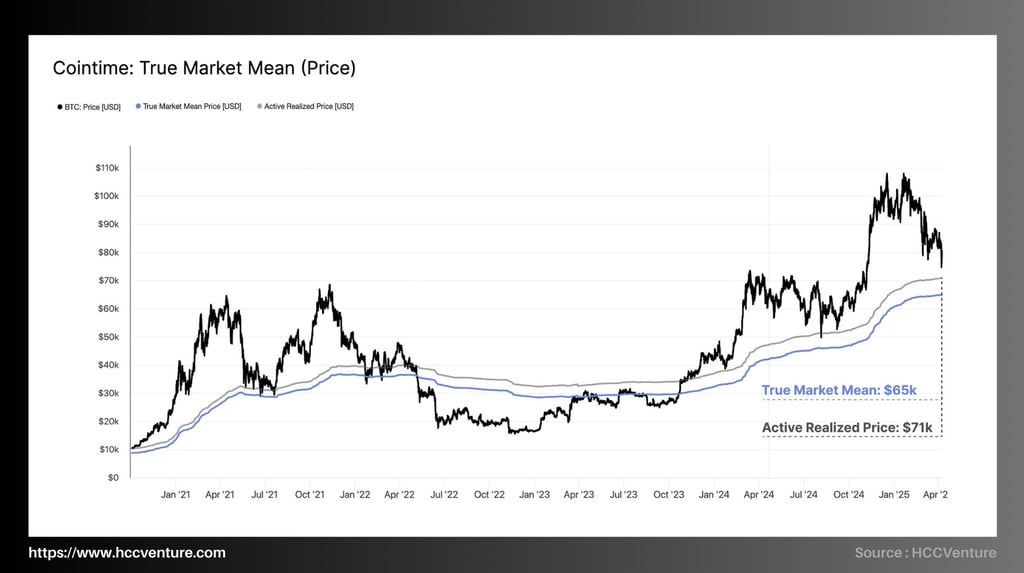
The $65k–$71k zone is currently the “life and death zone” of this cycle – holding this zone could set the stage for an accumulation and recovery phase. Active Realized Price and True Market Mean are two of the on-chain pricing models that have particularly high strategic value, as they are designed to reflect the actual average cost of capital of active investors in the market. Specifically:
Active Realized Price ($71,000): The average price of recently moved BTC, ignoring forgotten or inactive supplies.
True Market Mean ($65,000): Is the actual average price of the entire participating market, also excluding coins that are permanently lost or have been inactive for a long time.
Both of these indicators typically fluctuate around the midpoint of the market cycle , and in more than 50% of trading days, the BTC spot price will fluctuate around or above/below this zone . Therefore, this is considered a mean reversion model and a psychological barrier separating the bullish and bearish phases .
If price breaks and stays below the $65k–$71k zone , this would mean:
Most active investors will have unrealized losses .
Market sentiment can quickly turn extremely negative , triggering waves of loss-taking and massive capital withdrawals.
The market valuation level will be strongly lowered, opening up the risk of a deeper correction to lower levels such as $60k or even the $52k–$55k range if there is not enough supporting cash flow.
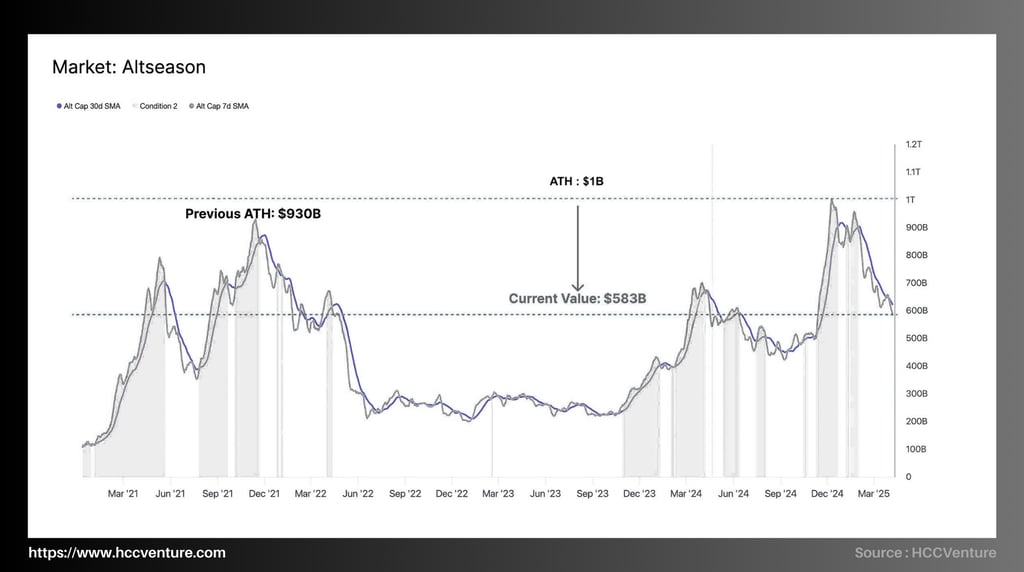
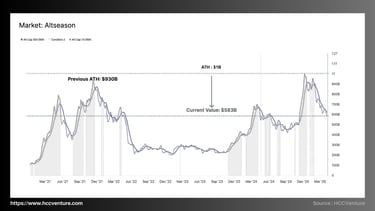
In December 2024, the total altcoin market capitalization (excluding BTC, ETH, and Stablecoins) reached a cyclical peak of $1,000 billion (1T USD) – a milestone that shows the high level of excitement of speculative money flowing into higher-risk assets.
However, since then, the market has entered a sharp correction , bringing the altcoin capitalization down to $583 billion as of press time – a drop of more than 41.7% in just a few months.
The weakness began in tandem with geopolitical tensions and especially after the US administration announced its “Liberation Day Tariffs” – which shook global financial markets.
Inflows into risk assets, especially altcoins, have slowed significantly , making most of these assets extremely susceptible to liquidity shocks. The withdrawal of retail and institutional investors from assets far from the safe zone (BTC, ETH) has created a domino effect, with mid- and low-cap altcoins recording the deepest declines .
In the chart, the "Altseason" phases can be clearly observed , accompanied by a sharp increase in the 30-day and 7-day moving averages of the altcoin capitalization.
Currently, the downtrend has broken the mid-term support zone around the $600B mark – a negative technical signal that suggests the sell-off has not completely stopped.
Currently outside the "Altseason" zone , according to commonly used quantitative criteria (Alt Cap 7DMA > Alt Cap 30DMA and growing continuously).
Our advice and reviews:
Current risks remain high , especially for altcoins that do not have strong cash flows or clear real-world applications.
In the context of liquidity tightening and volatile macro, a defensive strategy with capital allocation into BTC, ETH or stablecoins is reasonable.
Long-term investors should patiently wait for clear reversal signals in Fund Flows and Institutional Rotation before returning to high beta assets like altcoins.
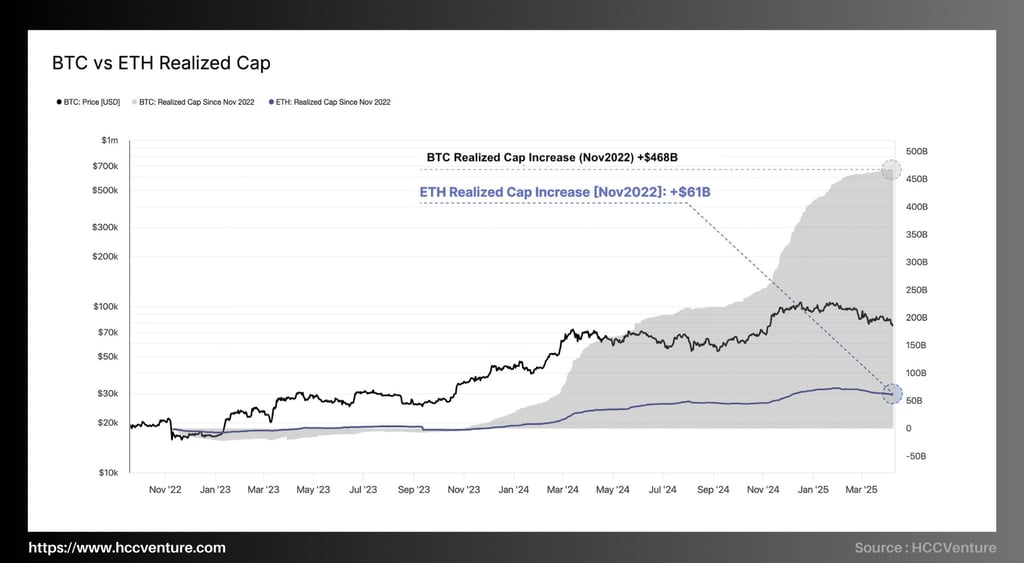
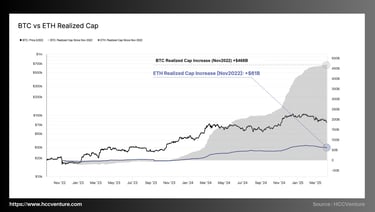
To assess the recovery and cash flow attractiveness after the FTX crash in late 2022, we use this time frame as an anchor for comparing the fluctuations of Realized Cap of Bitcoin and Ethereum. Developments and key figures:
Bitcoin (BTC):
Realized Cap from $402 billion USD → $870 billion USD.
Net increase of +$468 billion USD , equivalent to +117% .
Ethereum (ETH):
Realized Cap from $183 billion USD → $244 billion USD.
Net increase of +$61 billion USD , equivalent to +32% .
Differential Flow Attraction: While both assets have recovered strongly from the FTX crisis, Bitcoin has attracted 7.6 times more net capital than Ethereum . This reflects a stronger belief in Bitcoin from institutional investors as well as long-term investors in the current cycle.
While Bitcoin set a new all-time high (ATH) above $100,000 in December 2024 , Ethereum has yet to surpass its old ATH around $4,900 , indicating an uneven recovery cycle between the two market-leading coins.
Prioritize capital allocation to BTC at the current stage, while closely observing signals of money flow shifting to ETH such as Ethereum ETF approval, or big push from DeFi/L2 applications.
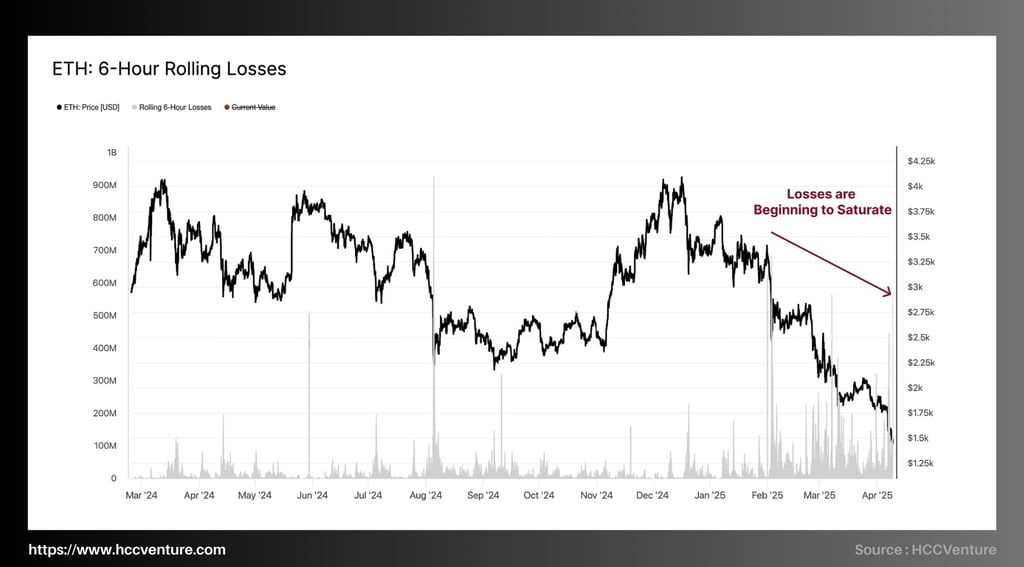
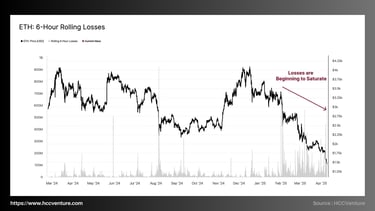
The “6-Hour Rolling Losses” indicator shows that ETH has undergone a massive liquidation , with losses peaking at $564M in the recent period.
However, this loss does not continue to increase , showing signs of saturation , investors may have become accustomed to low prices , or the number of people willing to sell at a loss is drying up.
Data shows that Ethereum has experienced significant losses during the recent price decline, with realized losses peaking at $564 million. This is one of the largest loss events since the bull market began in January 2023. This reflects strong selling pressure and investor pessimism amid market volatility.
More importantly, the trend shows that the severity of realized losses is decreasing with each successive drop. This could be interpreted as investors getting used to Ethereum prices fluctuating at lower levels and adapting to volatile market conditions. This gradual decrease could be a sign of reduced selling pressure from panicked investors, or that they are holding onto the asset longer instead of dumping immediately.
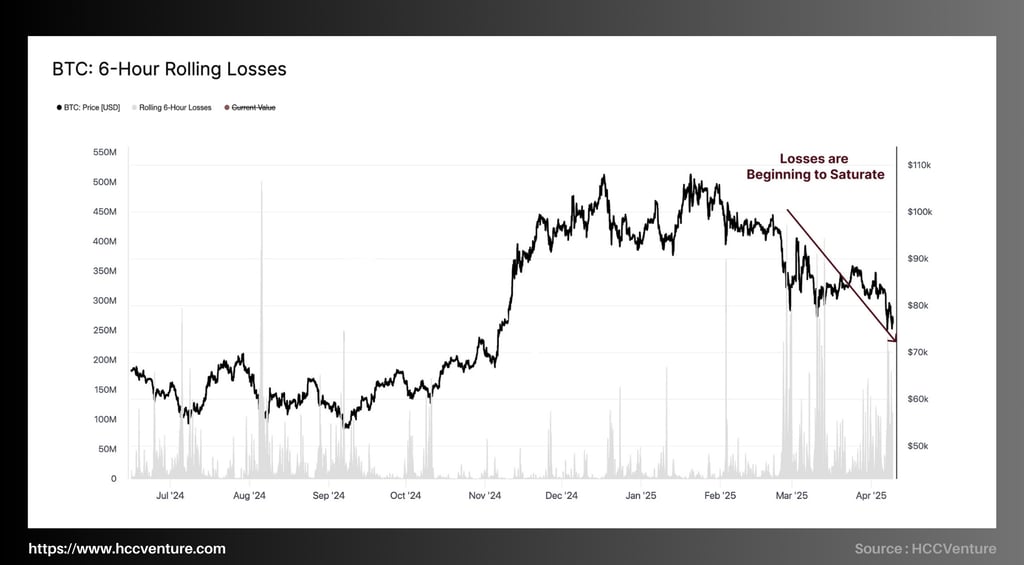
After the recent sharp decline, an important factor in assessing the market outlook is investor reaction , especially short-term tolerance and capitulation .
Bitcoin’s 6-hour rolling losses peaked at $240M in a short time frame – matching the biggest losses of the current cycle .
However, with each subsequent decline, the size of the loss is decreasing , even though the price is still falling:
This may reflect that those who were willing to sell at low prices have already sold .
It also means that a “ seller exhaustion ” zone is likely forming .
Our advice and reviews:
Market sentiment is in a highly negative phase , but this is the premise for a short-term bottom to form.
The decreasing losses (in both BTC and ETH) are a sign that selling pressure is cooling , even though the price has not recovered strongly.
If BTC maintains the $65k–$71k technical support zone, it is likely to become a solid psychological foundation for the next growth cycle.
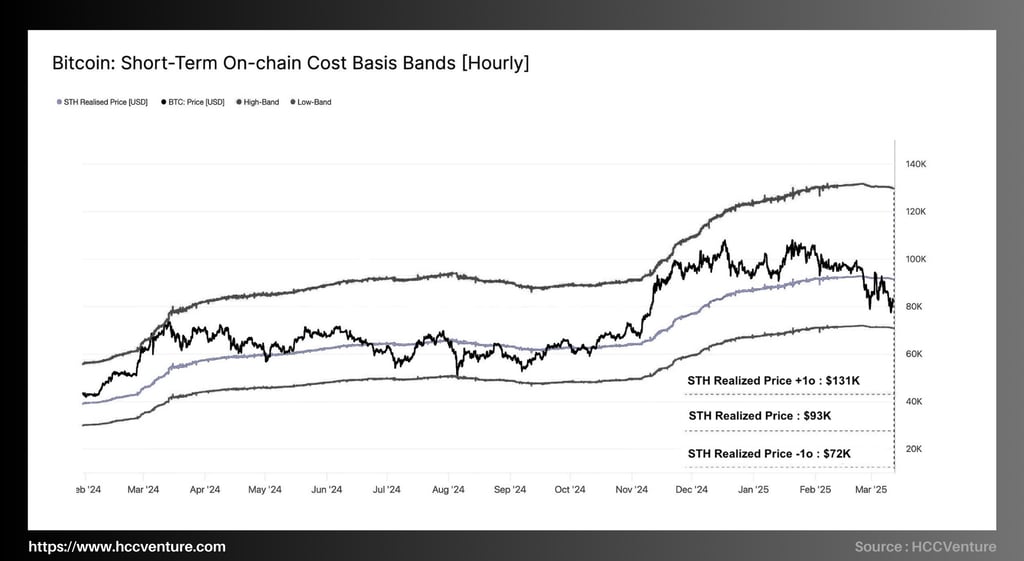
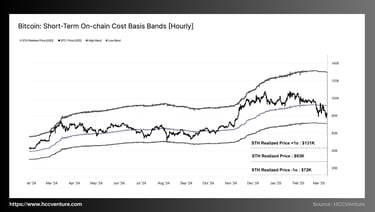
Short-Term Holders (a group of investors who tend to react quickly and are easily affected by market emotions) play a major role in the capitulations. The price is currently between the Short-Term Holder Cost Basis (STH-CB) of $93k and the -1σ lower band at $72k.
The STH Basis Price (STH-CB) is an important indicator to gauge market momentum in an uptrend. This is the average price at which STH buys Bitcoin, representing their cost basis.
Bitcoin is currently at a pivotal stage, with STH’s behavior playing a decisive role in determining its next move. Key points include:
The current trading range ($72,000 - $93,000) is defined by STH-CB and STH-CB -1σ, indicating that the market is lacking a clear direction.
STH sentiment is cautious but not yet in a state of panic, which reduces the risk of a serious capitulation event in the short term.
The $93,000 level is a key resistance level : A break above this level would signal a resumption of bullish momentum, while a drop below $72,000 could lead to stronger selling pressure.
The break below STH-CB first signaled a weakening of bullish momentum , followed by a failed recovery as price was rejected right at the STH-CB level.
This sign confirms a short-term sentiment reversal from bullish to bearish . The volume of losses is decreasing with each decline , indicating a possible sell-side exhaustion zone .
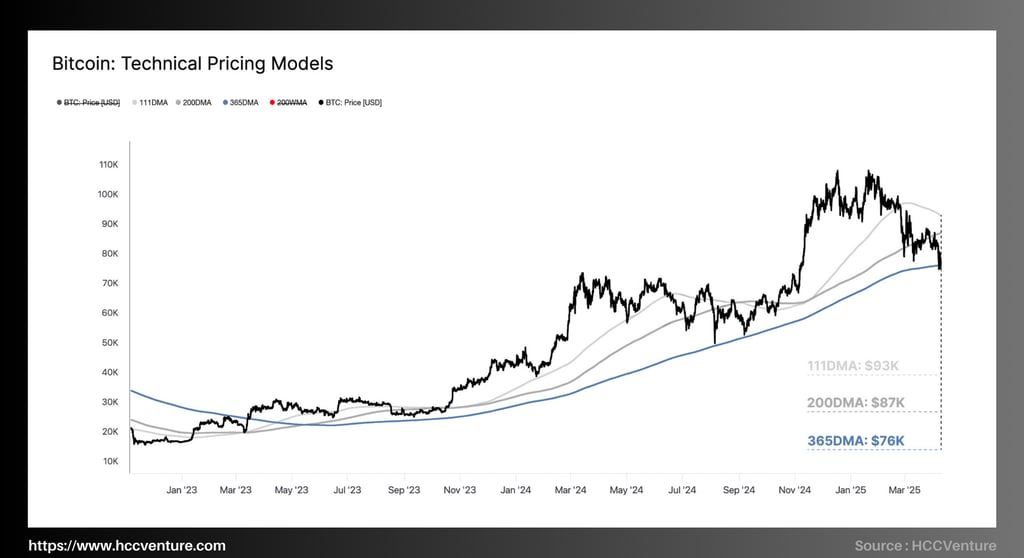
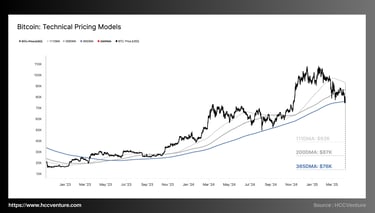
Moving averages (DMAs) are a popular technical analysis tool for assessing Bitcoin market momentum. Based on the data provided, the three main moving averages include:
111DMA : $93,000
200DMA : $87,000
365DMA : $76,000
These levels act as dynamic support and resistance levels, helping to determine whether the market is bullish or bearish. Recent price action shows a series of important events:
Price drops sharply below 111DMA ($93,000) :
Bitcoin's break below the 111DMA marks the first blow to market momentum, a short-term moving average that typically reflects trading sentiment over the past few months.
After the breakout, the market made no significant attempt to regain this level, indicating a clear weakening in investor sentiment and a shift from bullish to neutral or bearish.
Fluctuating around 200DMA ($87,000) :
After the initial sell-off, Bitcoin price hovered around the 200DMA, a level considered by many technical analysts as the boundary between bull and bear markets.
Indecision at this level, with failed recovery attempts, led to a rejection and pushed the price into another sharp decline.
This reinforces that the bullish momentum has been broken, and selling pressure from investors, especially STH, has increased.
Price drops below 365DMA ($76,000) :
Bitcoin's price breaking through the 365DMA for the first time since the 2021 cycle is a worrying sign. This long-term moving average has often acted as strong support in previous uptrends.
Currently, the $76,000 level is acting as support, but this is a fragile level. If the price fails to hold above this level, bearish momentum could be established, pushing the price to lower levels (e.g. $60,000 or lower in a bearish scenario).
The price breaking below the 111DMA ($93,000) and 200DMA ($87,000) indicates that the uptrend has been interrupted. The rejection at these levels reflects the cautious sentiment of investors, especially STH, who are under selling pressure as the price falls below their base price.
The 365DMA ($76,000) level is currently acting as support, but this is the first time since 2021 that the price has fallen below this level. If $76,000 is broken, selling pressure from STH could push the price to the $60,000 region or lower, marking a serious capitulation event.
Evaluation and Conclusion
Pressure is mounting on global financial markets, driven largely by uncertainty surrounding US tariff policy. This weakness has spread across most asset classes, with major macro indices seeing significant declines. The digital asset market is no exception, with contraction across all market segments:
Bitcoin : The price has dropped to $75,000 , marking one of the deepest corrections since the bull run began in January 2023. Currently, the price is hovering around the $72,000 - $93,000 range , with key support and resistance levels defined by moving averages (111DMA: $93,000; 200DMA: $87,000; 365DMA: $76,000) and the short-term investor base (STH Cost Basis: $93,000; STH-CB -1σ: $72,000).
Ethereum and other digital assets : Ethereum was hit harder than Bitcoin, while many longer-tail assets fell sharply, showing a divergence in the resilience of digital assets to market pressure.
The decline reflects cautious investor sentiment, especially the short-term holders (STH), who are often responsible for sell-offs during corrections. Technical and on-chain indicators suggest that the market is in a neutral state, with bullish momentum disrupted and the risk of a deeper decline if key support levels fail to hold.
Uncertainty from US tariffs and weakness in traditional markets has spilled over into the digital markets, hurting Bitcoin and other assets. The drop to $75,000 is a testament to the severity of the pressure.
STH continues to play an important role in shaping market reactions. The price fluctuating below STH-CB ($93,000) but above STH-CB -1σ ($72,000) shows that STH is in a hesitant state, not yet panicking but not confident enough to accumulate strongly.
Key Support Zone - The $65,000 - $71,000 zone is the final frontier to prevent a serious bearish scenario. Holding this zone would help maintain hopes of a long-term recovery, while a break below could push the market into a prolonged bear market.
Join the HCCVenture community to get the latest market information. Once again, we give our opinion on potential projects in the crypto market. This is not investment advice, consider your portfolio. Disclaimer: The views expressed in this article are solely those of the author and do not represent the platform in any way. This article is not intended to guide investment decisions.
API & Data : Glassnode
Compiled and analyzed by HCCVenture
Join our telegram community: HCCVenture
Explore HCCVenture group
HCCVenture © 2023. All rights reserved.


Connect with us
Popular content
Contact to us
E-mail : sp_contact@hccventure.com
Register : https://linktr.ee/holdcoincventure
Disclaimer: The information on this website is for informational purposes only and should not be considered investment advice. We are not responsible for any risks or losses arising from investment decisions based on the content here.

TERMS AND CONDITIONS • CUSTOMER PROTECTION POLICY
ANALYTICAL AND NEWS CONTENT IS COMPILED AND PROVIDED BY EXPERTS IN THE FIELD OF DIGITAL FINANCE AND BLOCKCHAIN BELONGING TO HCCVENTURE ORGANIZATION, INCLUDING OWNERSHIP OF THE CONTENT.
RESPONSIBLE FOR MANAGING ALL CONTENT AND ANALYSIS: HCCVENTURE FOUNDER - TRUONG MINH HUY
Read warnings about scams and phishing emails — REPORT A PROBLEM WITH OUR SITE.