On-chain analysis week 14/2026: Bitcoin recovers amid weakening demand
The market is in a transitional phase with a more balanced structure compared to last week, but lacks the momentum to break out of the rangebound and move into a sustainable uptrend.
4/11/202612 min read
Market Summary
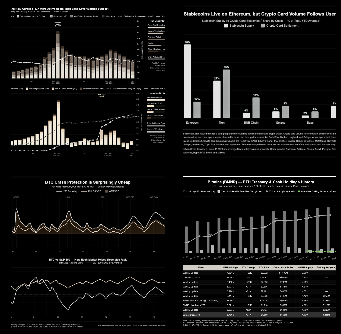
Bitcoin remains stuck in a wide range of $60,000–$70,000 , with weak spot activity and thin derivative liquidity limiting further upside. Spot trading volume remains low, as evidenced by Bitcoin's 30-day relative volume ratio still below the 1.0 baseline, reflecting insufficient organic demand to support stable prices.
Futures activity has contracted significantly, with the 30-day moving average sharply declining and trending downward, reinforcing the view that traders are withdrawing rather than re-engaging aggressively following the recent deleveraging event. Starting with implicit volatility , option prices have fallen across the entire curve, with short-term volatility returning to the lows of 40 and the 6-month option around 45% , reflecting a broad revaluation of expected volatility.
The ceasefire announcement in the Iran conflict further reduced volatility, accelerated the ongoing compression process, and indicated a more peaceful near-term environment with limited conviction and fewer participants willing to pay the price for protection or exposure convex .
Despite a decrease in overall volatility, option pricing remains relatively defensive, with skew leaning toward put and downside protection still trading at a premium to upside exposure. Shifting from pricing to actual market behavior, Bitcoin's 30-day actual volatility has fallen to 42.5% , reflecting a quieter market mode but also accompanied by reduced participation and thinner trading volume.
Bitcoin is currently in a “low-volatility equilibrium” —a state of balance characterized by low volatility, thin liquidity, and a lack of driving momentum. Compared to the lows of the previous cycle ( when realized volatility fell below 30% ), the current level is still higher, but the downward trend is clear.
Analyzing on-chain metrics

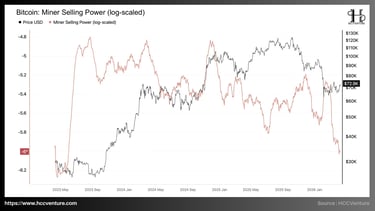
Currently, Bitcoin's price is fluctuating around $72,000 , while the Miner Selling Power index has sharply declined to historically low levels of -5.9 to -6.0 (log scale) . This is a low comparable to periods of deep accumulation before forming strong uptrends in the past, such as late 2022 – early 2023, when BTC's price was below $20,000.
In the previous cycle, particularly during 2023–2024 , whenever Miner Selling Power rose to the -5.0 to -4.8 range , the market typically recorded local price peaks. This was evident in the $40,000–$50,000 (2023) and $100,000+ (2025) price ranges , where miners tended to increase selling to realize profits and cover operating costs amidst high prices. Conversely, when this indicator fell significantly below -5.6 , selling pressure almost disappeared, allowing the market to effectively absorb supply and form a stable price base.
Currently, the index at -6 is not only significantly lower than historical peaks but also noticeably lower than previous temporary lows (around -5.8 at the end of 2025), indicating that selling pressure from miners has sharply decreased after the price broke out of the $59,000–$72,000 accumulation cluster . Compared to the previous historical low ( around -5.8 ), the current level represents a significant improvement, confirming that miners are in a position of tight control and prioritize holding coins rather than selling them to the market.
Miner Selling Power at a record low is the clearest evidence that the fundamental strength of the miner network is no longer a source of risk but has become a supporting factor, reducing selling pressure and increasing the scarcity of BTC in the spot market. The decline in Miner Selling Power means the short-term supply curve is shifting downwards , while demand – though still weak – no longer needs to absorb the large volume of selling as before. This is a factor that helps the market maintain stability even when liquidity and trading volume have not yet recovered strongly.
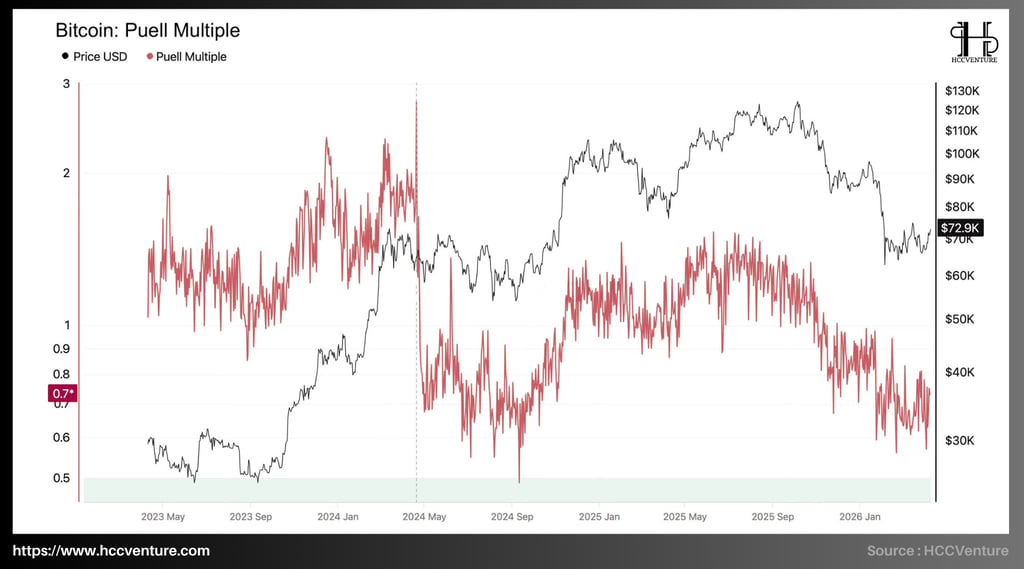
The Puell Multiple – a measure of miners' relative profitability by comparing daily mining revenue to a 365-day moving average – is at 0.7, a record low in the current cycle. The sharp and sustained decline in this indicator not only reflects the low profit pressure on miners but also confirms that the supply from miners – one of the main traditional sales sources – has been severely restricted , creating the most solid on-chain foundation for a sustainable recovery.
Historically, the Puell Multiple has peaked above 2.5–3.0 during strong bull market periods in 2024–2025, when mining revenue surged and miners aggressively sold to lock in profits. Conversely, lows below 0.8 often appear just before or during sustained rallies, when miners reduce selling and accumulate to optimize long-term profits.
Currently, the Puell Multiple at 0.7 is not only significantly lower than historical peaks but also lower than previous temporary lows ( around 0.8–0.9 by the end of 2025 ), indicating that miner profitability has decreased to a minimum after the price broke out of the $59,000–$72,000 accumulation cluster . Compared to the previous historical low ( around 0.5 during extreme stress periods in 2022 ), the current level remains undervalued but is a significant improvement over previous high-profit peaks, confirming that miners are in tight control and prioritize holding coins rather than selling them to the market.
When the Puell Multiple remains below 1.0, miners tend to reduce selling and prioritize accumulating or holding positions, as selling at low turnover levels is not optimal for long-term profitability. This aligns with additional data such as stable Miner Reserve and sharply declining Miner Selling Power , indicating that selling pressure from miners is at its lowest point in the current cycle.
The market has not yet entered an " overheated " state from the miner supply side. The fact that the Puell Multiple has not exceeded 1.5–2.0 means that the market has not yet seen a strong distribution phase from miners – a factor that usually plays a crucial role in forming the peak of a cycle. This reinforces the argument that Bitcoin is still in an extended accumulation phase after the halving, rather than entering the final distribution phase of the cycle.
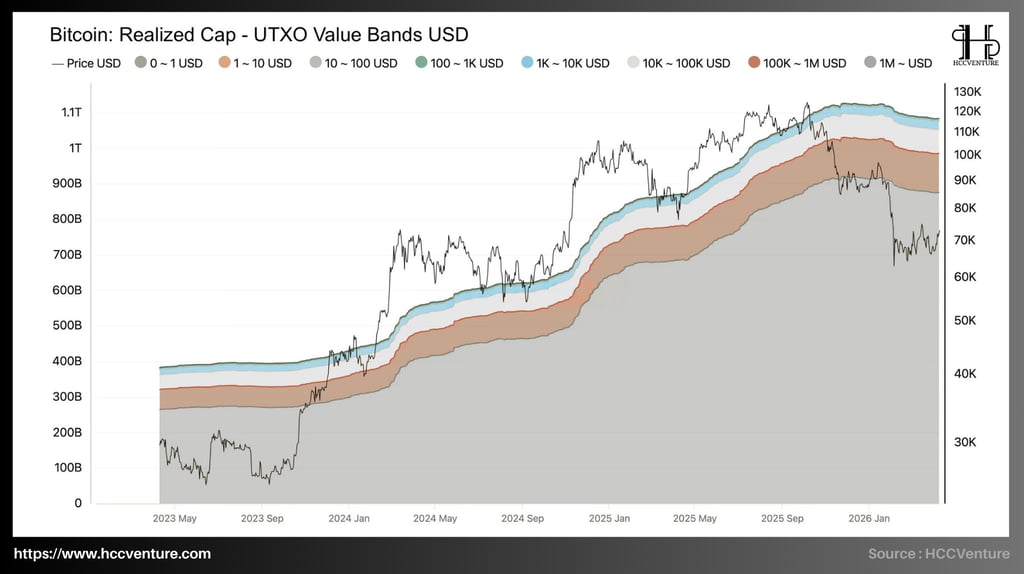
Bitcoin's realized cap is fluctuating around $1.05–$1.1 trillion USD , approaching its historical peak set in late 2025. Compared to the cycle bottom in late 2022 when the realized cap was only around $380–$400 billion USD , the actual capital size has increased nearly threefold , reflecting a strong and sustainable capital expansion cycle.
Observing the structure in detail, the UTXO group in the $10,000-$100,000 and $100,000-$1,000,000 ranges accounts for the largest proportion of the current realized capital, indicating that the majority of capital flow is controlled by medium to large-scale investors. This is typical of the post-accumulation phase, when the market has shifted from a retail-driven to an institutional-driven state.
The UTXO group with values exceeding $1 million continues to maintain a stable upward trend and has not recorded any significant declines in recent price corrections. This suggests that large-scale entities (whales, institutions, ETF custodians) are not engaging in aggressive distribution, but rather continue to hold assets at high prices.
In this context, Realized Cap and the expansion of high-value bands are the clearest evidence of the power of institutional HODLing, with supply at high prices being tightly held, reducing selling pressure and increasing the scarcity of BTC in the spot market.
Another noteworthy point is that during recent corrections, when Bitcoin's price dropped from the $110,000 region to below $70,000 , the realized cap did not show a corresponding decrease. This suggests that a large portion of BTC was not spent at lower prices, meaning there was no widespread capitulation. Instead, the UTXO structure remained stable , reflecting long-term investor confidence and the absence of systemic selling pressure.
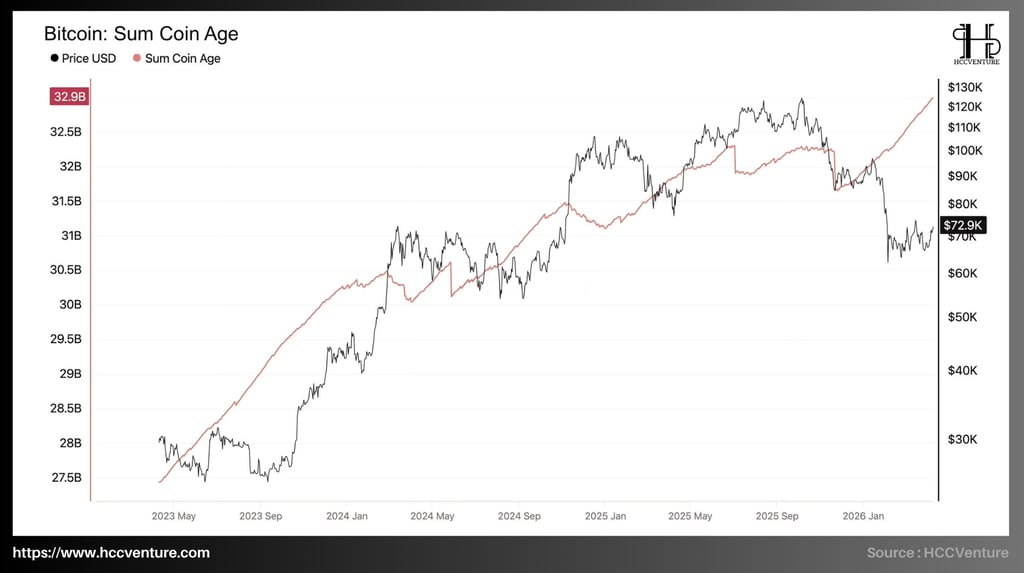
Sum Coin Age – the total accumulated age of the entire Bitcoin supply – is currently at 32.9 billion days, a record high in the cycle's history. This sustained and continuous increase not only reflects the increasingly strong long-term holding behavior of long-term holders but also directly shrinks the actual circulating supply, creating the most solid on-chain foundation for the current price recovery.
From mid-2023, the Sum Coin Age was only around 27.5 billion , corresponding to a period of cautious market conditions and a portion of the old supply still being regularly circulated. By mid-2024, the index began to accelerate significantly, surpassing the 30 billion mark and continuing to climb steadily throughout 2025, reaching its current historical peak of 32.9 billion.
Despite temporary corrections coinciding with sharp price drops, Sum Coin Age has maintained a long-term upward trend and has never fallen below $31 billion – its lowest point in recent times. Compared to its historical low of $27.5 billion in early 2023–2024, the current size of Coin Age has increased by nearly 20%, confirming that the coins are being held for longer, even as Bitcoin's price corrects from its highs to $72,900.
Compared to previous cycles, particularly the peak in 2021, the Sum Coin Age index typically experienced sharp declines during market peaks, reflecting mass distribution by long-term holders seeking to take profits. In contrast, the index continues to rise even after reaching previous historical highs.
From a market structure perspective, the continuous increase in Sum Coin Age reflects a sustainable " supply tightening " situation. As more coins are locked in long-term wallets, the actual tradable supply on the market decreases, thereby increasing the price sensitivity to new money inflows.
As more coins are locked in long-term wallets, the actual tradable supply on the market decreases, thereby increasing price sensitivity to new capital inflows. In the context of institutional capital (ETFs, investment funds) maintaining a net accumulation state, the shrinking circulating supply becomes an even more important supporting factor for price structure.
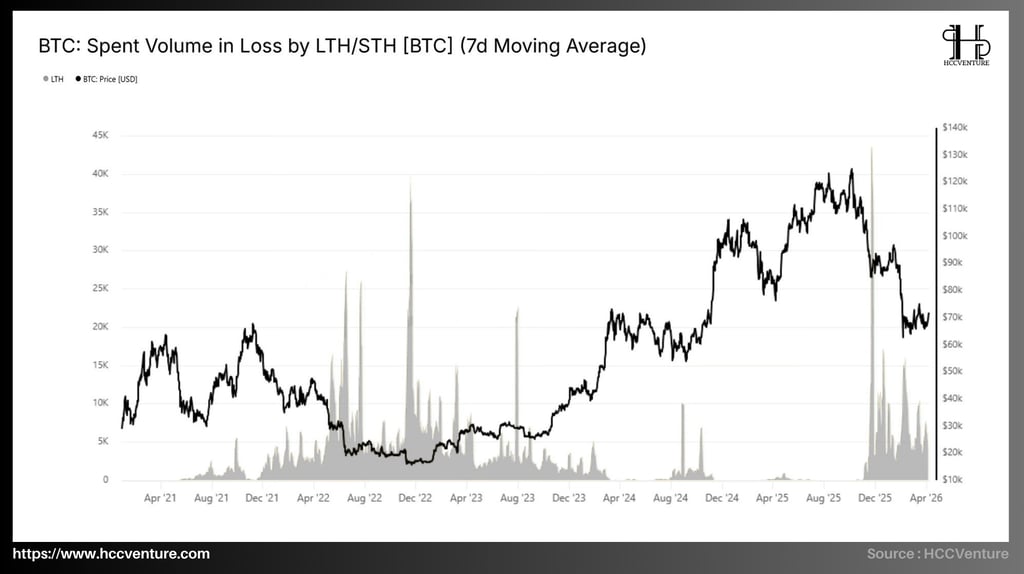
Spent Volume in Loss by LTH/STH (7d Moving Average) – the volume of BTC spent at a loss according to the 7-day moving average, differentiating between long-term and short-term holders – is providing the most important on-chain lens through which to look at actual investor behavior when faced with temporary losses. The current indicator remains at around 20,000–22,000 BTC/day , significantly lower than historical peaks, confirming that selling pressure from both LTH and STH has been tightly controlled , no longer creating a liquidation cascade, and is directly supporting genuine spot demand.
A closer look at the structure reveals that the majority of current losses are coming from Short-Term Holders , while Long-Term Holders (LTH) maintain very low loss spending levels. This is a significant difference from cyclical bottoms, where LTH were often forced to sell at a loss due to liquidity pressure or prolonged negative market sentiment. In the current context, LTH's absence from loss distribution suggests that long-term confidence remains strong.
STH's acceptance of stop-loss orders during corrections is a typical characteristic of the mid-cycle phase, where short-term capital is weeded out and positions are transferred to longer-term investors with higher conviction. This process helps restructure the market's ownership base, reducing selling pressure in subsequent phases and strengthening a more sustainable growth structure.
Currently, despite a significant price correction from its peak, the realized loss level hasn't increased proportionally , suggesting that the majority of investors are still in a profitable position or haven't been forced to sell. This aligns with Realized Cap and Sum Coin Age data, both of which indicate that supply remains tightly held and shows no signs of widespread distribution.
The Perpetual Market Directional Premium (30D-SUM) – a measure of the cumulative directional premium over 30 days for the perpetual futures market – clearly indicates that the positioning of perpetual derivatives is leaning in a controlled and stable upside direction. Large but not extreme cumulative spikes reflect a clear bullish bias in perpetual futures without falling into speculative excess, thereby directly supporting genuine spot demand and strengthening the foundation for a sustainable recovery.
Historically, the Perpetual Market Directional Premium has seen extreme positive spikes exceeding $500–600 million in mid-2021, late 2023, and at some points in mid-2025, coinciding with periods of strong bull markets where perpetual leverage fueled long positions. Conversely, deep negative zones appeared during the 2022 bear market when short bias prevailed.
Currently, the index is in a stable positive and consolidating state, significantly lower than historical peaks but noticeably higher than previous deep negative lows. Compared to historical lows (the strong negative zones of 2022), the current directional premium has improved significantly, confirming that the perpetual market is shifting from a defensive phase to a controlled upside bias, supporting short covering and institutional capital flows without creating a leveraged cascade.
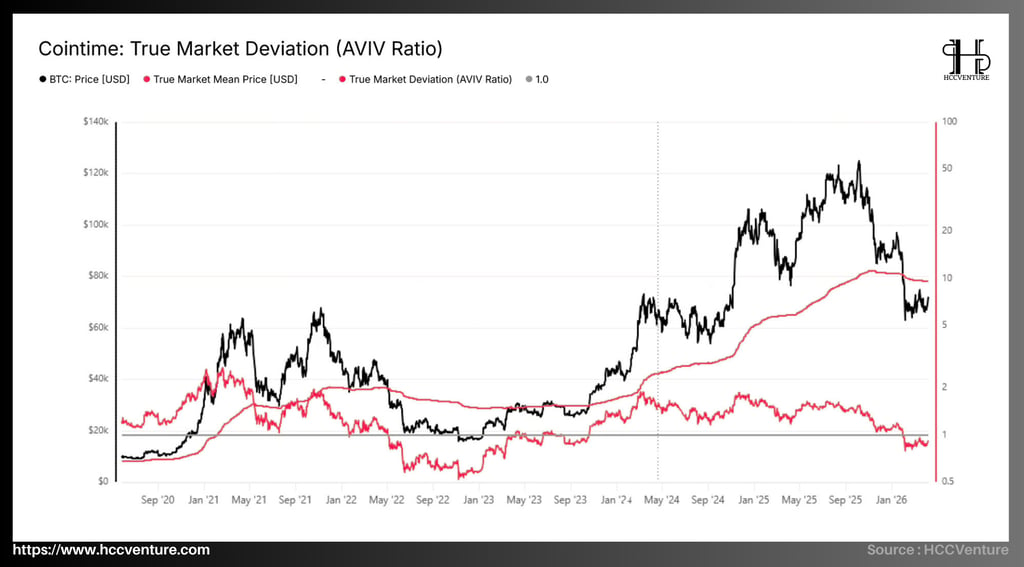
A notable point is that the slope of the True Market Mean Price line has maintained a steady upward trend throughout the recent period. This reflects that the cost of capital for long-term investors continues to improve, even as market prices undergo corrections. The divergence between falling market prices and continuously rising intrinsic value is a characteristic signal of re-accumulation phases in a growth cycle.
The AVIV Ratio falling below 1.0 primarily reflects a temporary withdrawal of short-term capital flows, while long-term capital flows remain in an accumulation phase. This aligns with other on-chain indicators such as Realized Cap and Sum Coin Age, which both show a continuous increase in the amount of "stagnant" capital within the network.
Another important factor is the stability of the AVIV Ratio in the region below 1.0. Instead of a sudden sharp decline, the index maintained narrow fluctuations, indicating a controlled and non-panic correction. This is consistent with the context of declining realized volatility and derivatives activity, reflecting a less leveraged and less systemicly risky market environment.
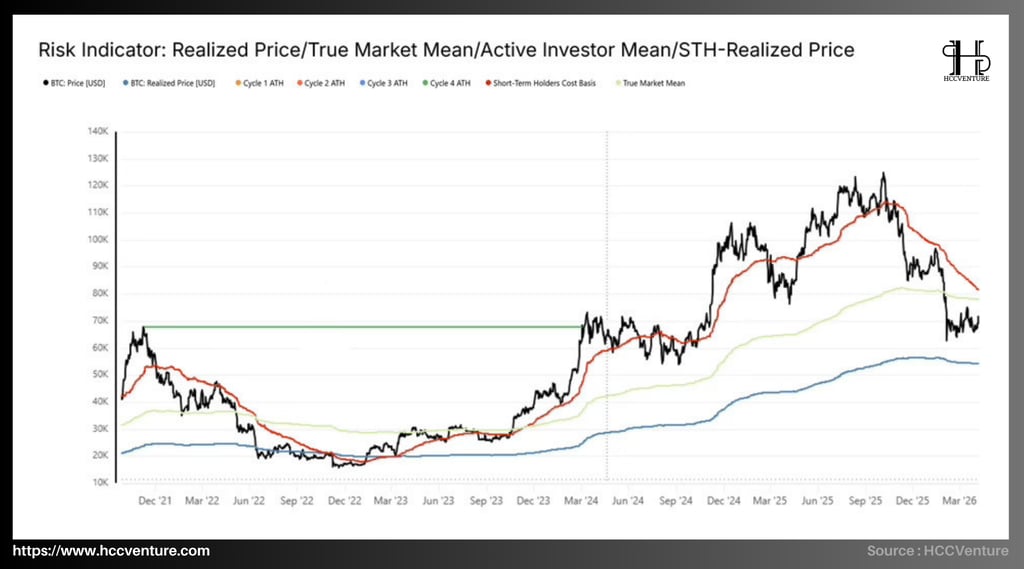
The Short-Term Holder Realized Price (STH-RP) line is currently hovering around $80,000–$85,000 , while the True Market Mean is in the $75,000–$80,000 range . Notably, the market price is trading below both of these thresholds, reflecting a situation where a large proportion of short-term investors are incurring unrealized losses. This is a cyclical signal, often appearing during medium-term corrections within an uptrend.
Meanwhile, the Active Investor Mean – representing the average cost of capital for the active investor group – remains around $55,000–$60,000 , while the overall market Realized Price is in a lower range, approximately $50,000–$55,000 . This stratified structure indicates that the network's intrinsic value system remains significantly below the current market price, even after a sharp correction. Compared to the cyclical bottom in 2022, when the market price fell below the Realized Price (~$20,000), the current state is clearly a correction within an uptrend, not a structural recession.
The Active Investor Mean and overall Realized Price are also holding in the $55,000–$60,000 range , indicating that supply bought at lower prices is still providing strong support. Compared to the historical peaks of the STH-Realized Price ( around $110,000–$120,000 by mid-2025 ), the current level is lower but still above the long-term moving average, reflecting that short-term holders have realized some profits without creating widespread selling pressure.
The fact that the price is below the STH-RP means that the majority of new investors are currently in a loss-making state, thereby reducing the incentive to sell due to the price anchoring effect and expectations of a recovery . At the same time, long-term investors – with significantly lower capital costs – are not under pressure to distribute assets, thus reducing the supply circulating in the market.
Our assessment and conclusions
Bitcoin is currently holding within the $60,000–$70,000 range , stabilizing around $72,900 after a technical bounce from the low of $67,000 . On-chain and off-chain data suggest the market has gradually emerged from its most stressful phase, with selling pressure significantly reduced and the overall structure becoming more balanced compared to last week. However, this recovery remains unconvincing, as spot demand is weak, futures activity has contracted, and market conviction is still insufficient to create a sustainable breakout from the current range.
Realized data shows that 30-day volatility has decreased to approximately 42–43% , confirming that the market environment is becoming more stable after a period of high volatility. However, this decline is not accompanied by an increase in liquidity; on the contrary, it reflects a "thin market," where marginal money flows can have a greater impact on prices.
The fact that Bitcoin's price has fallen below the Short-Term Holder Realized Price (~$80K–$85K) while remaining above long-term capital cost thresholds is a clear cyclical signal. Historically, this structure has always appeared in medium-term correction phases of bull markets, where short-term capital is withdrawn while the long-term foundation remains stable.
Indicators such as Spent Volume in Loss and the decline in Puell Multiple (~0.7–0.9) confirm that selling pressure from miners and short-term investors has significantly decreased. Simultaneously, the increase in Sum Coin Age suggests that the asset is being held for longer periods, reflecting accumulation rather than distribution behavior.
The option skew structure , skewed towards downside protection combined with low implied volatility, reflects a particular psychological state where investors are no longer panicking, but are not yet ready to accept risk. This is a transitional state between two phases: capitulation and accumulation.
However, the lack of liquidity and market participation is limiting the ability to form a sustainable uptrend. For the market to move into a structural growth phase, three factors need to converge: a strong recovery in spot demand, the return of leverage in the derivatives market, and a significant expansion of institutional capital flows .
Disclaimer: The information presented in this article is the author's personal opinion in the field of cryptocurrency. This is not financial or investment advice. All investment decisions should be based on careful consideration of your personal portfolio and risk tolerance. The views expressed in this article do not represent the official stance of the platform. We recommend that readers conduct their own research and consult with experts before making any investment decisions.
API & Data : Glassnode, Dune, CoinGecko
Compiled and analyzed by HCCVenture
Join the HCCVenture organization here: https://link3.to/holdcoincventure
Explore HCCVenture group
HCCVenture © 2023. All rights reserved.


Connect with us
Popular content
Contact to us
E-mail : sp_contact@hccventure.com
Register : https://linktr.ee/holdcoincventure
Disclaimer: The information on this website is for informational purposes only and should not be considered investment advice. We are not responsible for any risks or losses arising from investment decisions based on the content here.
TERMS AND CONDITIONS • CUSTOMER PROTECTION POLICY
ANALYTICAL AND NEWS CONTENT IS COMPILED AND PROVIDED BY EXPERTS IN THE FIELD OF DIGITAL FINANCE AND BLOCKCHAIN BELONGING TO HCCVENTURE ORGANIZATION, INCLUDING OWNERSHIP OF THE CONTENT.
RESPONSIBLE FOR MANAGING ALL CONTENT AND ANALYSIS: HCCVENTURE FOUNDER - TRUONG MINH HUY
Read warnings about scams and phishing emails — REPORT A PROBLEM WITH OUR SITE.