


On-chain analysis week 14/2025: Exhaustion signal from sellers, deep downtrend
Bitcoin’s price continued to decline over the past week, reflecting short-term bearish sentiment in the market. However, on-chain indicators are starting to show signs of seller exhaustion – often an early signal for a mid-term accumulation or recovery phase.
4/7/20257 min read
Market Summary
Bitcoin is currently fluctuating in the $76,000 – $87,000 range , representing a sideways accumulation state after a series of strong fluctuations since early 2025.
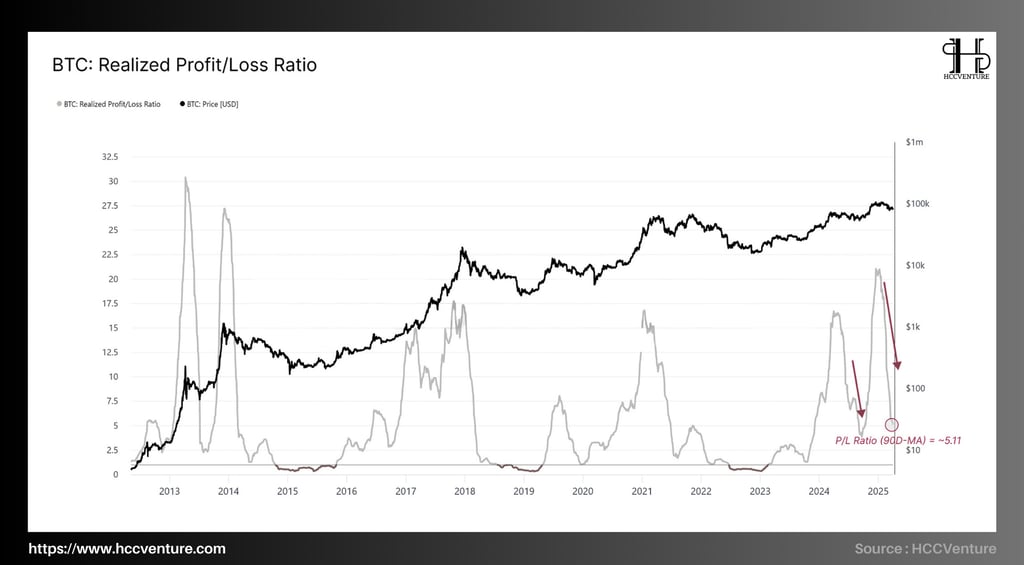
The Realized Profit/Loss Ratio indicator shows signs of short-term exhaustion from sellers , but is not yet sufficient to confirm that a sustainable uptrend has begun .
The amount of supply in a loss state remains high , around 4.7 million BTC , equivalent to nearly 25% of the total circulating supply, clearly reflecting the level of financial stress across the short-term investor ecosystem.
Activity from the group of coins that are suffering losses does not record large runs, but instead shows hesitation and tension , showing that investors are in a state of "suffering in pain" .
On-chain data shows no significant new capital inflows yet , while the presence of “Death-Cross” and high supply in losses are systemic negative signals.
On-chain metrics analysis
While the market has seen short-term rallies thanks to temporary selling exhaustion , a bigger question needs to be asked: Are these “dead cat bounces” within a broader downtrend, or an early sign of a new bull cycle?
Some investors are expecting that the $76k–$80k support zone could be the foundation for a surge to new highs.
Since early January 2025 , the Realized PnL Ratio's 90D SMA has been consistently moving down, despite a few short-term profit breakouts on the daily chart.
These short-term jumps are not enough to reverse the main downtrend – which reflects weak liquidity, declining investment cash flow and fragile profit sentiment .
This suggests that recent gains are more likely reactionary bounces rather than the start of a new bull cycle.
A technical recovery is needed to calm market sentiment, but for a sustainable breakout, institutional confidence, strong liquidity, and solid on-chain profit accumulation are needed.

The “Death Cross” pattern , when the 50-day moving average crosses below the 200-day moving average – is a clear indication of a prolonged downtrend.
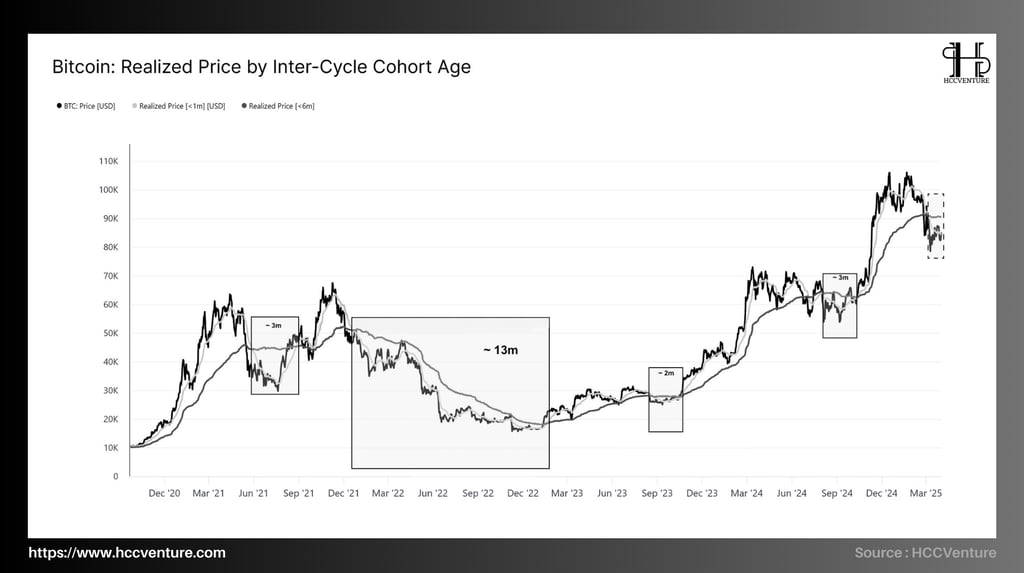
Volume-weighted average price of coins moved within 1 month , compared to coins moved within 6 months .
The 1-month on-chain price average has crossed below the 6-month line , marking an “On-Chain Death Cross” .
This is a sign that short-term buying power has weakened significantly compared to the long-term average , corresponding to a decline in investor confidence and withdrawal of capital.
In previous cycles, similar signals were often preceded by periods of weakness lasting 3–6 months , characterized by:
Low volatility , price is sideways or slightly decreasing,
On-chain transaction volume is decreasing ,
Conservative market sentiment, lack of speculative motivation .
If history repeats itself, the Bitcoin market is likely still in the process of “decompressing” growth pressure before forming a new sustainable uptrend .
After a series of signals showing weakening price momentum and shrinking returns, the current Bitcoin market is showing most of the characteristics of a typical bear market phase :
Liquidity is tight ,
Pessimism is widespread ,
Investor behavior shifts toward cutting losses and exiting positions .
In such environments, market sentiment is dominated by fear, exhaustion, and discouragement . Historically, bear market phases have often culminated in a “capitulation” event.
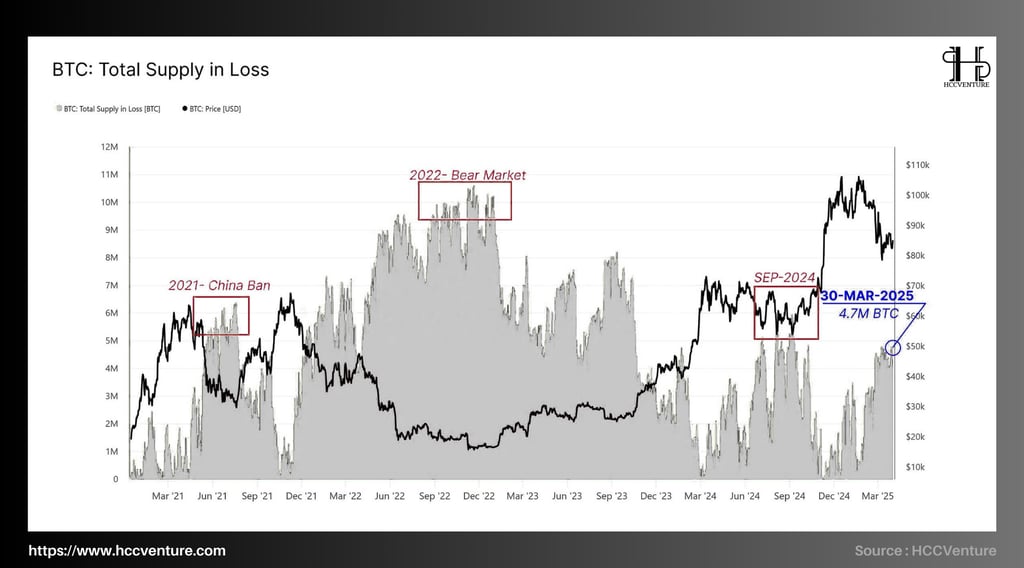
As of March 30 , approximately 4.7 million BTC were being held below cost , indicating a high level of losses .
However, this number has not yet reached the extreme levels seen in previous dark periods:
Mid 2021 (after the correction from $64k to $30k),
Bear market 2022 (price drops to $16k).
September 2024 , when the market corrects strongly due to the unraveling of the Yen-Carry-Trade strategy.
Although the bear market has not reached the “extreme collapse point” as in previous cycles , the current psychological pressure and loss level are clearly increasing , requiring investors to maintain discipline, while closely following on-chain signals for the next recovery phase.
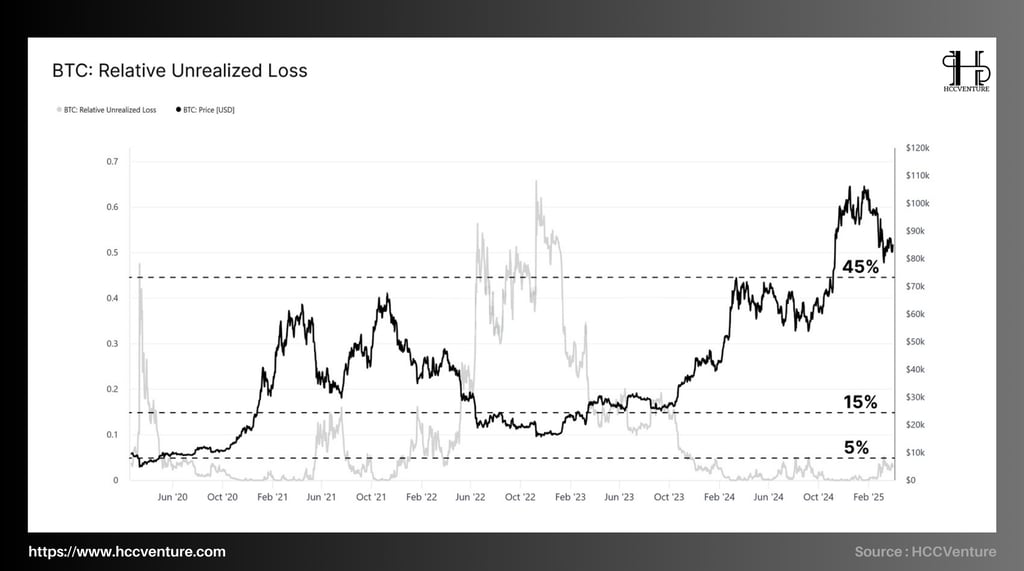
Having determined that 4.7 million BTC are being held below cost – meaning investors are in a state of loss dominance – the next step in measuring the financial stress of the market is to assess the intensity of the losses .
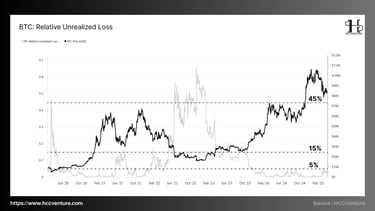
Relative Unrealized Loss is currently at 2% of total market capitalization .
This is a significantly lower figure than in previous bear market periods, such as:
End of 2018 (MVRV < 0.6).
Summer 2022 (market bottoms below $20k).
And strong correction in September 2024.
=> Thus, although the number of coins losing money is high , the loss value per coin - on average - is not too serious .
In summary , the market is currently showing a moderate level of psychological stress . A combination of:
Number of coins in large loss state (4.7M BTC),
But the loss intensity is relatively low (2% Market Cap),
shows that the market is seriously correcting , but not yet in a panic or real “capitulation” state .
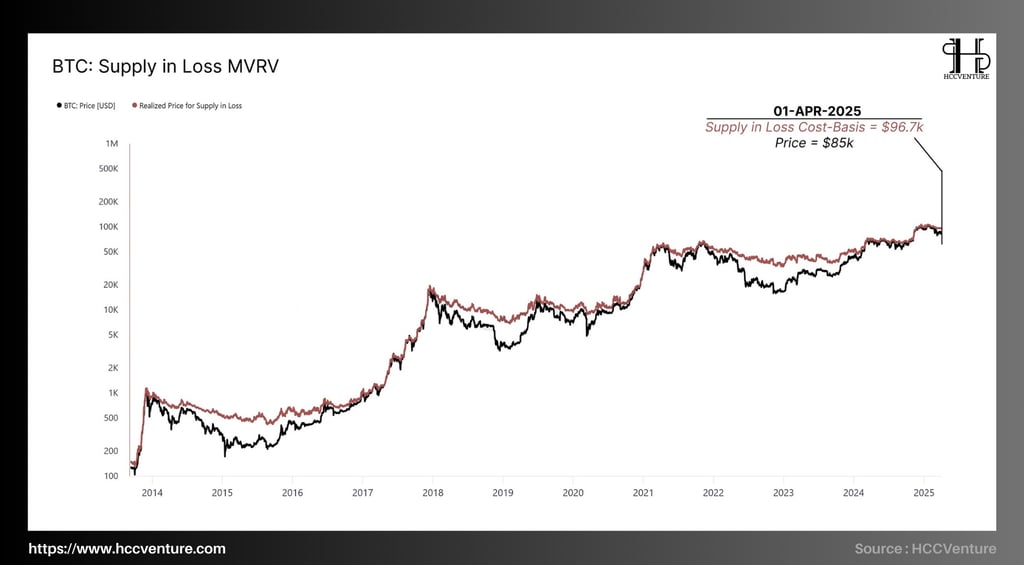
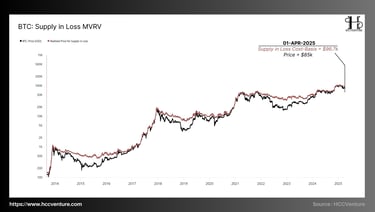
One of the key indicators to assess the level of financial loss of investors is the average cost (Realized Price) of the supply that is losing. Currently, this indicator is at:
$96,700 – this is the average price at which coins in a losing state have been bought.
Meanwhile, Bitcoin's current market price hovers around $85,000 , resulting in an average loss of around:
-12% unrealized for negative supply.
A -12% loss is not severe enough to trigger a mass sell-off, but it is enough to create potential psychological pressure in case prices continue to fall.
Investors who are holding losses may start to waver if prices fall further below the $80k–$82k range. Conversely, if the market rallies above $90k, the possibility of “break-even psychology” could trigger a wave of profit-taking at break-even.
If the price continues to fall below $83k–$80k, the loss will widen significantly, possibly pushing a part of investors into panic selling, especially the new group entering the market.
With other on-chain indicators also showing stagnant cash flows and diminishing momentum , the key factor now is the psychological resilience of investors . If new cash flows do not return soon, this patience may be further tested, especially in the absence of clear macro support.
A market that is losing but not yet in despair can be a trough of opportunity – if, and only if, investors have enough confidence to ride out the turbulence.
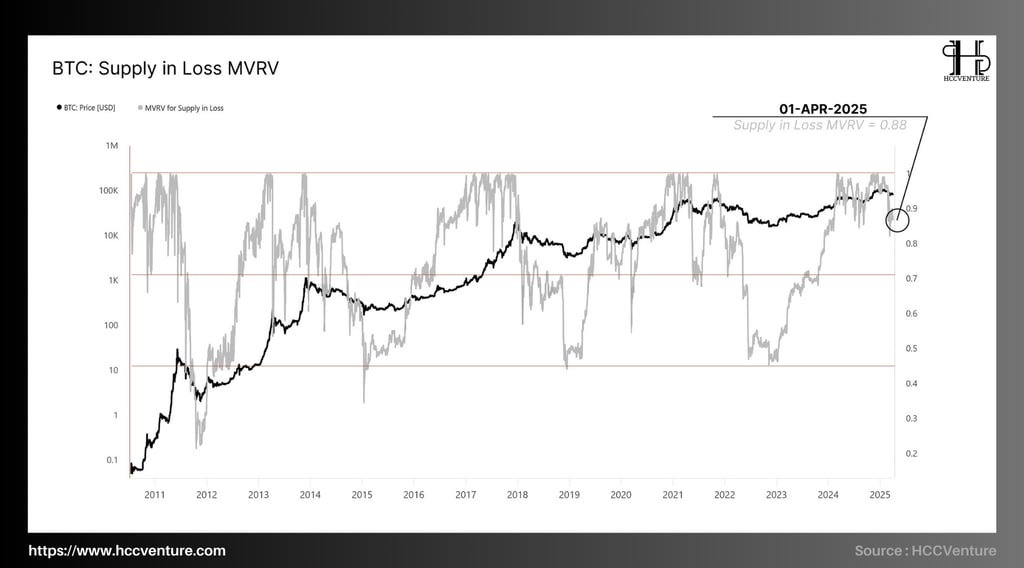
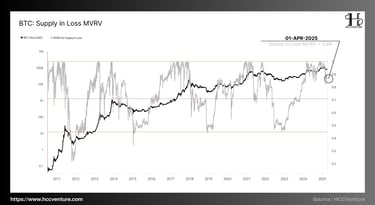
A more in-depth approach to measuring loss intensity is through the MVRV ratio of the losing supply – that is, comparing the current market price to the average cost of the coins that are in a loss state .
MVRV (Supply-in-Loss) = Current Market Price / Realized Price of Losing Coins
Present:
Realized Price (Supply-in-Loss) ≈ $96,700
Market price ≈ $85,000
⇒ MVRV (Supply-in-Loss) = 0.88
An MVRV value < 1.0 indicates that the investor is holding unrealized losses . A value of 0.88 means that, on average, each BTC in the losing portfolio is valued at 12% less than its initial cost.
This is one of the lowest levels since the beginning of this cycle , marking significant psychological pressure in the investor community, although it has not yet fallen into the "extreme" zone like the 2018 and 2022 bear cycles.
Compared to past deep declines:
During the 2018 bear market , the index reached 0.60–0.65 , reflecting panic and large-scale sell-offs.
Similarly, in June 2022 , when BTC fell below $20k, MVRV (Supply-in-Loss) also dropped sharply to nearly 0.70 .
→ Current: 0.88 shows the market is weak , but not enough to call it the final stage of despair .
“The MVRV ratio of the loss-making supply at 0.88 not only reflects the existing financial pressure , but also acts as an oscillator of investor sentiment .”
Long-term investors need to be patient and avoid emotional reactions in low MVRV areas. Meanwhile, short-term investors should closely monitor reversal signals from MVRV, as this could be an early indicator of recovery if a steady recovery above 1.0 occurs.
Evaluation and Conclusion
After hitting a historic high of $109,000 , the Bitcoin market is currently in a structural correction. The price has stabilized above the strong support zone of $76,000–$80,000 , however on-chain momentum indicators continue to send negative signals:
The Realized P/L Ratio has reached a level that signals the exhaustion of short-term selling pressure , but there is no sign of a sustainable uptrend returning.
The MVRV of losing coins dropped to 0.88 , indicating significant financial stress , but not yet reaching the desperate levels of the 2018 and 2022 recession cycles.
An “On-chain Death Cross” appears, where the 1-month average price cuts below the 6-month average price, implying the downtrend could last another 3–6 months .
Tight liquidity , declining profits, and widespread negative market sentiment are creating conditions typical of a medium-term correction cycle .
However, with MVRV relatively higher than in previous severe bear cycles , there is no sign that investors have fallen into a state of desperate selling .
The supply structure is still firmly held by long-term investors , especially the group that has accumulated from the $100,000 price zone is still persistently holding, creating a positive foundation for the long term.
“Bitcoin is in a deep and prolonged correction, but has not yet reached the level of despair to call it a complete bear market.”
Join the HCCVenture community to get the latest market information. Once again, we give our opinion on potential projects in the crypto market. This is not investment advice, consider your portfolio. Disclaimer: The views expressed in this article are solely those of the author and do not represent the platform in any way. This article is not intended to guide investment decisions.
API & Data : Glassnode
Compiled and analyzed by HCCVenture
Join our telegram community: HCCVenture
Explore HCCVenture group
HCCVenture © 2023. All rights reserved.


Connect with us
Popular content
Contact to us
E-mail : sp_contact@hccventure.com
Register : https://linktr.ee/holdcoincventure
Disclaimer: The information on this website is for informational purposes only and should not be considered investment advice. We are not responsible for any risks or losses arising from investment decisions based on the content here.
TERMS AND CONDITIONS • CUSTOMER PROTECTION POLICY
ANALYTICAL AND NEWS CONTENT IS COMPILED AND PROVIDED BY EXPERTS IN THE FIELD OF DIGITAL FINANCE AND BLOCKCHAIN BELONGING TO HCCVENTURE ORGANIZATION, INCLUDING OWNERSHIP OF THE CONTENT.
RESPONSIBLE FOR MANAGING ALL CONTENT AND ANALYSIS: HCCVENTURE FOUNDER - TRUONG MINH HUY
Read warnings about scams and phishing emails — REPORT A PROBLEM WITH OUR SITE.