On-chain analysis week 13/2026: Is the Ethereum network becoming active again?
Ethereum is currently in a structural reaccumulation phase, where intrinsic value continues to be strengthened through network growth and a shrinking circulating supply.
4/4/202612 min read
Market Summary
The Ethereum market is currently showing a clear decline in speculative capital flows and derivative activity. Open Interest on the CME has fallen sharply from its peak of approximately $120–150 million to around $30–40 million, while the Fund Market Premium remains around neutral to slightly negative levels, confirming the withdrawal of institutional capital and a weakening in indirect investment demand.
The SOPR remained below the 1 threshold (around 0.97–0.99), reflecting a market state where trading was in a zone of slight losses, characteristic of a post-distribution phase. However, the fact that the SOPR did not fall deeply to extreme levels like in 2022 suggests that selling pressure was under control and not panic-inducing.
The amount of ETH on exchanges has fallen to a historical low (~14.8 million ETH), while the total amount of ETH staked has increased to an all-time high (~38.7 million ETH), equivalent to more than 30% of the total supply. This has led to a sharp decline in the liquid supply and an increase in the illiquid supply.
Simultaneously, the number of new addresses remains high (~180,000–220,000 addresses/day), after peaking at ~450,000 addresses/day in 2025, indicating that the user expansion rate is not slowing down with price increases. Alongside this, Total Gas Used remains at a record high (~210–220 billion gas/day), reflecting continued growth in actual network usage.
Aggressive HODLing by investors, moving large amounts of ETH from exchanges to cold wallets and staking. Simultaneously, Total Value Staked reached a new record of 38.7 million ETH, an increase of nearly 38% from the low of 28 million ETH at the beginning of 2024, confirming that the Proof-of-Stake mechanism is increasingly attracting long-term capital flows and reducing the actual circulating supply.
Analyzing on-chain metrics
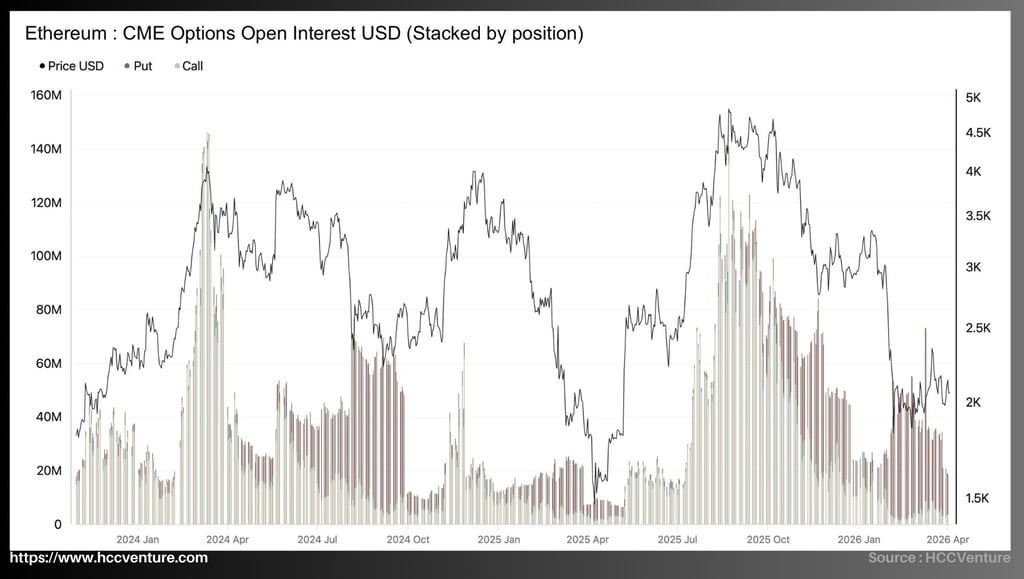
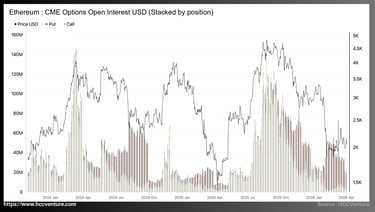
Ethereum has stabilized firmly after a sharp correction, with the price currently trading around $2,200–$2,500 , and on-chain data from the CME options market clearly reflects a more balanced market environment where the demand for hedging downside has decreased significantly and option positioning is no longer extremely skewed. Observing the stacked bar structure reveals:
During the peak periods (Q1/2024, Q3/2025), call options clearly dominated , reflecting expectations of strong price increases.
Conversely, at present, the proportion of Put options has increased relatively , despite low overall Open Interest, reflecting a trend towards risk hedging rather than speculation.
Throughout 2024–2025, CME options open interest reached extreme peaks, with total open interest exceeding $140–150 million by mid-2024 and at some points towards the end of 2025, with put open interest accounting for a large proportion during stress periods (especially Q2/2025 and Q4/2025) as investors aggressively hedging downside amid fears of price corrections.
Call OI also recorded strong spikes during periods of sharp price increases, reflecting a temporary bullish positioning. Conversely, current OI levels have fallen sharply, with both Put and Call options significantly lower than their historical peaks, and total OI now only around $40–60 million – 60–70% lower than previous peaks.
Compared to its historical low (around $10–20 million during periods of low liquidity in early 2024), the current open interest (OI) is higher but still within the "reduced hedging demand" range, confirming that investors are no longer aggressively buying hedging options as before, and that market sentiment has shifted from extreme defensive to more balanced.
From a market structure perspective, the sharp decline in Open Interest on the CME not only reflects position closing but also indicates that institutional capital is withdrawing from the ETH options market . This has led to a significant decrease in leverage , reducing short-term volatility and shifting market sentiment towards a defensive stance , as evidenced by the relative increase in Put options. This is typical of a market after a distribution phase, where speculative positions have been released and large capital flows are temporarily observing from the sidelines.
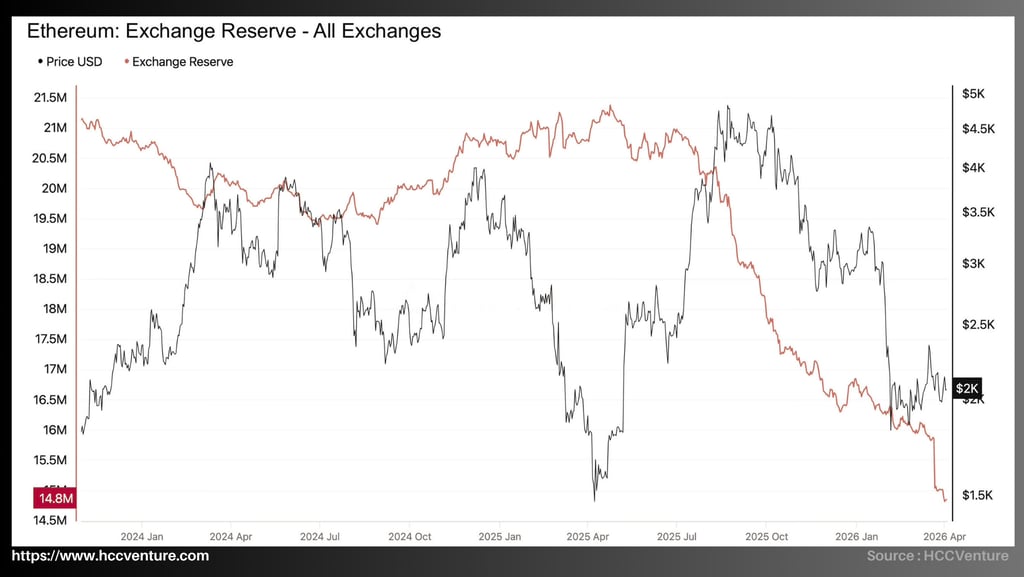
Exchange Reserve – All Exchanges from HCCVenture provides the most accurate and visual picture of this movement, with the red line representing the total amount of Ethereum held on exchanges ( Exchange Reserve ) and the Ethereum price line (black) directly compared from the beginning of 2024 to March 2026. The Exchange Reserve index has now fallen to a record low of 14.8 million ETH , significantly lower than any previous low, confirming that the supply on spot exchanges has shrunk sharply, eliminating potential selling pressure and creating a solid foundation for real spot demand to drive the market. Quantitatively speaking:
Peak Exchange Reserve: ~21.2 million ETH (Q1/2025)
Current value: ~14.8 million ETH (Q1/2026)
Absolute decrease: ~6.4 million ETH
Reduction rate: ~30%
In early 2024 , the amount of ETH on exchanges remained high, around 20.5–21 million ETH , while the price of ETH fluctuated in the $1,600–$2,500 range . This was a period of market accumulation, with a relatively large supply available for trading. From mid -2024 to early 2025 , Exchange Reserves continued to maintain a sideways trend and even slightly increased, peaking at approximately 21.2 million ETH . However, it is noteworthy that during this same period, the price of ETH surged to the $4,000–$5,000 range , indicating strong market demand absorption of the available supply on exchanges.
From Q3/2025 onwards , the market structure changed significantly as the amount of ETH on exchanges began to decrease sharply and continuously, from around 20 million ETH to the current around 14.8 million ETH . This is one of the strongest net outflows in Ethereum history, reflecting a trend of asset movement away from exchanges.
Typically, during deep downturns, the amount of assets on exchanges tends to increase due to increased selling pressure. However, current data suggests the opposite: the supply of liquidity on exchanges continues to shrink even as prices fall sharply . Reflecting a long-term accumulation market structure, where investors prioritize withdrawing ETH to cold wallets or staking, the actual selling pressure on exchanges has decreased significantly, and the liquidity available for spot trading has narrowed.
The more than 30% drop in ETH holdings on exchanges not only reflects asset withdrawals but also indicates a clear shift towards long-term holdings such as staking and cold wallet storage. This significantly reduces immediate selling pressure and reshapes the market's supply structure.
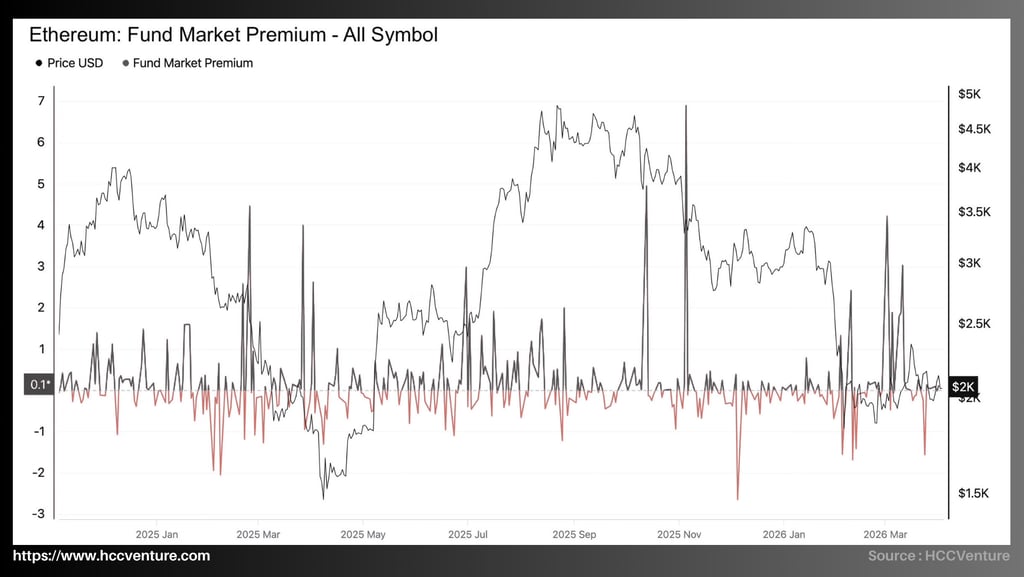
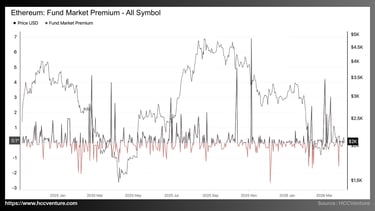
The Fund Market Premium – All Symbol is returning close to zero, clearly reflecting that institutional funds are trading close to their underlying net asset value. There are no longer high premiums like during euphoria or deep discounts like during previous panics, confirming that institutional positioning is in its most balanced and healthy state in the current cycle.
Throughout 2025, the Fund Market Premium reached extreme peaks of up to 7 points during periods of strong bull markets, particularly in mid-2025 when Ethereum's price hit the $4,000–$5,000 range, reflecting excessive institutional demand and capital inflows far exceeding the underlying value. Deep negative spikes down to -3 also occurred sporadically during sharp corrections, typically in Q2 2025 and the end of 2025, corresponding to temporary discount periods when the market experienced stress.
Conversely, the current level near 0.1 – significantly lower than the historical peaks of 7 and noticeably higher than previous deep negative lows – suggests that funds are no longer being driven by institutional FOMO nor falling into a state of panic selling. Compared to the historical low of the premium (deep negative -3), the current index has improved significantly, confirming that institutional demand is being sustained without excessive price distortion.
The stability of the Fund Market Premium near this neutral level is entirely consistent with the overall on-chain picture of Ethereum, as confirmed by previous analyses. Exchange reserves across all exchanges hit a record low of 14.8 million ETH – a drop of over 30% from its historical peak of over 21 million ETH – reflecting the maximum shrinking of spot supply.
Currently, although Ethereum's price is in the $2,200 range after a rebound from lower levels, the premium remains close to zero without creating a new spike. This is a significant difference from previous instances where the premium typically fluctuated sharply before a market shift, confirming that institutional positioning is highly stable, unaffected by short-term volatility, and ready to support liquidity when spot capital flows return more strongly.
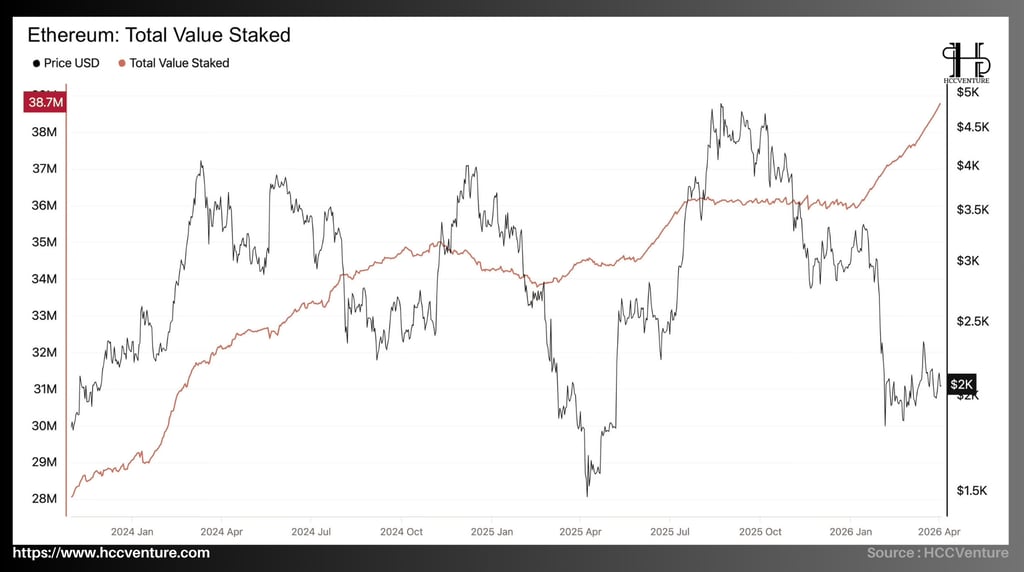
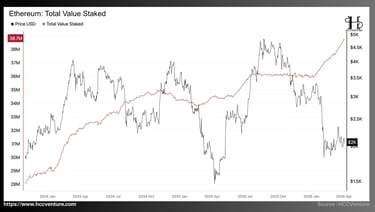
The sustained and continuous increase in Total Value Staken not only reflects investors' increasingly strong long-term confidence in the Proof-of-Stake mechanism but also directly narrows the circulating supply, creating the most solid on-chain foundation for the current price recovery. As of now (Q1/2026), the total amount of ETH staked has reached approximately 38.7 million ETH , equivalent to over 31% of the total circulating supply . This is the highest level in Ethereum's entire history, far exceeding the approximately 28 million ETH at the beginning of 2024.
The number of active validators has exceeded 1.2 million , while ETH staking through liquid staking protocols (especially Lido) accounts for over 30% of the total staking , demonstrating strong participation from both individual and institutional investors. Considering these key milestones:
Low at the beginning of the cycle (2024): ~28 million ETH
Average 2025: ~34–36 million ETH
Current level: ~38.7 million ETH (ATH)
Despite temporary fluctuations during sharp price corrections (especially in early 2025), Total Value Staked has maintained a long-term upward trend and has never fallen back below 34 million ETH – the lowest level in recent times. This confirms that investors not only hold but also actively stake more ETH through each period of volatility, even when the price dropped from the high of $4,000–$5,000 to $2,000.
In this context, the record-breaking Total Value Staked is the clearest evidence of the power of long-term confidence, with the amount of ETH locked in staking not only increasing but also continuously setting records, reducing the actual circulating supply and enhancing the scarcity of the asset, directly supporting real spot demand and institutional accumulation.
Staking surges typically coincide with periods of price stabilization or recovery, while the current record increase is occurring right in the midst of a price correction to $2,000 – a stark contrast to previous drawdowns where staking usually stalled or temporarily declined. Ethereum's Total Value Staked Index is currently setting an all-time high at 38.7 million ETH , up over 38% from the start of the 2024 cycle. This sustained growth trend is occurring despite sharp price corrections, reflecting a clear long-term accumulation market structure.
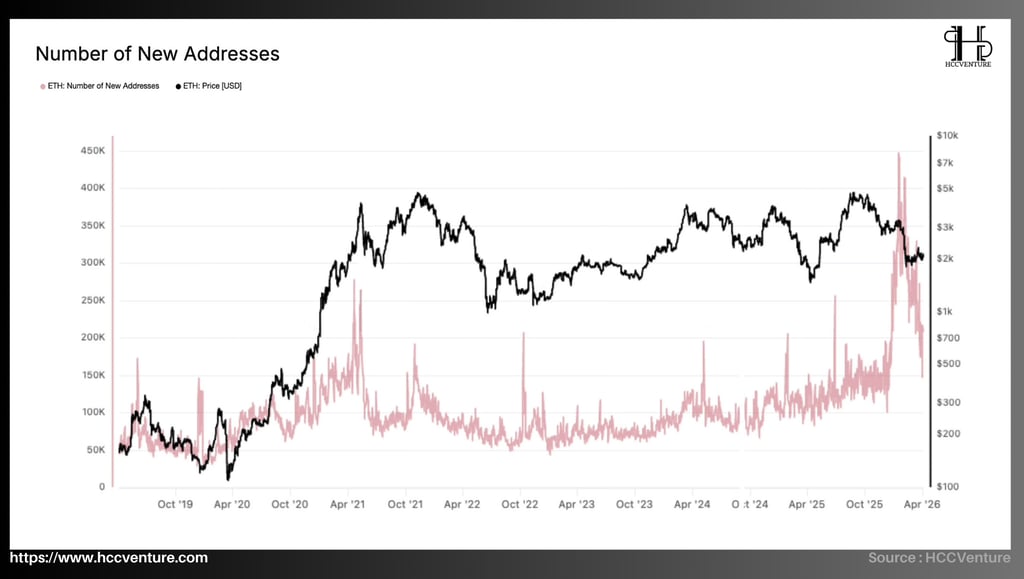
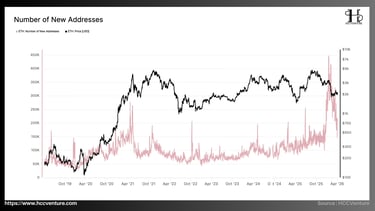
The Number of New Addresses – the number of new addresses created on the network – clearly reflects the dramatic increase in on-chain activity and user adoption, currently at record highs, with recent spikes exceeding 400,000–450,000 addresses/day, reflecting the widespread participation of new users in the Ethereum ecosystem and directly supporting real spot demand during the current recovery phase.
Historically, the Number of New Addresses cycle reached extreme peaks in 2021 with spikes exceeding 350,000–400,000 addresses per day during a strong bull market, coinciding with the boom in DeFi and NFTs. The bear market phases of 2022–2023 recorded the lowest levels at around 50,000–100,000 addresses per day, reflecting a decline in activity and user confidence.
Conversely, the current level, with continuous spikes exceeding 400,000 addresses/day – significantly higher than any historical low and only slightly lower than the 2021 peak – suggests that the Ethereum network is attracting new users on an unprecedented scale since the peak of the previous cycle.
The historically high number of new addresses is the clearest evidence of the network's vitality; new users are joining strongly, creating real on-chain demand and increasing ETH scarcity through staking and spot trading, directly supporting institutional accumulation and price recovery.
High spikes in new addresses typically coincide with periods of price stabilization or sustained recovery, while the current record surge is occurring right in the midst of a price correction to $2,000 – a stark contrast to previous drawdowns where the number of new addresses usually stalled or declined sharply.
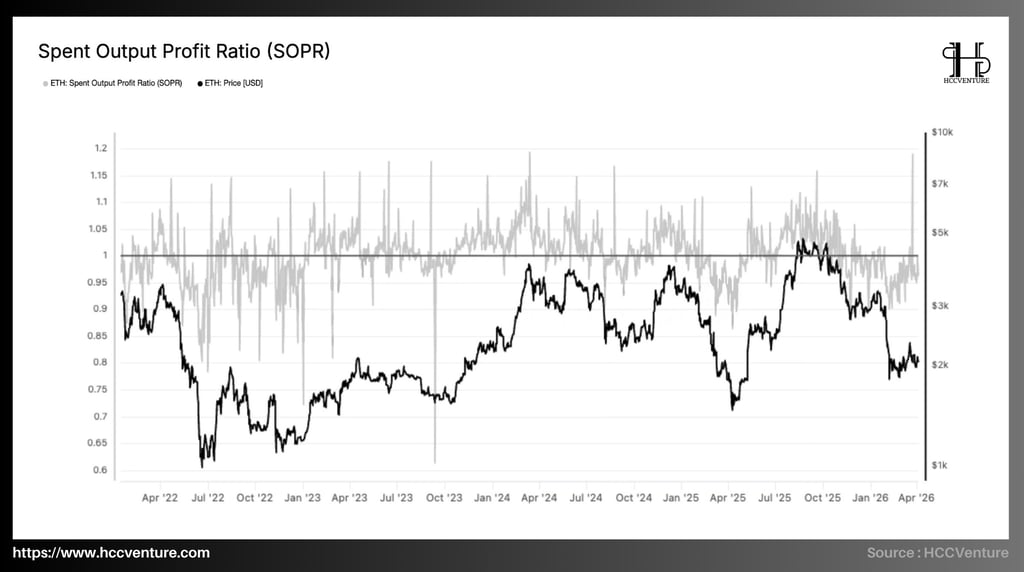
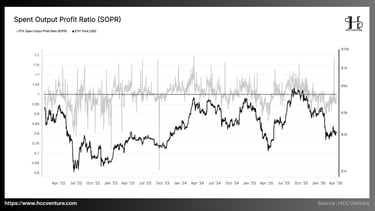
The current SOPR remains at around 0.8, well within control and significantly higher than historical lows, confirming that on-chain transactions are occurring with orderly realized losses rather than panic selling, thereby directly supporting genuine spot demand and strengthening the foundation for a sustainable recovery.
Historically, the SOPR has fallen to an extreme level of 0.6 in mid-2022 – a period of deep bear market and clear capitulation as most supply fell into a state of significant losses. Spikes above 1.15–1.2 also frequently appear during strong bull market phases in 2024–2025, reflecting strong profit-taking by short-term holders on price momentum.
Currently, the SOPR at 0.8 is not only significantly higher than the historical low of 0.6 but also noticeably lower than previous extreme profit peaks, indicating that the market is in a controlled de-risking phase: sellers are accepting temporary losses to rebalance their positions but are not creating a widespread liquidation cascade. Compared to the historical low of 0.6 in 2022, the current SOPR has improved by nearly 33%, confirming that the pressure of realized losses has been effectively absorbed and is no longer at the dangerous levels of previous stress periods.
In this context, the SOPR remaining at 0.8 is the clearest evidence of orderly profit-taking/loss-taking by investors. Realized losses exist but are tightly controlled, not creating widespread selling pressure on the spot market and instead creating opportunities for genuine demand from new buyers to enter the market.
Ethereum's SOPR (Sold Per Precipitator) currently remains below the equilibrium level of 1, fluctuating around 0.97 – 0.99 , reflecting slight selling pressure in the market after a sharp correction from the cycle peak. Compared to the 2022 capitulation period, the current level indicates a significant reduction in selling pressure. The fact that the SOPR has not fallen further but has stabilized near 1 is an important signal, suggesting that the market has moved past the distribution phase and is now in a state of supply-demand rebalancing.

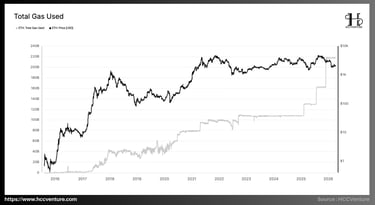
Currently (Q1/2026), Ethereum's total gas consumption remains around 210–220 billion gas/day , setting an all-time high. This is significantly higher than in 2021 (~180–200 billion gas/day) and many times higher than the pre-DeFi period (2018–2019).
During the 2020–2021 DeFi cycle , this indicator surged to the 100–180 billion gas/day range , coinciding with the explosion of decentralized finance protocols and NFTs. This marked the first time Ethereum reached such widespread high usage. However, it's noteworthy that in 2022–2023 , when the market entered a downturn, Total Gas Used did not decrease proportionally but remained stable around 90–110 billion gas/day . This indicates that the actual usage of the network was not significantly affected by price fluctuations.
By 2024–2026 , this index will continue to grow and set new highs around 200–220 billion gas/day , reflecting the strong expansion of the ecosystem, especially from:
Layer 2 scaling solutions
Stablecoin settlements
Real-world asset (RWA) tokenization
Next-generation DeFi
The record-high Total Gas Used level has significant implications, as Ethereum's actual usage demand is at an all-time high , the network's intrinsic value continues to solidify despite price cycles , and the ecosystem is shifting from speculation to practical application.
Ethereum's Total Gas Used index is currently maintaining a record high of 210–220 billion gas/day , reflecting strong and structured growth in network activity. Compared to previous cycles, current usage is not only higher but also more stable, indicating a mature application platform.
The combination of increasing gas usage, expanding user base, and decreasing circulating supply creates a market structure characterized by clear long-term value accumulation, reinforcing Ethereum's role as a core digital financial infrastructure within the global blockchain ecosystem.
Our assessment and conclusions
Ethereum is no longer primarily priced by narrative or short-term expectations, but has shifted to a state driven by quantitative fundamental variables . The supply structure is tightening . As the amount of ETH on exchanges decreases and staking increases, the market loses the flexible supply to respond to demand shocks. This increases the sensitivity of price to new capital inflows, while reducing systemic selling pressure.
Unlike previous cycles where network activity declined sharply as prices fell, Ethereum is currently still recording peak gas usage and user growth. This indicates that the ecosystem has reached a mature stage where demand is no longer dependent on speculation. The financial market has been "cleaned" of excess leverage . The sharp decrease in open interest (OI) and the disappearance of premiums show that speculative positions have been eliminated, making the market more stable and less influenced by short-term volatility.
From a quantitative analysis and market economics perspective, Ethereum is currently at a pivotal stage of its cycle, where key variables converge in a single direction: structural accumulation and a reshaping of the supply-demand balance . The sharp decline in liquidity supply while network activity peaks creates a long-term "contracting supply - expanding demand" state. Simultaneously, the weakening of speculative capital flows is not a negative sign, but rather a necessary condition for establishing a more sustainable price base.
In the near future, Ethereum has the prospect of a sustainable recovery if spot volume and ETF inflows maintain their upward momentum. With supply cleared on the URPD, SOPR control, and record staking, any increase in liquidity will convincingly push the price above technical resistance. The immediate target is the $2,800–$3,000 range, where the realized price of short-term cohorts will be tested and long-term confidence continues to strengthen. The main risk now comes only from general macroeconomic volatility, but the current on-chain platform is strong enough for Ethereum to overcome challenges and assert its leading position in the decentralized finance ecosystem.
Disclaimer: The information presented in this article is the author's personal opinion in the field of cryptocurrency. This is not financial or investment advice. All investment decisions should be based on careful consideration of your personal portfolio and risk tolerance. The views expressed in this article do not represent the official stance of the platform. We recommend that readers conduct their own research and consult with experts before making any investment decisions.
API & Data : Glassnode, Dune, CoinGecko
Compiled and analyzed by HCCVenture
Join the HCCVenture organization here: https://link3.to/holdcoincventure
Explore HCCVenture group
HCCVenture © 2023. All rights reserved.


Connect with us
Popular content
Contact to us
E-mail : sp_contact@hccventure.com
Register : https://linktr.ee/holdcoincventure
Disclaimer: The information on this website is for informational purposes only and should not be considered investment advice. We are not responsible for any risks or losses arising from investment decisions based on the content here.
TERMS AND CONDITIONS • CUSTOMER PROTECTION POLICY
ANALYTICAL AND NEWS CONTENT IS COMPILED AND PROVIDED BY EXPERTS IN THE FIELD OF DIGITAL FINANCE AND BLOCKCHAIN BELONGING TO HCCVENTURE ORGANIZATION, INCLUDING OWNERSHIP OF THE CONTENT.
RESPONSIBLE FOR MANAGING ALL CONTENT AND ANALYSIS: HCCVENTURE FOUNDER - TRUONG MINH HUY
Read warnings about scams and phishing emails — REPORT A PROBLEM WITH OUR SITE.