


On-chain analysis week 13/2025: Market volume decreases, LTH withdraws?
The digital asset market continues to face challenging conditions, especially for Short-Term Holders (STHs)—short-term investors who are under increasing financial pressure. Bitcoin’s price has fallen from a high of $97K to $82K, causing many STHs to fall into a holding loss position. Meanwhile, Short-Term Holder Realized Loss has increased sharply, reflecting the increasing level of short-term investors cutting their losses.
3/30/202510 min read
Summary
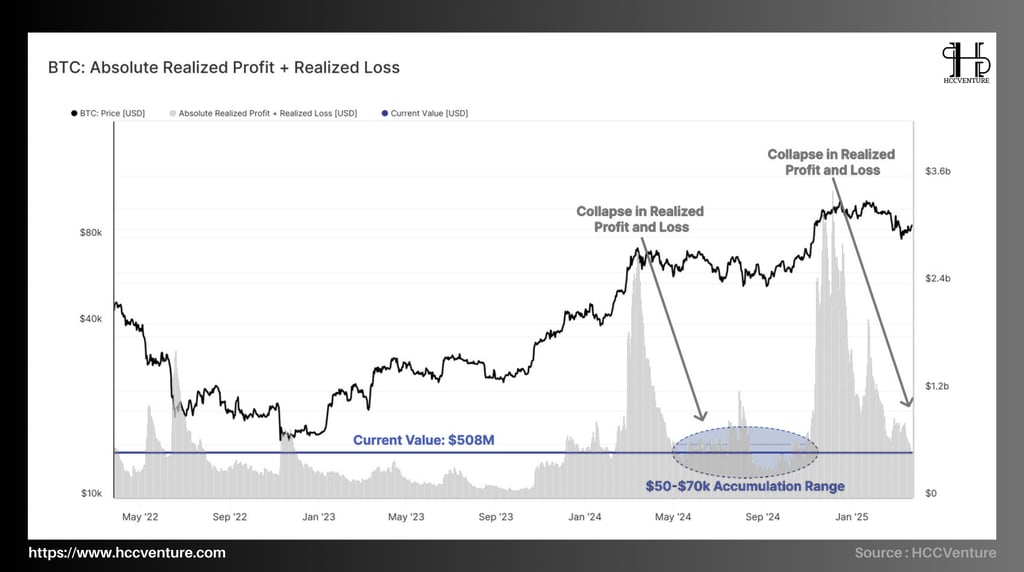
Realized Profit & Loss is falling sharply , indicating a decline in new investor participation and profit/loss taking. The current amount of BTC recorded profit and loss is equivalent to the accumulation period in late 2024 , when the price traded in the $50K - $70K range , reflecting the market returning to a more neutral state after a strong bull cycle.
The sharp price drop from the $97K peak to $82K has caused the amount of BTC held by Short-Term Holders (STH) in a loss to reach its highest level since 2018. However, the total USD value of this loss is still in line with previous bull market cycles , indicating that selling pressure from this group has not reached the extreme levels of previous bear markets.
Amid weakening capital flows and struggling STH, Bitcoin supply held by Long-Term Holders (LTH) is showing signs of increasing again , indicating that long-term investors are taking advantage of the correction period to accumulate more BTC .
In this context, the possibility of Bitcoin continuing to correct will depend on whether the buying pressure from LTH is strong enough to absorb the selling pressure from STH . If the new money flow continues to weaken, the price may continue to fluctuate in the $70K - $85K range before there is a clearer recovery signal .
On-chain metrics analysis
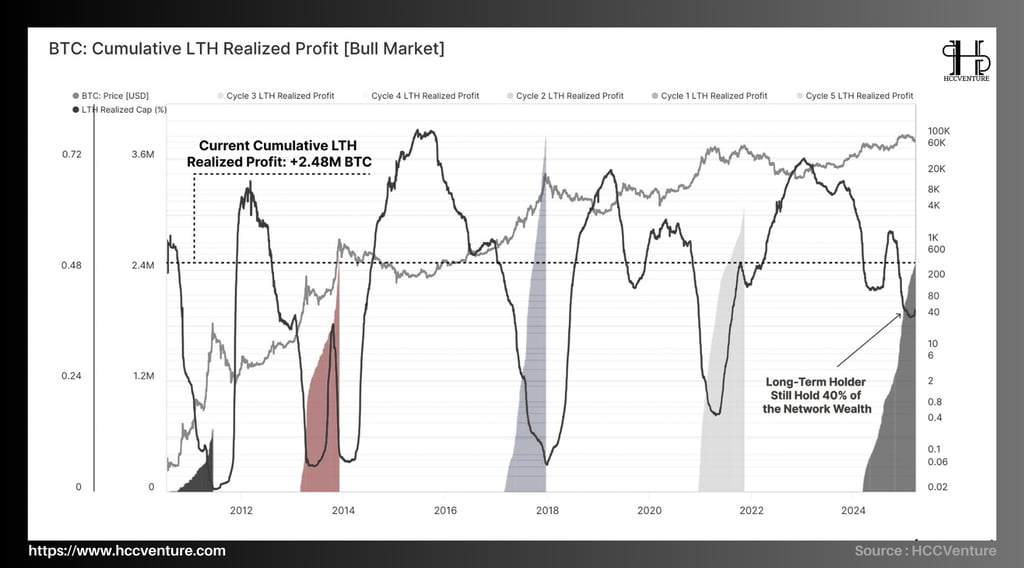
During bull cycles, the market often sees strong selling pressure from Long-Term Holders (LTHs) . This is a group of investors who have held Bitcoin for a long time and tend to take profits when the price reaches a new high. At the same time, to maintain the uptrend , the buying pressure from new investors must be strong enough to absorb the amount of Bitcoin sold by LTHs. The data shows that:
The amount of profit realized by LTHs in this cycle is within the same range as in previous cycles , indicating that the selling pressure from this group is not greater than in previous bull market periods.
This means that the demand from new investors is strong enough to absorb the selling pressure of LTH , helping Bitcoin price maintain the overall uptrend.
The LTH-SOPR (LTH Spent Output Profit Ratio) index remained above 1 for most of the 2024-2025 period, confirming that the group continued to take profits instead of accumulating more.
LTH still holds a relatively large amount of assets compared to similar periods in the previous cycle. In previous bull markets, LTH typically distributed assets more strongly towards the end of the cycle, but this time, the proportion of Bitcoin held by LTH remains significantly high , reflecting a change in investment behavior.
If the holding trend continues, Bitcoin could maintain a long-term uptrend with the support of large investors . However, if LTH's selling pressure increases sharply, a deeper correction could occur
However, if the LTH group starts to take profits more aggressively in the later stages of the cycle, the market could see a larger correction as selling pressure increases suddenly.

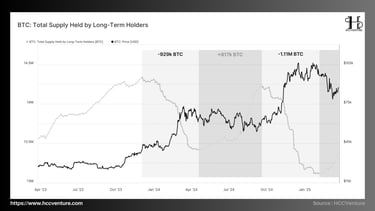
A unique feature is occurring in this cycle: “ the market is going through cyclical distributions and re-accumulations ,” which creates a more structurally stable market environment instead of the sudden growth and sharp corrections of previous cycles. On-chain data shows an alternation between two main cycles:
1st Distribution : LTHs sold 929,000 BTC
Re-accumulation 1 : LTHs bought back 817,000 BTC
2nd Distribution : LTHs Sold 1.11 Million BTC
Re-accumulation 2 (current) : LTHs bought back 278,000 BTC
In total, over 2 million BTC were released into the market during the two sell-offs , but a large portion of this was subsequently reabsorbed during reaccumulation phases .
Compared to previous cycles, when a large amount of BTC selling could mark the end of a bull market , the current cycle is playing out differently:
Balance between distribution and re-accumulation : Data shows that despite large profit-taking from LTHs, the market is still able to absorb and re-accumulate quickly. This reduces the risk of a sharp correction like the late stages of previous cycles.
More Stable Price Structure : Thanks to the constant re-accumulation, Bitcoin price does not experience extreme fluctuations but instead moves sideways after each distribution . This creates a more stable and sustainable market structure in the long term.
LTHs Still Control a Large Amount of Supply : Despite distributing a significant amount of BTC, LTHs still hold the majority of the total Bitcoin in circulation, which creates a strong resistance to any sharp correction.
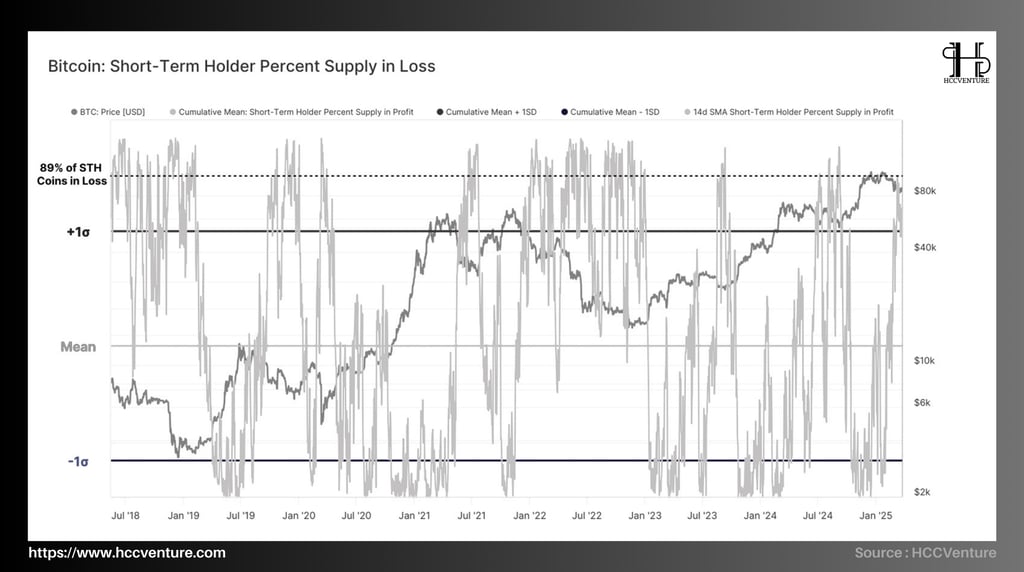
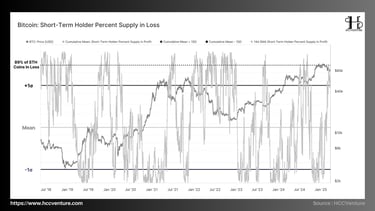
The ratio of Short-Term Holders (STH) supply that is in a loss has exceeded +1SD (standard deviation), meaning that more than 90% of BTC held by STH is currently in negative equity.
This is an important signal that reflects the level of financial stress that short-term investors are facing . Market history has only recorded two times this situation occurred during the current bull cycle:
August 2023 : Strong adjustment period due to weakening liquidity pressure.
August 2024 : Major volatility related to Yen-Carry-Trade unwind, causing widespread sell-off.
Currently, with over 90% of STH’s supply sinking below cost , this means that almost all short-term investors who bought BTC in the recent period are incurring losses. As the level of losses increases, the probability of panic selling also increases.
History shows that times when the STH loss ratio exceeds +1SD are often accompanied by strong price movements, or a large-scale capitulation event . If selling pressure continues to increase, the market may see a deep correction before finding a new equilibrium.
In the 2021-2022 cycle, similar losses also led to major capitulation events in May 2021 (when the price fell from $60k to $30k) and June 2022 (when the price fell from $30k to $17k). However, in the context of the current cycle, the buying power from Long-Term Holders is still quite strong, which can act as an absorption of selling pressure from STH and prevent the capitulation event from being too deep.
If selling pressure continues to increase and there is not enough demand to absorb it, the likelihood of a capitulation event is very high , similar to previous difficult phases of the bull cycle.

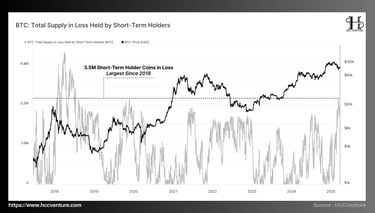
During Bitcoin's bull cycles, the Short-Term Holders (STH) group has always been the main force carrying out profit-taking and loss-selling activities. Selling pressure from Short-Term Holders is increasing sharply:
STH’s BTC volume is currently at 3.4 million BTC , which is the highest number since July 2018 – a time when the market fell into a prolonged decline after the 2017 peak.
The surge in STH supply in the red reflects the stress in the market , especially for new investors entering at high prices.
The recent price decline has put a large number of short-term investors in a difficult position , forcing them to face a decision: continue holding in hopes of a recovery, or cut their losses and accept the loss.
Historically, when the STH supply in a loss state reaches too high a level , the market usually faces one of two scenarios:
A broad "capitulation" event , where this group is forced to sell off, pushing prices lower in search of real support.
The intervention of long-term demand , especially from Long-Term Holders (LTH), absorbed the sold BTC, helping the market stabilize and prepare for a new recovery.
The current level of losses in STH is extreme , which increases the probability of a short-term "capitulation". If the losses continue to widen without strong enough buying force, the market may enter a longer period of decline.
However, the behavior of Long-Term Holders is still the deciding factor. If this group continues to hold or increase accumulation, the market can maintain a long-term uptrend. On the contrary, if STH starts to panic sell without support from demand, the possibility of a deeper correction will be very high.
Bitcoin is hovering in a new price range centered around $85,000 , after correcting from its peak of $109,000.
This reflects a temporary equilibrium between buying and selling pressure, where supply and demand factors in the spot market are weakening . There are two main factors to consider:
Capital Inflows: Occur when a new buyer is willing to pay a higher price than the seller's initial cost, resulting in the realization of profits.
Capital Destruction: Occurs when a holder sells at a price below the original cost, creating a realized loss. A new investor then buys back at a discount to the original purchase price.
Sharp decline in realized profit and loss volume
Total realized gains and losses fell sharply from $3.4 billion to $508 million, representing a decline of -85%.
The index is now back to levels similar to the accumulation phase in the $50,000 - $70,000 price range in 2024 , indicating that demand intensity is weakening significantly .
Long-Term Holders (LTH) are limiting their selling , showing their patience in holding Bitcoin. This reduces selling pressure and limits the level of profit realization.
The flow of new capital into the market is slowing down , causing the number of transactions with large price differences (both profit and loss) to decrease sharply. This shows the caution of new investors in entering the market.
If selling pressure does not increase significantly, the market may hold the current price range and gradually establish a solid foundation for the next growth cycle.
Selling Pressure from STH – Vulnerable Investor Group
Data shows that all the BTC sold at a loss in the market comes from the STH group , who bought in at a higher price and are now accepting to sell at a loss to cut risk.
This reflects weakness in short-term investor confidence , especially amid increased market volatility.
The proportion of STH supply in the red is now at its highest level since July 2018 , indicating that the majority of new market entrants are facing unrealized losses.
LTH – The group of investors who control the majority of profits
In contrast, LTH remains profitable, with the majority of realized market profits going to them .
This shows that the long-term holding strategy continues to prove effective , as these investors are in a stronger position to take profits without being pressured to sell off like the STH group.
This difference also reflects that LTH still controls the majority of the profitable BTC supply , reducing the likelihood of the market entering a full-blown sell-off.
The market is experiencing a strong divergence between long-term and short-term investors , with STH under pressure to sell at a loss, while LTH maintains profits and controls the majority of profitable supply .
If new capital does not return strongly, selling pressure from STH may pull prices back to important support levels, creating further negative volatility in the short term. However, in the long term, LTH is still holding its position, indicating that the market has not yet entered a comprehensive top distribution phase . This may create the foundation for a recovery cycle after selling pressure from STH weakens.
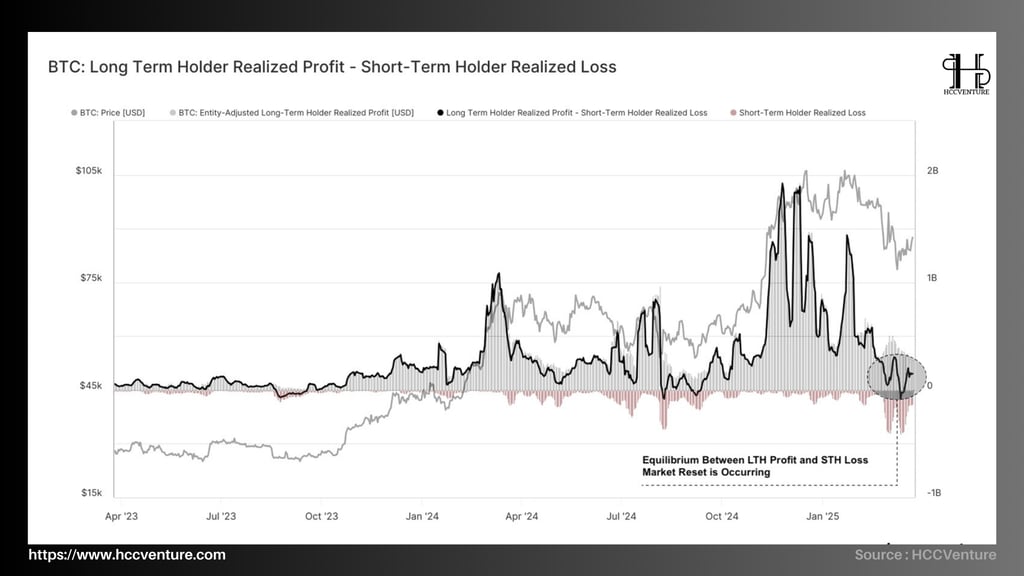
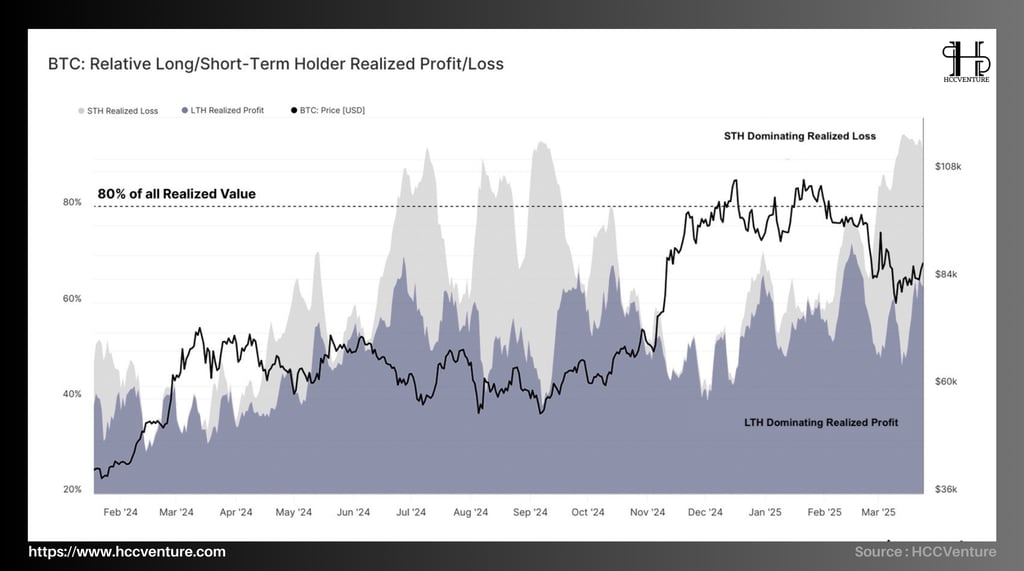
An important factor to analyze is the difference between the realized profits of Long-Term Holders (LTH) and the realized losses of Short-Term Holders (STH) . Currently, this index has returned to the neutral zone, reflecting a balanced market between selling pressure and new demand.
Net capital inflows into the market are weakening , indicating a decline in the number of new investors entering the market.
The rate of capital destruction due to selling at a loss from STH is increasing , reflecting the concerns and lack of confidence of this group of investors.
The realized profits from LTH have now been offset by the realized losses from STH , indicating a balance between the selling pressure from the two groups. This suggests that the market is lacking strong bullish momentum , as new demand is not strong enough to absorb the selling pressure.
Although selling pressure from STH is creating corrective pressure, profit-taking from LTH continues , strengthening resistance at key price zones.
The new capital flow into the market is not strong enough to absorb this supply , causing prices to fall into a sideways or downward correction state.
If new capital flows do not recover, selling pressure from LTH and STH may cause the market to continue to correct or move sideways in the near future. However, if new demand appears strongly, Bitcoin may regain bullish momentum and break through important resistance zones , confirming a more sustainable uptrend.
Evaluation and Conclusion
The scale of profit-taking and stop-loss orders on the chain is gradually decreasing , indicating that the market is in a temporary balance between buyers and sellers. There is no strong new money flow , but there is also no excessive selling pressure, causing the price to remain within a narrow range.
The majority of BTC held by STH are currently in a loss-making state , indicating that this group is under strong selling pressure. However, the selling pressure from STH does not lead to a panic sell-off (capitulation), but only reflects the market sentiment that is in the adjustment phase and finding a balance point.
LTH is moving towards accumulation , with the total supply held by this group trending upwards. This is a positive sign as LTH is typically a group of investors with long-term confidence in Bitcoin, and their increased holdings often lead to a more solid price foundation.
The reduction in selling pressure from STH and the increase in accumulation from LTH could help Bitcoin maintain its current price range and set the stage for the next rally. Historical data shows that when LTH increases its holdings during corrections, BTC prices tend to recover strongly afterward.
New demand is still weak , there is no large cash flow to push the price up sharply. If the selling pressure from STH exceeds the market's absorption capacity , Bitcoin may continue to correct deeper.
If new money flows back in the near future, Bitcoin could break out of the current price range and enter a new growth cycle. Conversely, if selling pressure from STH increases, a deeper correction could occur before the market regains growth momentum.
Join the HCCVenture community to get the latest market information. Once again, we give our opinion on potential projects in the crypto market. This is not investment advice, consider your portfolio. Disclaimer: The views expressed in this article are solely those of the author and do not represent the platform in any way. This article is not intended to be a guide to making investment decisions.
API & Data : Glassnode
Compiled and analyzed by HCCVenture
Join our telegram community: HCCVenture
Explore HCCVenture group
HCCVenture © 2023. All rights reserved.


Connect with us
Popular content
Contact to us
E-mail : sp_contact@hccventure.com
Register : https://linktr.ee/holdcoincventure
Disclaimer: The information on this website is for informational purposes only and should not be considered investment advice. We are not responsible for any risks or losses arising from investment decisions based on the content here.
TERMS AND CONDITIONS • CUSTOMER PROTECTION POLICY
ANALYTICAL AND NEWS CONTENT IS COMPILED AND PROVIDED BY EXPERTS IN THE FIELD OF DIGITAL FINANCE AND BLOCKCHAIN BELONGING TO HCCVENTURE ORGANIZATION, INCLUDING OWNERSHIP OF THE CONTENT.
RESPONSIBLE FOR MANAGING ALL CONTENT AND ANALYSIS: HCCVENTURE FOUNDER - TRUONG MINH HUY
Read warnings about scams and phishing emails — REPORT A PROBLEM WITH OUR SITE.