On-chain analysis week 12/2026: Market stalled - liquidity remains poor
Bitcoin has recovered strongly to the price range of around $71,000, the absence of large supply clusters above $70,000 reflects the "supply cleared" phase.
3/26/202612 min read
Market Summary
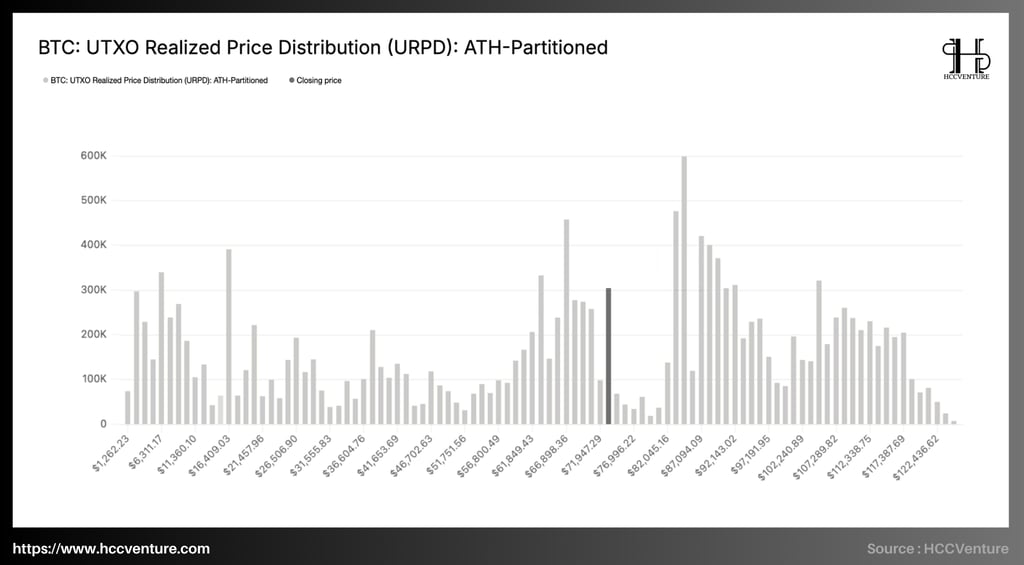
Bitcoin has broken through the $70,000 mark and entered a thin accumulation gap between $72,000 and $82,000. URPD (Unrealized Profit/Loss Distribution) analysis clearly confirms that on-chain resistance in this region is very limited , with most supply only forming at significantly lower price levels than the current one.
The absence of large supply clusters above $70,000 reflects a " supply cleared " phase, meaning supply has been effectively purged through previous correction phases , creating a favorable technical foundation for continued upward momentum if demand remains stable.
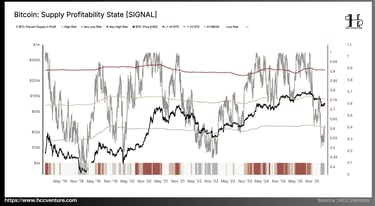
The Percent of Supply in Profit has recovered to around 60% , a level that cyclical history shows is often associated with the exhaustion phase of the first bounce at cyclical lows . To transition into a true bull market, this indicator needs to remain stable above 75% for an extended period.
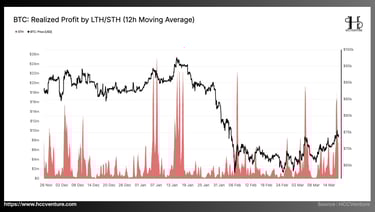
Short-term holders (STH) continued to realize strong profits as the price approached the $71,000 region, with realized profits peaking at around $18 million per hour , a pattern that almost exactly repeated itself from the February period. The selling of STH against price strength is typical during the transition from a recovery to a sustained uptrend.
ETF inflows have rebounded significantly over the past month, marking a new wave of institutional demand and reinforcing the shift toward a spot-led market. This increase contrasts sharply with the outflow at the beginning of the year, confirming that institutional capital is returning to support prices from the demand side.
Spot Cumulative Volume Delta (CVD) has reversed its upward trend on major exchanges, signaling a shift from sustained selling pressure to a renewed accumulation phase. Spot activity on Coinbase has stabilized and turned positive, reflecting the return of early-stage institutional investor participation.
Analyzing on-chain metrics
Bitcoin has broken out above the $70,000 mark and moved into a thin accumulation gap between $72,000 and $82,000 , an encouraging technical development after a period of deep correction . However, a single constructive price rally is not enough to confirm a decisive structural shift in the market.
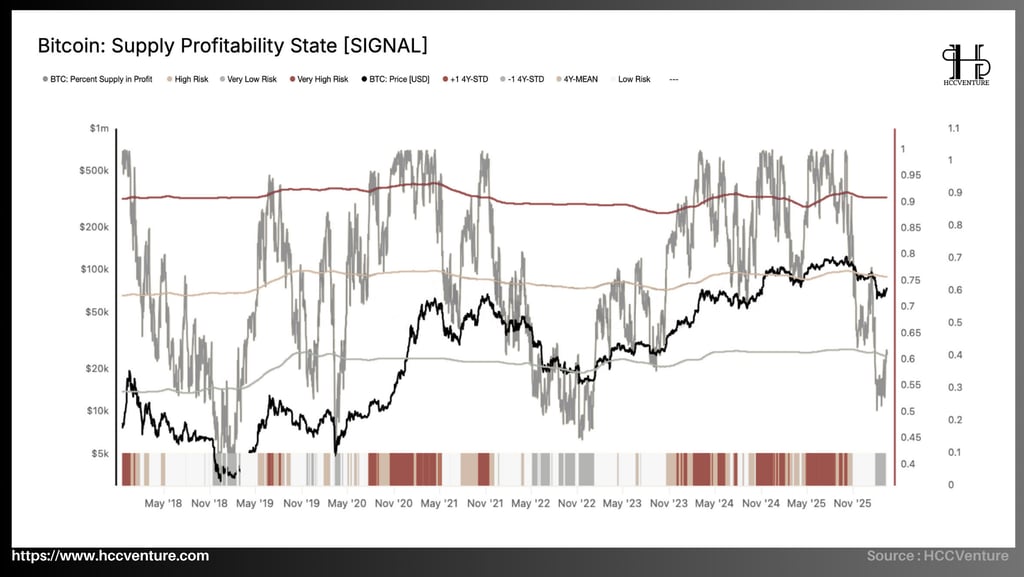
The Supply Profitability State chart from HCCVenture clearly illustrates the journey of this indicator through multiple cycles. History shows that every recovery from deep bear market bottoms into the early bull market phase is confirmed when the indicator climbs from below the -1 standard deviation (around 60%) to the long-term average of 75% . Recent price movements have pushed the Percent of Supply in Profit to exactly 60% , perfectly consistent with the initial bounces at the bottoms of previous cycles, where market exhaustion often appears on the first attempt at recovery.
Compared to historical lows, the current 60% level is not significantly different from the period in November 2018 or May 2022, when Bitcoin's price also surged after a deep drawdown but quickly encountered resistance because profits had not yet been widely distributed. At that time, the Percent of Supply in Profit also only reached 60% before reversing, and it took many months of accumulation to surpass the 4Y-MEAN line.
The fact that the current index is stalled at -1 (4Y STD) instead of continuing to climb to 75% indicates that selling pressure from short-term holders remains significant, and supply has not yet truly shifted to a "profit-taking sustainable" state . If prices maintain their upward momentum without raising this index above 75% in the near future, the market will continue to be in a typical bear market recovery scenario instead of transitioning to a true bull market.
Compared to its historical low (below 40% at the end of 2018), the current 60% level represents a significant improvement, but it is still a long way from the 75% threshold – a level that every true bull market cycle must surpass to confirm widespread participation from long-term holders.
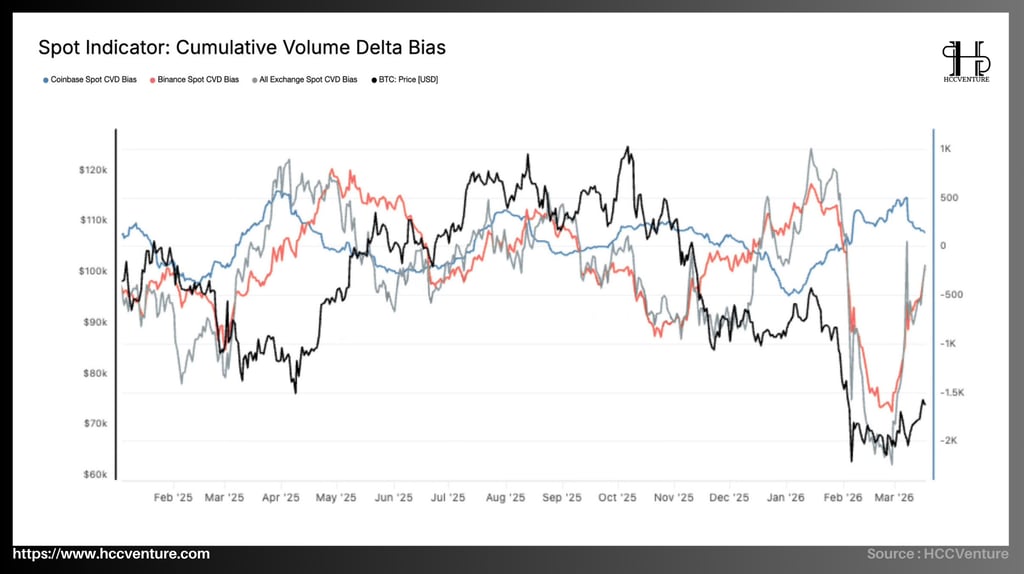
The Cumulative Volume Delta Bias from HCCVenture provides the most detailed and compelling view of this shift, with three separate CVD lines – Coinbase (blue), Binance (red), and All Exchanges (gray) – directly compared to the Bitcoin price line (black) during the period from February 2025 to March 2026.
Throughout Q4 2025 and early 2026, the spot market witnessed continuous and intense selling pressure, pushing the market-wide CVD (All Exchanges) to a record low for the current cycle, bottoming out at around -$2,000 by the end of February 2026 – the deepest negative level since charts began recording.
Binance, the exchange with the largest share of spot retail volume, led this distribution with the sharpest decline , clearly reflecting aggressive selling by individual investors and a portion of the outflow from ETFs. Conversely, Coinbase – a proxy for institutional investor activity – remained relatively more stable in the early stages but still wasn't enough to offset the losses, resulting in the overall market CVD remaining in negative territory for an extended period.
However, from the end of February 2026 to the present, the picture has fundamentally changed. All three CVD curves have reversed sharply upwards, marking a clear shift from a distribution to an accumulation phase.
Compared to previous periods on the chart, the deep negative CVD in February 2026 is significantly lower than the temporary lows in 2025 (around -1,000 to -1,500), demonstrating that the recent sell-off was one of the strongest spot distributions of the cycle. The rapid recovery from this low to the current level not only coincides with the price rebound from $60,000 but also surpasses previous reversals, where the market-wide CVD only recovered slightly and quickly reversed.
Percent of Supply in Profit, an important additional lens through which to assess market health, is the ability to absorb profit-taking waves from short-term holders – investors who have recently entered the market.
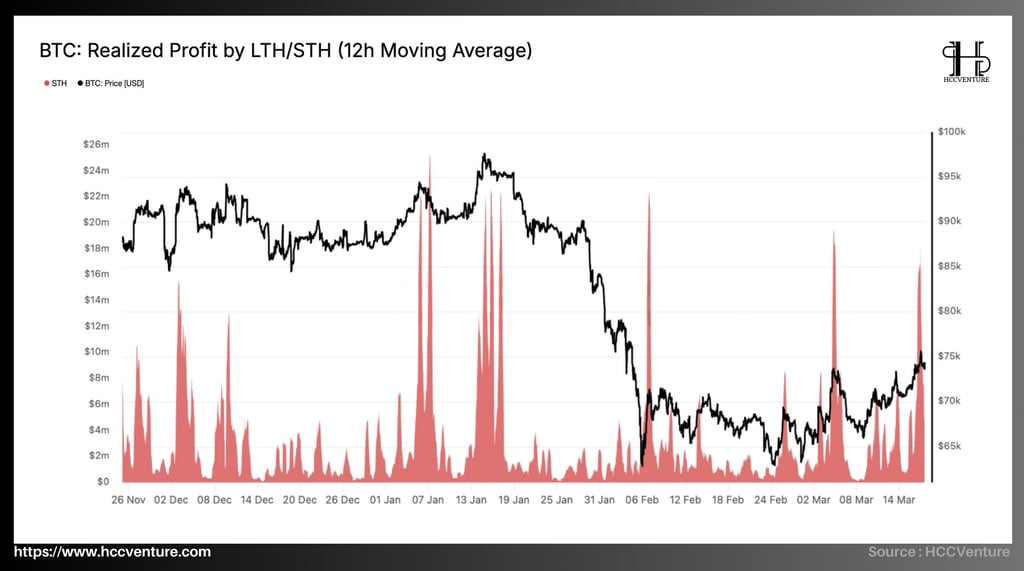
The chart clearly shows that throughout the recovery phase from early February 2026, when Bitcoin's price bounced from its cyclical lows, STH's realized profit experienced a series of sharp peaks. Most notably, last week's move: as the price approached and surpassed $74,000, the 12-hour moving average of STH Realized Profit surged to $18.4 million per hour – the highest level since the spike peaks in January 2026.
Compared to the lowest point of the recent cycle (when STH's realized profit almost hit zero during the drawdown in February 2026), the current spike has increased many times over , confirming that short-term investors are prioritizing realizing profits rather than holding positions waiting for a long-term upward trend.
This increase in realized profit for STH is entirely consistent with the natural characteristics of the initial recovery phase in a bear market , where recent buyers, often short-term holders, tend to prioritize exiting positions rather than building long-term confidence.
STH asserts that the market is effectively absorbing the wave of profit-taking from short-term holders – a necessary step to transition from a technical bounce to a sustainable structural recovery. The fact that the price remained above $70,000 despite a spike in realized profit to $18.4 million/hour is proof of the strength of returning spot demand, as confirmed by CVD in previous analyses.

Percent of Supply in Profit, an important additional lens through which to assess market health, is the ability to absorb profit-taking waves from short-term holders – investors who have recently entered the market.
The chart clearly shows that throughout the recovery phase from early February 2026, when Bitcoin's price bounced from its cyclical lows, STH's realized profit experienced a series of sharp peaks. Most notably, last week's move: as the price approached and surpassed $74,000, the 12-hour moving average of STH Realized Profit surged to $18.4 million per hour – the highest level since the spike peaks in January 2026.
Compared to the lowest point of the recent cycle (when STH's realized profit almost hit zero during the drawdown in February 2026), the current spike has increased many times over , confirming that short-term investors are prioritizing realizing profits rather than holding positions waiting for a long-term upward trend.
This increase in realized profit for STH is entirely consistent with the natural characteristics of the initial recovery phase in a bear market , where recent buyers, often short-term holders, tend to prioritize exiting positions rather than building long-term confidence.
STH asserts that the market is effectively absorbing the wave of profit-taking from short-term holders – a necessary step to transition from a technical bounce to a sustainable structural recovery. The fact that the price remained above $70,000 despite a spike in realized profit to $18.4 million/hour is proof of the strength of returning spot demand, as confirmed by CVD in previous analyses.

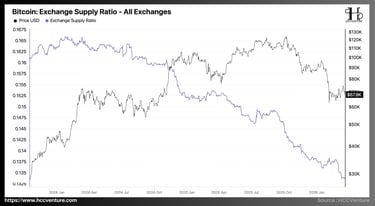
The Exchange Supply Ratio – the ratio of Bitcoin supply held across all exchanges to the total circulating supply – has plummeted to its lowest level in the entire cycle recorded on the chart, currently standing at around 0.133.
During 2024, the Exchange Supply Ratio peaked at approximately 0.166 in mid-year , corresponding to a period of abundant supply on exchanges as prices surged and some short-term investors took profits. From the end of 2024, the index began a clear downward trend, accompanied by a rise in Bitcoin's price above $100,000. By 2025, the downward trend continued steadily, with faster rate drops in Q3 and Q4 of 2025 as prices corrected.
By early 2026, the index had plummeted below 0.135 and hit its current record low of 0.133 – significantly lower than any previous local lows on the chart (the previous low being around 0.146 in mid-2025) . Compared to the most recent historical low of the cycle (current 0.133 versus previous 0.146) , this is the deepest drop since the index was tracked, reflecting the massive amount of Bitcoin that left exchanges to move into cold wallets or self-custodial storage.
The sharp drop in the Exchange Supply Ratio during the price recovery from $60,000 to the current $67,800 is the most important academic signal: the supply on the exchange is shrinking to an unprecedented degree, eliminating potential selling pressure from short-term holders and allowing spot demand to truly dominate the market.
The fact that the Exchange Supply Ratio reached a cyclical bottom while prices remained above $67,000 indicates that long-term holders are not only holding but also accumulating, mitigating the risk of a cascade liquidation and enhancing the sustainability of the uptrend. This is the lowest level since the beginning of the 2024 cycle, even lower than the price peak in 2025, confirming that HODLing behavior is in its strongest phase in recent history.
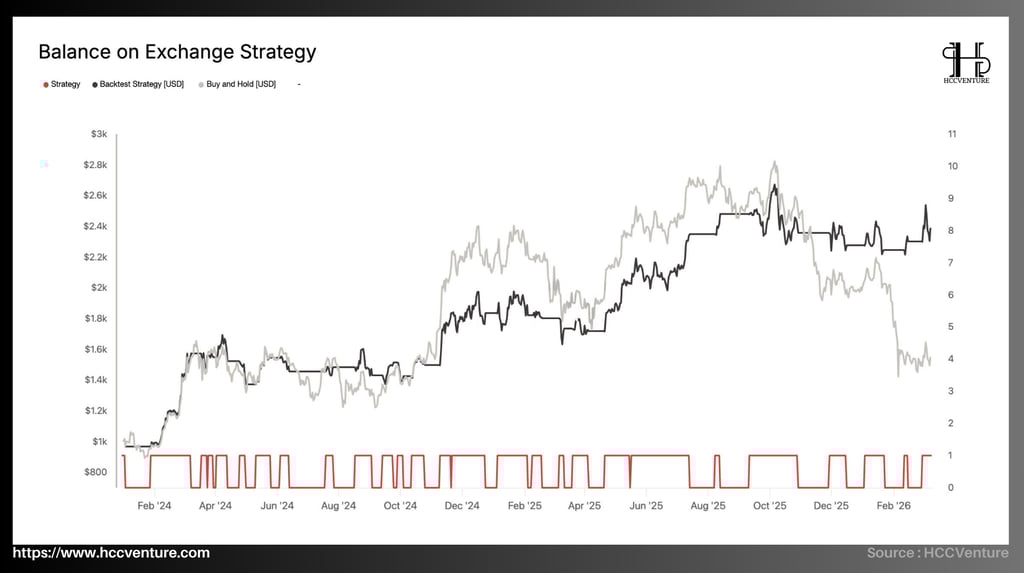
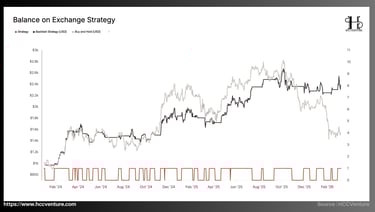
The Balance on Exchange Strategy clearly highlights the difference in performance between the two approaches. The Buy and Hold strategy peaked at around $2,800 by the end of 2025, accurately reflecting Bitcoin's strong upward momentum as the price reached cyclical highs.
However, from late 2025 to February 2026, the gray line plummeted sharply to a low of around $1,500, fully reflecting the impact of the recent drawdown as supply on the exchange remained in excess during some transitional phases. Conversely, the Backtest Strategy of Balance on Exchange maintained a more stable trajectory, peaking at around $2,700 during the same period and ending the phase at around $2,500 – significantly higher than the Buy and Hold strategy at the present time.
Compared to the lowest point of the Buy and Hold drawdown in February 2026 ($1,500) , the Backtest Strategy currently outperforms by approximately 67% , demonstrating its ability to systematically protect capital and capture upside by adjusting the exchange balance based on on-chain signals.
The trigger signal phases (level 1) often coincide with periods of sharp supply drops on the exchange or CVD reversals and accumulation, helping the strategy avoid widespread selling pressure. While Buy and Hold absorbs all price fluctuations, the Backtest Strategy minimized drawdown by proactively adjusting the balance, especially in Q4 2025 and early 2026 – the period when the Exchange Supply Ratio reached its cyclical bottom as previously analyzed.
This superiority is not accidental but a direct result of applying core on-chain indicators – from URPD confirming supply cleared, CVD reversing accumulation, to the Exchange Supply Ratio reaching a record low of 0.133 . The Balance on Exchange strategy translated these signals into concrete action: reducing the balance on the exchange during the distribution phase and increasing exposure when spot demand returned, thereby optimizing both profit and risk.
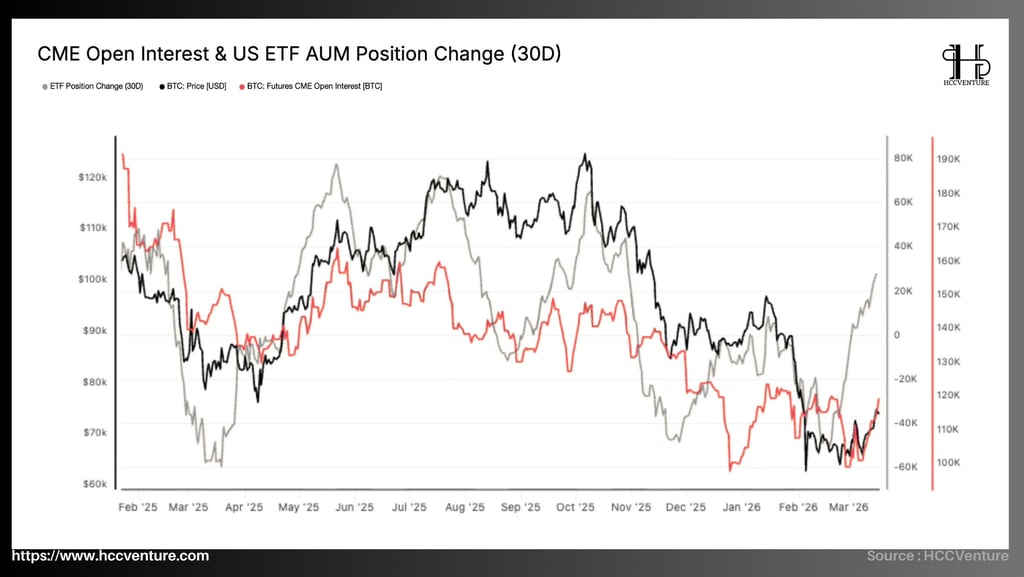
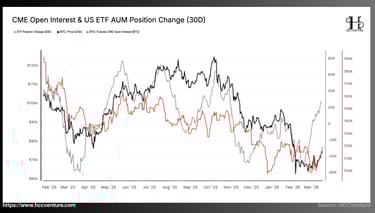
Throughout Q4 2025 and early 2026, the ETF Position Change (30D) experienced a prolonged outflow, pushing the index to its deepest negative levels in the cycle, reflecting a period of institutional capital withdrawal synchronized with price drawdowns . However, from the end of February 2026 to the present, the gray line has reversed sharply upwards and maintained strong positive momentum , marking a clear wave of capital reallocation into spot ETFs.
Compared to the lowest point of this index during the most recent drawdown (the peak outflow in February 2026), current capital flows have recovered strongly, becoming the main driving force pushing Bitcoin's price through the dense supply cluster of $59,000 - $72,000 and into the air gap of $72,000 - $82,000 with minimal on-chain resistance. This is the most significant improvement since the strong inflow period at the end of 2024, when ETFs first asserted their role as market leaders.
The clear divergence between accelerating ETF inflows and the still modest CME open interest reflects a healthy market structure: price increases are supported by real capital inflows into spot exposure , not by leveraged speculative positions. This is a typical pattern of the early stages of a transitional bull market, where institutional demand returns without the risk of cascade liquidation from futures.
The sharp increase in ETF Position Change (30D) while CME open interest has not yet expanded suggests that institutional investors are re-entering the market in the early stages, prioritizing safe spot exposure over high leverage risk. If CME open interest begins to expand in parallel with continued ETF inflows, this would be a clear sign of growing conviction, pushing the recovery from a technical to a sustainable trend.
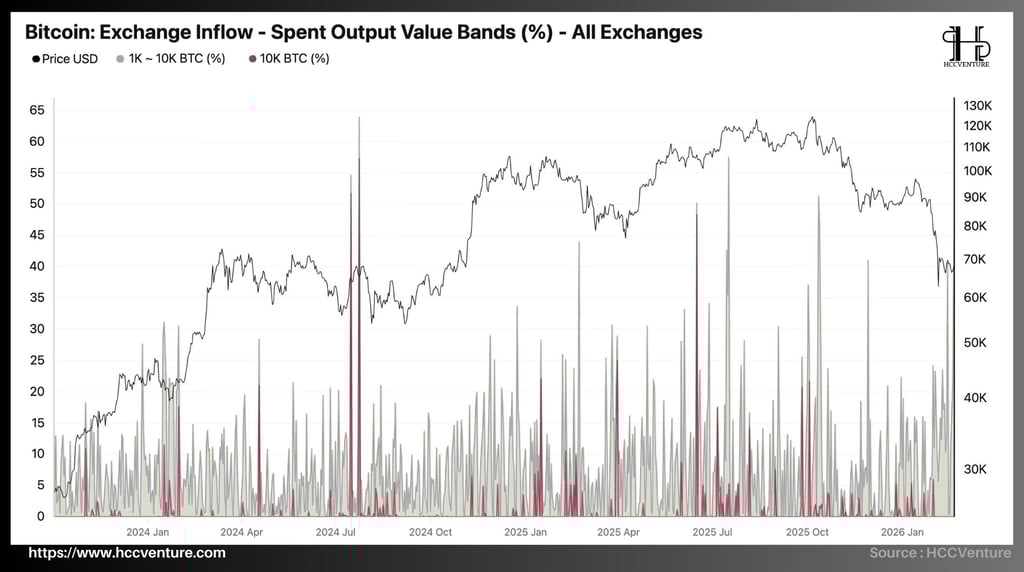
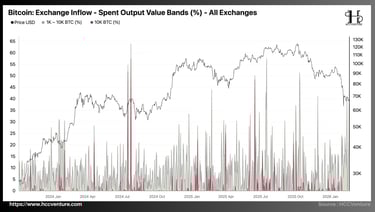
Throughout 2024–2025, major inflow bands recorded several strong spike peaks, with the 10K BTC ratio (red line) reaching record highs of over 50% at several cyclical transition points, particularly in mid-2024 and during the sharp fluctuations at the end of 2025, corresponding to the period when supply on exchanges was still abundant and realized profits of STH peaked.
However, from late 2025 to early 2026, when the price experienced a drawdown to $60,000 , the frequency and intensity of spikes decreased significantly compared to the historical peak, indicating that large entities are no longer driving inflows as aggressively as before. Compared to the highest point of the 10K BTC band (over 50% in mid-2024 ), the current rate in the March 2026 recovery phase is considerably lower, while gray spikes in the 1K-10K range still appear but with lower frequency , confirming that large capital flows are being tightly controlled.
The stability of Exchange Inflow Bands, in the context of the price breaking out of the dense supply cluster of $59,000 - $72,000 and entering the air gap of $72,000 - $82,000 , is direct evidence of the market's ability to absorb pressure. Large inflows no longer lead to structural breakdowns as observed in previous phases, but instead coincide with a positive reversal of Cumulative Volume Delta on Coinbase and Binance, along with a strong return of ETF capital.
Exchange Inflow - Spent Output Value Bands (%) confirm that the activity of large entities on the exchange is under optimal control, with the large inflow rate sharply reduced from its historical peak and fully absorbed by the market during the current recovery phase.
Review and recommendations from HCC Venture
Bitcoin has completed its technical recovery from the $60,000 bottom and stabilized in the $70,000-$74,000 range, with the current upward momentum further strengthened by a noticeable improvement in spot market conditions. The strong return of ETF inflows and positive CVD on major exchanges have confirmed renewed accumulation by both institutional and retail investors , marking a fundamental shift away from the heavy distribution environment that dominated the recent drawdown.
This shift not only provides a more solid foundation for prices but also reflects an on-chain cycle moving from “ supply cleared ” to “ accumulation confirmed ,” where genuine demand begins to prevail and facilitates a sustainable recovery.
The entire on-chain data series we analyzed confirms the consistency of this picture. URPD has confirmed a successful breakout from the dense supply cluster of $59,000 - $72,000. The Percent of Supply in Profit recovered to 60% – significantly higher than the low of below 50% during the drawdown – but still hasn't surpassed the 75% threshold needed to confirm a true bull market, indicating the market is still testing the resilience of the first bounce.
The spot market further solidified its recovery momentum as Cumulative Volume Delta reversed to positive on both Coinbase and Binance, with Coinbase leading institutional capital flows and Binance easing selling pressure – a complete reversal from the strong distribution phase in late 2025. The Exchange Supply Ratio hit a cyclical low of 0.133, lower than any previous low, reflecting aggressive HODLing behavior by long-term holders and a massive amount of BTC leaving exchanges.
In this context, Bitcoin is shifting from a " conviction pending " phase to a position ready for a more sustainable uptrend, with the nearest targets at True Market Mean $78,000 and the upper air gap at $82,000. Maintaining positive ETF inflows and spot CVD will be key to extending this conviction, transforming the technical rebound into a genuine bull market cycle. The market has completed its supply clearing and accumulation phase, ready for the next upward move with solid on-chain momentum and increasing participation from institutional capital.
Disclaimer: The information presented in this article is the author's personal opinion in the field of cryptocurrency. This is not financial or investment advice. All investment decisions should be based on careful consideration of your personal portfolio and risk tolerance. The views expressed in this article do not represent the official stance of the platform. We recommend that readers conduct their own research and consult with experts before making any investment decisions.
API & Data : Glassnode, Dune, CoinGecko
Compiled and analyzed by HCCVenture
Join the HCCVenture organization here: https://link3.to/holdcoincventure
Explore HCCVenture group
HCCVenture © 2023. All rights reserved.


Connect with us
Popular content
Contact to us
E-mail : sp_contact@hccventure.com
Register : https://linktr.ee/holdcoincventure
Disclaimer: The information on this website is for informational purposes only and should not be considered investment advice. We are not responsible for any risks or losses arising from investment decisions based on the content here.
TERMS AND CONDITIONS • CUSTOMER PROTECTION POLICY
ANALYTICAL AND NEWS CONTENT IS COMPILED AND PROVIDED BY EXPERTS IN THE FIELD OF DIGITAL FINANCE AND BLOCKCHAIN BELONGING TO HCCVENTURE ORGANIZATION, INCLUDING OWNERSHIP OF THE CONTENT.
RESPONSIBLE FOR MANAGING ALL CONTENT AND ANALYSIS: HCCVENTURE FOUNDER - TRUONG MINH HUY
Read warnings about scams and phishing emails — REPORT A PROBLEM WITH OUR SITE.