


On-chain analysis week 12/2025: Are long-term investors weakening?
The Bitcoin market is adjusting to a new price range after experiencing a -30% drop from a peak of $97,000 to $82,000 (as of March 24, 2025). The “Liquidity Crush” phenomenon is taking place in both on-chain data and futures markets, while the Long-Term Holders (LTH) group continues to remain inactive.
3/24/202511 min read
Summary
Liquidity continued to decline, with net capital inflows virtually stopping – Realized Cap increased by just +0.67%/month and exchange inflows fell by 54% (from 58,600 BTC/day to 26,900 BTC/day). The Hot Supply index also dropped by more than 50% (from 5.9% to 2.8%), indicating a depletion of available coins.
Open interest in futures contracts has declined, reflecting a decline in speculative and hedging activity. At the same time, cash-and-carry strategies on CME Group have retreated, with outflows from spot ETFs and reductions in futures positions adding to the pressure on overall liquidity.
The Volatility Smile Index shows that implied volatility premiums on puts have increased, reflecting a preference for downside risk protection. This highlights the cautious sentiment of institutional investors as Bitcoin prices fell from $97,000 to $82,000.
Short-term traders (STH) are under great financial stress, with a total 30-day loss of $7 billion – the largest capitulation event this cycle. The unrealized loss is close to +2σ, indicating selling pressure to lock in losses. However, compared to previous corrections (May 2021, 2022), the scale of the loss is still less severe, indicating that the selling momentum has not reached an extreme level.
The long-term investor group (LTH) remains depressed, with the Binary Spending Indicator decreasing and the LTH supply increasing again after a period of decline. Selling pressure from this group has decreased significantly, indicating a trend shift from distribution to accumulation. Currently, the LTH group holds a large amount of network wealth compared to this stage of the cycle, creating an interesting dynamic for the next move.
On-chain metrics analysis
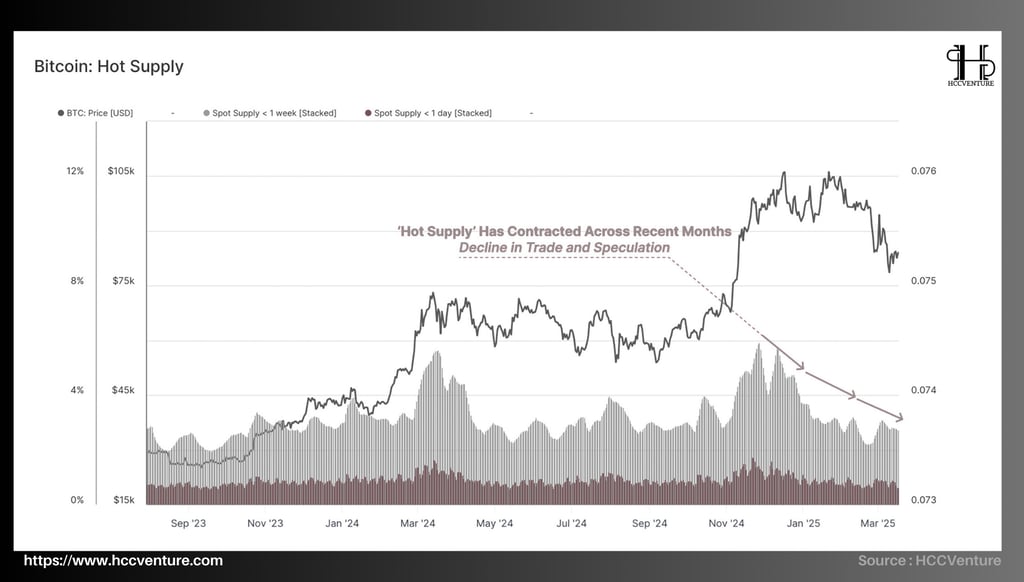
The current Hot Supply Index shows a significant decline in the volume of assets in this group. Specifically:
The value of assets held by the Hot Supply group has decreased from 5.9% of total circulating supply to 2.8% .
This equates to a more than 50% drop in the amount of liquid coins, i.e. coins that are highly liquid and available for trading.
This contraction reflects a clear trend: a decline in appetite for trading and speculation in the market. When the number of “hot” coins drops sharply, it shows that investors are tending to hold assets longer (hodling) instead of engaging in short-term trading or active speculation.
This is an important signal of a change in market behavior, especially in the context of Bitcoin's price falling from $97,000 in late February to $82,000 on March 24, 2025.
The drop in Hot Supply by more than 50% indicates that the amount of capital available to circulate in the Bitcoin ecosystem has shrunk significantly. This means that the market is losing some of the momentum needed to sustain short-term price rallies or recover quickly from selling pressure. Low liquidity often leads to larger price swings when large buy/sell orders are placed, increasing the risk for investors.
The decline in the Hot Supply ratio also reflects investor caution. Instead of rotating capital to seek quick profits, many market participants choose to hold coins for longer periods of time.
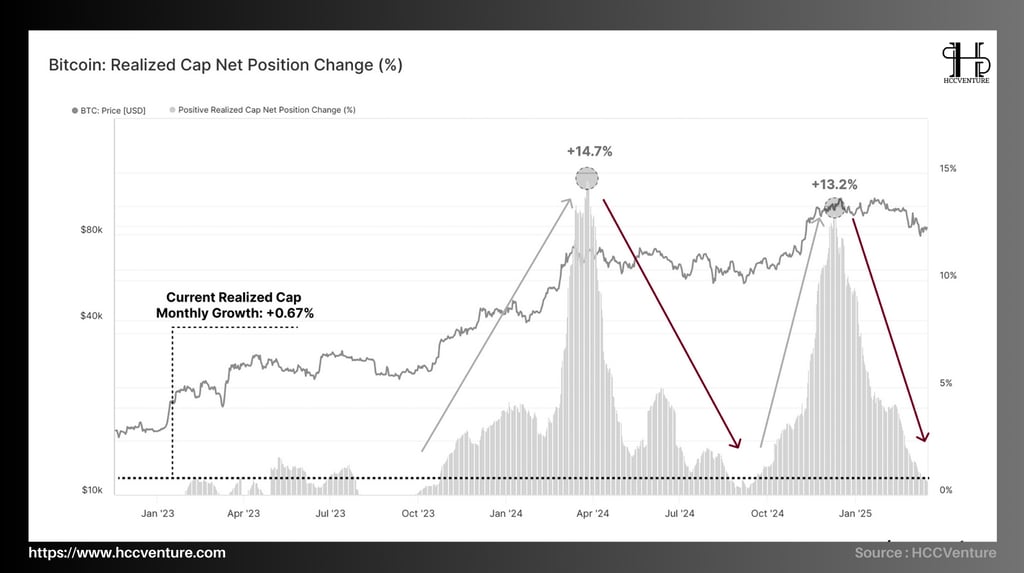
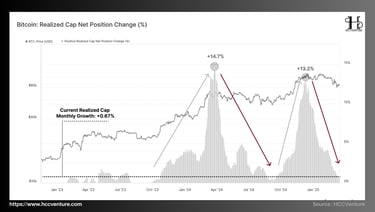
One important metric to consider is Bitcoin's Realized Cap – which represents the total actual value of all Bitcoins in circulation based on the last price they were traded at.
Currently, Realized Cap is only growing at a rate of +0.67% per month , a significantly lower figure compared to previous periods of strong growth. This shows that the new capital flowing into Bitcoin has almost stopped, no longer enough to push the price to higher levels.
Onchain data also shows that the market is moving from a “profit-dominated” phase – where investors are actively taking profits – to a “neutral equilibrium” state .
This is reflected in increased expectations of price volatility, as the market is no longer able to maintain a steady upward momentum but instead is in a tug-of-war between buying and selling forces.
Two trends are taking place:
Lack of new capital : The near stagnation of net capital inflows into Bitcoin is a sign that the market is losing short-term growth momentum. In this context, the ability of the price to recover to key resistance levels (e.g. $90,000 or higher) will depend largely on the return of inflows from institutional or retail investors. However, with reduced liquidity, the downward pressure may persist.
Expect high volatility : A shift to neutral equilibrium indicates that the market is in a consolidation phase. This is typically accompanied by larger price swings, as traders look for opportunities on both the upside and downside. Investors should be prepared for the possibility that Bitcoin may test lower support levels (e.g. $75,000) before finding a clear trend again.
The sluggish Realized Cap growth (+0.67%/month) is evidence of waning bullish momentum, while increased volatility expectations reflect a market searching for a new equilibrium after a period of strong profit-taking.
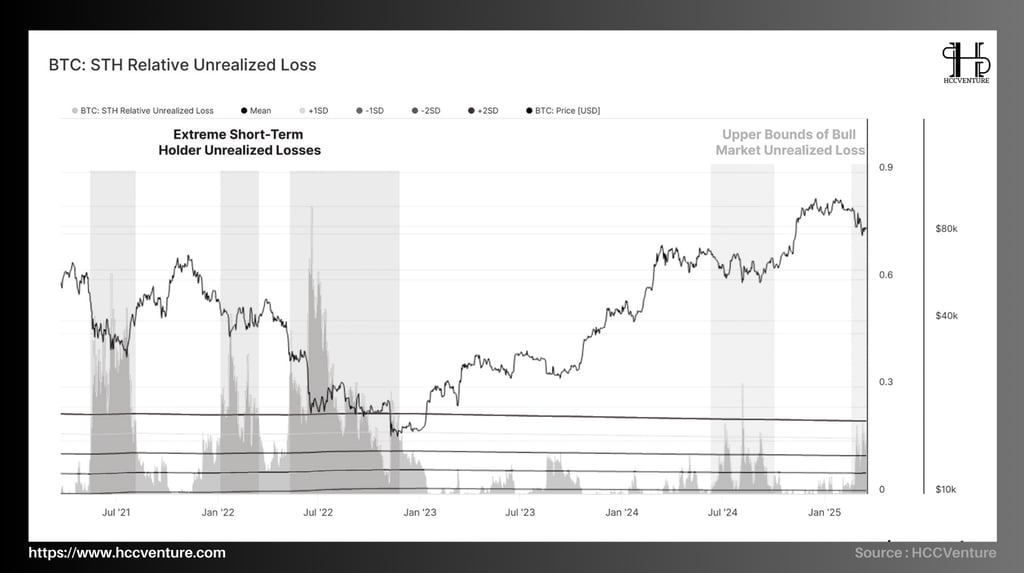
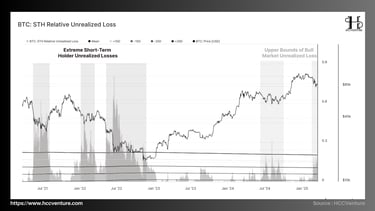
The unrealized loss index measures the actual loss that investors are suffering, calculated as the difference between the purchase price and the current market price of the coins they hold. The data shows:
The recent price decline (from $97,000 to $82,000 as of March 24, 2025) has pushed a large number of STH group coins into an "underwater" state, meaning their current value is lower than their purchase price.
The STH group's relative unrealized loss is approaching +2σ (second standard deviation), an alarming level indicating significant financial stress.
The increase in unrealized losses near +2σ indicates that the STH group is under significant financial pressure. These investors – who usually buy during the recent high price period (e.g., $97,000 area) – now face the risk of selling off to cut losses, especially when market liquidity is tight (Hot Supply is down more than 50%, Exchange Inflows are down 54%). This could increase price volatility in the short term.
Although unrealized losses are high, the data shows:
The scale of the current STH group's financial losses is equivalent to the yen-carry-trade strategy's pullback on August 5, 2024, when the market also witnessed strong selling pressure from short-term investors.
This level is also within the upper-bound of previous bull cycles, suggesting that this is not an unusual situation in Bitcoin market history.
However, compared to major sell-offs like May 2021 or the 2022 bear market, the current unrealized loss is significantly less severe .
If the STH group begins to liquidate positions to cut losses, selling pressure in the spot market could push Bitcoin price to lower support levels (e.g., $75,000). However, since the size of unrealized losses is not as extreme as in previous periods, this scenario may not result in a deep crash.

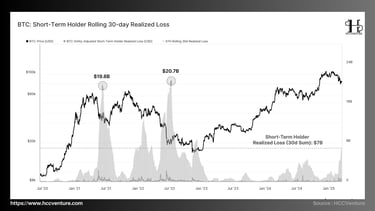
When looking at the rolling 30-day sum of the Short-Term Holders (STH) group, we see a significant wave of capitulation from this group under strong bearish pressure.
This trend provides insight into the level of financial stress in the context of Bitcoin's price falling from $97,000 to $82,000 (as of March 24, 2025). Specifically:
The STH group’s total 30-day losses now stand at $7 billion , marking the largest sustained loss event in the current bull run.
This reflects a large number of new investors who have capitalized – or sold assets at a loss – under strong downward pressure from the peak of $97,000.
This event shows that the STH group, which has often bought at recent highs, is suffering heavily as the market corrects. While a loss of $7 billion is significant in the current cycle, it is worth noting:
This is still much smaller than major capitulation events in history, such as the May 2021 sell-off (when prices fell from $58,000 to $30,000) or the 2022 bear market (when prices bottomed below $20,000).
Even compared to the yen-carry-trade pullback on August 5, 2024, the current loss has not reached the same severity in absolute or relative terms.
This capitulation event, while large in cycle terms, is not enough to trigger a crash as deep as 2021-2022. However, it could still increase short-term volatility, especially if selling pressure from the STH group continues to push Bitcoin price to lower support levels.
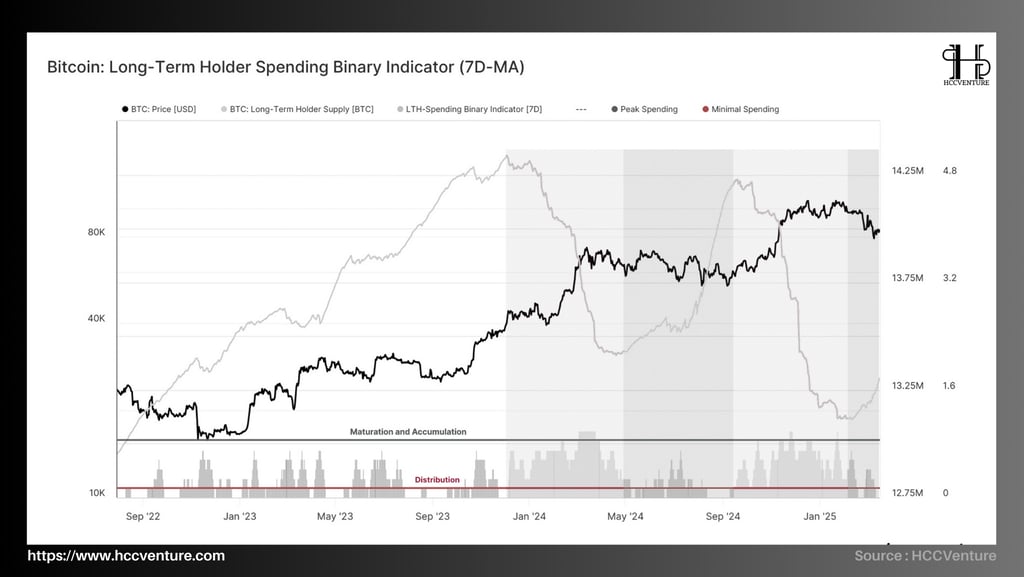
While the Short-Term Holders (STH) group is under great pressure from the recent price drop, the Long-Term Holders (LTH) group is showing a completely different picture. As the Bitcoin price fell from $97,000 to $82,000 (as of March 24, 2025), onchain data shows that the LTH group is not only holding its position but also showing signs of easing selling pressure.
The Binary Spending Indicator is designed to detect when the LTH team spends a significant portion of their coin holdings on a consistent basis. Currently:
This index is slowing down and pulling back , showing that spending pressure from the LTH group has decreased significantly.
This implies that the LTH team is no longer actively selling or distributing coins as in previous phases.
After months of decline, the supply of the LTH (Long-Term Holder supply) group has started to increase . This is a sign that:
A number of coins previously in the STH group have been transferred to the LTH group when they exceed the holding period threshold (usually 155 days according to common standards).
LTH group is tending to accumulate or hold coins instead of liquidating, despite the bearish trend of the market.
The decline in the Binary Spending Indicator and the increase in LTH supply indicate that long-term investors are shifting from sell-side distribution to holding .
This reflects a more confident sentiment in Bitcoin's long-term prospects, even as the market faces short-term bearish pressure. The LTH team appears to view the current correction as an opportunity to consolidate positions rather than take profits or cut losses.
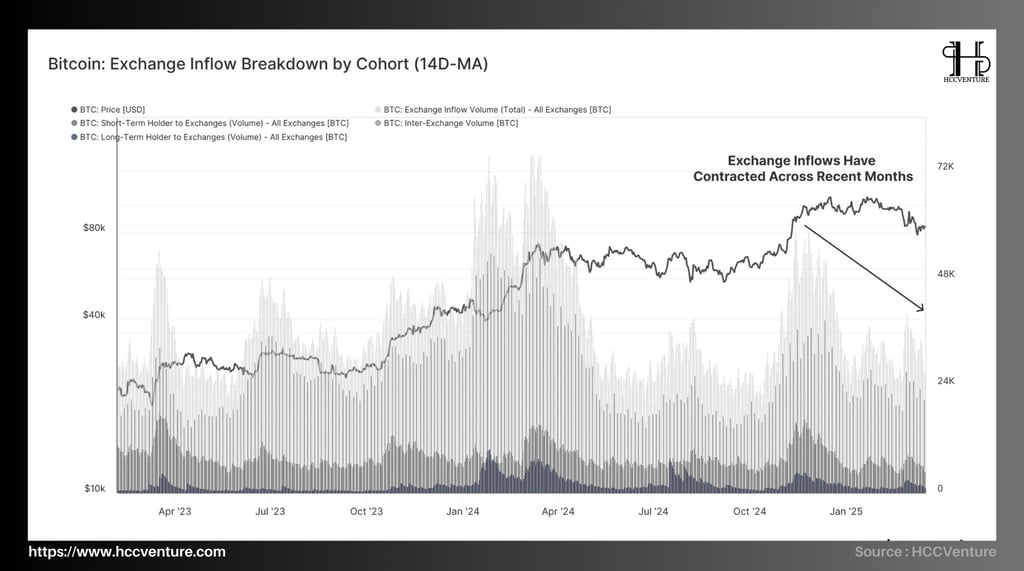

The similarity in the contraction between Hot Supply and Exchange Inflows suggests that demand-side pressure is weakening across the board. As the number of coins available for trading declines and exchange inflows become less abundant, the likelihood of Bitcoin quickly recovering to previous highs (e.g., $97,000) becomes slimmer.
Capital flows into exchanges across the market have fallen sharply recently. Specifically:
At the market peak, the average inflow was +58,600 BTC/day .
Currently, this number is only +26,900 BTC/day , corresponding to a decrease of more than -54% .
This decline reflects the fact that investors are reducing their Bitcoin deposits to exchanges – a behavior that is often associated with the intention to sell, take profits or trade short-term. As capital flows decrease, potential selling pressure also decreases, but it also shows a lack of new buying demand to push prices up.
Notably, the contraction in exchange inflows (-54%) closely parallels the decline in the Hot Supply index (from 5.9% to 2.8%, or more than 50%). Both indicators reflect a common trend: a weakening of demand pressure in the market . As the amount of “hot” coins (Hot Supply) available for trading decreases, and the amount of Bitcoin deposited on exchanges also decreases, the market loses a significant amount of momentum from buyers.
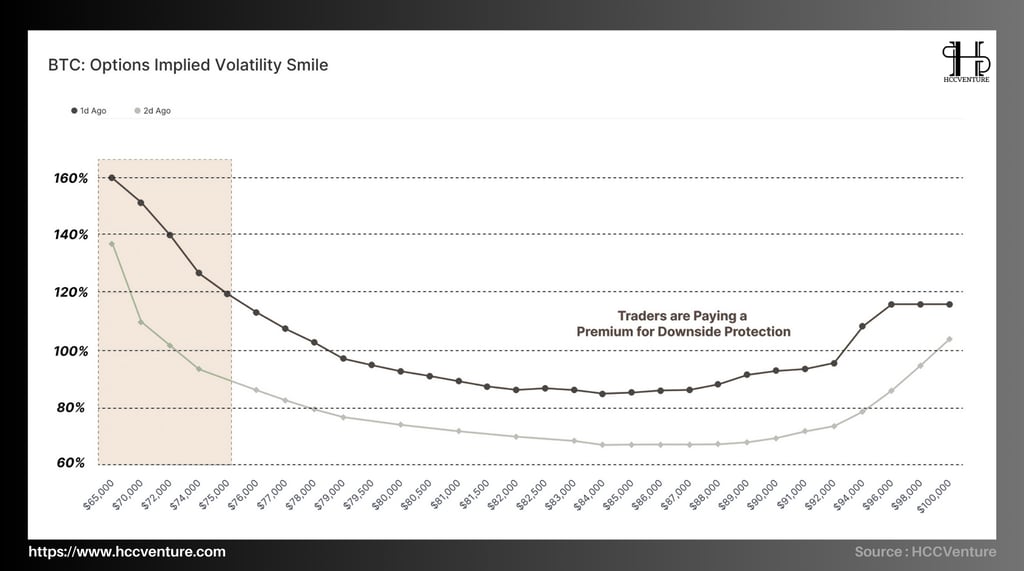
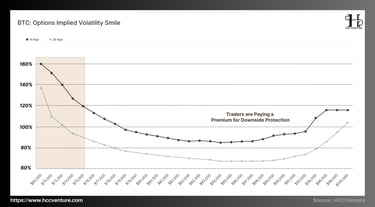
The Volatility Smile index represents the implied volatility premium that investors pay for calls or puts at different strike prices. Currently, the data shows:
The implied volatility premium for puts is significantly higher than that for calls.
This suggests that the cost of downside protection is high, reflecting strong demand from institutional investors to hedge against a decline in Bitcoin prices.
This difference in Volatility Smile is not only a result of supply and demand in the options market, but also reflects current market sentiment:
Investors are willing to pay a premium to buy put options to protect their portfolios against the possibility of Bitcoin prices falling further from $82,000.
Conversely, lower premiums for call options indicate waning short-term bullish expectations, consistent with the recent market downtrend.
The increase in put option premiums is a clear sign of cautious, even bearish, sentiment among institutional investors. This is consistent with other on-chain indicators such as the contraction of Hot Supply (from 5.9% to 2.8%) and the decrease in exchange inflows (-54%), suggesting that the market is moving towards a neutral equilibrium with a tendency to protect capital rather than seek short-term profits.
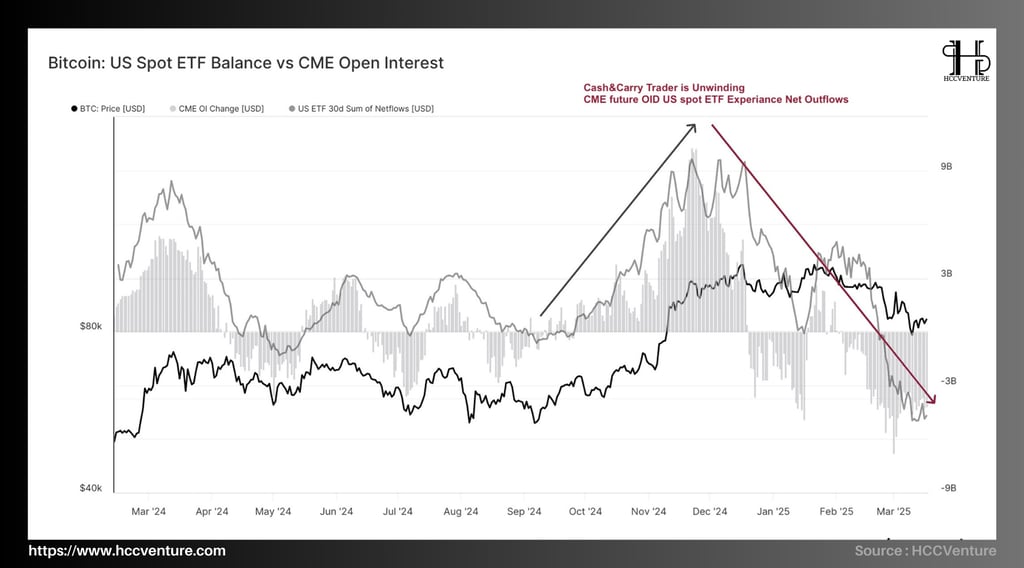
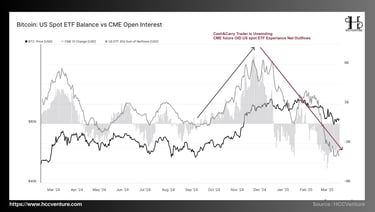
The launch of US Spot Bitcoin ETFs in 2024 has opened up a huge opportunity for institutional investors to participate in a highly regulated cash-and-carry trading strategy by combining long positions in spot ETFs with short positions in futures contracts on the CME Group exchange.
As the long-side bias in the market begins to cool – for example, Bitcoin’s price fell from $97,000 in late February to $82,000 on March 24, 2025 – institutional investors appear to be pulling back from their cash-and-carry strategy. This is evidenced by:
Large outflows from spot ETFs, indicating investors are selling ETFs to close out long positions.
There was a corresponding drop in Open Interest on CME futures, as short positions were also liquidated.
Closing these positions requires selling the ETF in the spot market, while simultaneously buying back futures contracts to close the short position.
The retreat from cash-and-carry strategies is exacerbating the current bearish trend in Bitcoin. As institutional investors sell ETFs to close positions, selling pressure in the spot market increases, especially in a context where liquidity has shrunk (Hot Supply is down more than 50%, Exchange Inflows are down 54%). This could push Bitcoin to test lower support levels, such as $75,000, in the short term.
Evaluation and Conclusion
The digital asset market is experiencing a marked decline in speculative activity, with investors increasingly cautious and risk-averse. This trend is reinforced by data from both the onchain and derivatives markets, along with mixed reactions from two main investor groups: Short-Term Holders (STH) and Long-Term Holders (LTH). The following is a summary of the conclusions based on previous analysis.
The liquidity squeeze is reflected in the Hot Supply index dropping by more than 50% (from 5.9% to 2.8% of circulating supply) and the exchange inflows dropping by 54% (from 58,600 BTC/day to 26,900 BTC/day). This shows that investors' appetite for trading and speculation has weakened significantly.
The retreat of the cash-and-carry strategy (inflows from spot ETFs and reduced Open Interest on CME) further reinforced the trend of decreasing liquidity, while putting additional pressure on the spot price of Bitcoin (down from $97,000 to $82,000 as of March 24, 2025).
The Volatility Smile Index shows that implied volatility premiums on puts are higher than calls, reflecting the premium on downside protection. This signals bearish sentiment and strong defensive demand from institutional investors.
Short-Term Holders (STH) are experiencing the largest losses in the current cycle, with 30-day losses reaching $7 billion – a significant capitulation event . Unrealized losses near +2σ indicate high financial stress, reflecting fear and selling pressure to cut losses.
The digital asset market is entering a cautious phase, with a decline in speculative activity and shrinking liquidity in both on-chain and derivatives. The drop in Bitcoin price from $97,000 to $82,000 reflects a risk-off sentiment, reinforced by high premiums for downside protection in the options market. While Short-Term Holders are under pressure with a $7 billion loss and capitulation behavior, Long-Term Holders are holding their positions, reducing selling and increasing accumulation – creating an important buffer against the decline.
Join the HCCVenture community to get the latest market information. Once again, we give our opinion on potential projects in the crypto market. This is not investment advice, consider your portfolio. Disclaimer: The views expressed in this article are solely those of the author and do not represent the platform in any way. This article is not intended to be a guide to making investment decisions.
API & Data : Glassnode
Compiled and analyzed by HCCVenture
Join our telegram community: HCCVenture
Explore HCCVenture group
HCCVenture © 2023. All rights reserved.


Connect with us
Popular content
Contact to us
E-mail : sp_contact@hccventure.com
Register : https://linktr.ee/holdcoincventure
Disclaimer: The information on this website is for informational purposes only and should not be considered investment advice. We are not responsible for any risks or losses arising from investment decisions based on the content here.
TERMS AND CONDITIONS • CUSTOMER PROTECTION POLICY
ANALYTICAL AND NEWS CONTENT IS COMPILED AND PROVIDED BY EXPERTS IN THE FIELD OF DIGITAL FINANCE AND BLOCKCHAIN BELONGING TO HCCVENTURE ORGANIZATION, INCLUDING OWNERSHIP OF THE CONTENT.
RESPONSIBLE FOR MANAGING ALL CONTENT AND ANALYSIS: HCCVENTURE FOUNDER - TRUONG MINH HUY
Read warnings about scams and phishing emails — REPORT A PROBLEM WITH OUR SITE.