


On-chain analysis week 11/2025: Bitcoin enters distribution phase?
Panic selling is increasing. STH-SOPR has fallen below 1, indicating that short-term investors are selling at a loss, reflecting the increasing level of panic. Bitcoin is facing high selling pressure, weak capital flows, and short-term investors' panic. If there are no signs of strong accumulation, the risk of a deeper correction remains.
PHÂN TÍCH
3/18/202512 min read
Market Summary
The Bitcoin sell-off has been going on for the first 10 weeks of 2025, and shows no signs of stopping. A small part of the impact on STH sentiment comes from the US president's imposition of tariffs on neighboring countries.
At Bitcoin's ATH, there were signs of profit-taking from LTH, which was clearly shown in on-chain analysis articles in the last weeks of 2024 at HCCVenture. LTH's profit of over %200 has affected the psychology of profit-taking and created a new distribution trend for a new wave season to take place.
The STH-CDD index shows strong selling pressure from Short-Term Holders, reflecting increased fear . However, historically, high STH-CDD peaks often appear near local bottoms , signaling that the market may soon enter a balance zone.
Investors need to monitor the development of STH-CDD along with other indicators such as STH-SOPR and the support zone of $75,000 - $78,000 to determine the possibility of a bottom.
Currently, the liquidity zone at $70,000 to $85,000 is very large and also has many price lines oscillating within this range. This can be seen when an area continuously touches an important support zone, it will help long-term investors accumulate in these price zones. With this distribution and accumulation, Bitcoin can move sideways for the next 3-5 months before a big wave occurs in the market.
Since March 2025, new money flow has not been strong enough to absorb selling pressure . This reversal shows that new investors are hesitant and are no longer willing to buy the bottom as strongly as before. This means that the probability of a deeper correction is increasing .
On-chain metrics analysis
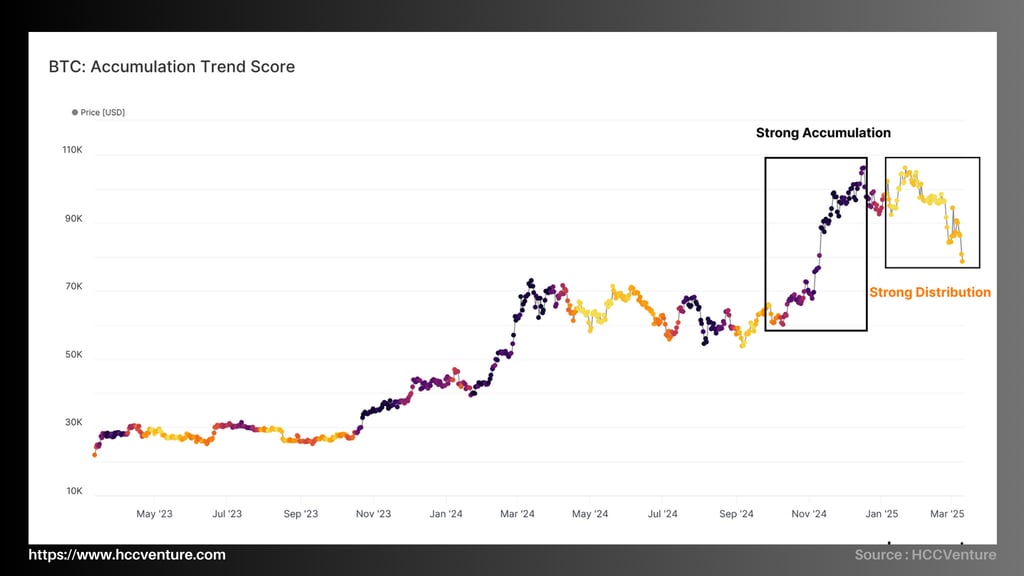
Bitcoin operates in cycles of accumulation and distribution, with capital constantly shifting between groups of investors. The Accumulation Trend Score is an important tool for tracking this change, with a value near 1.0 (dark purple) indicating a strong accumulation phase and a value near 0.0 (light yellow) indicating high distribution pressure.
Bitcoin market history shows that after each accumulation cycle, a distribution phase occurs, often accompanied by price weakness. This phase reflects profit-taking from long-term investors or capital flows to other assets.
Accumulation Phase 2023-2024: Throughout 2023, the Accumulation Trend Score remains high (>0.7), indicating strong accumulation activity from institutions and whales. This coincides with the price rally from $30,000 to $108,000 by the end of 2024.
Distribution Phase from January 2025: Moving into 2025, Bitcoin faces significant profit-taking pressure. The sharp correction from $108,000 to $93,000 coincides with the Accumulation Trend Score dropping below 0.1 , signaling selling dominance.
Currently, this index remains at a very low level, showing that selling pressure has not shown any signs of decreasing, while also demonstrating cautious market sentiment in the face of macroeconomic fluctuations and monetary policy.
Selling pressure is still dominating the market: The Accumulation Trend Score remaining below 0.1 reflects that investors have not made significant re-accumulation moves, meaning that the market may continue to correct or move sideways before entering a new growth cycle.
Key Level to Watch: If Bitcoin continues to decline and retests the $88,000-$92,000 zone , the price reaction at this area will determine whether the market can enter a new accumulation phase. If selling pressure continues and on-chain indicators do not show signs of recovery, Bitcoin could retest deeper support zones.
Catalyst for the next bull cycle: For the market to recover, there needs to be signs of net buying from Long-Term Holders or an increase in cash flow into the market through ETFs, stablecoins or institutional capital.
The Bitcoin market is currently in a strong distribution phase, with selling pressure still dominant. The Accumulation Trend Score remaining low for a long time shows the cautious sentiment of investors. In the short term, the risk of a deeper correction is still present, unless there is a large capital flow back into the market. Investors should closely monitor important support zones and reversal signals from on-chain money flows before determining the next strategy.
Accumulation Trend Score is an indicator that tracks the relative change in the total Bitcoin balance on the chain, helping to identify accumulation or distribution trends. When the value is close to 1.0 , the market records strong net buying activity from large investors. Conversely, when the index approaches 0.0 , selling pressure dominates.
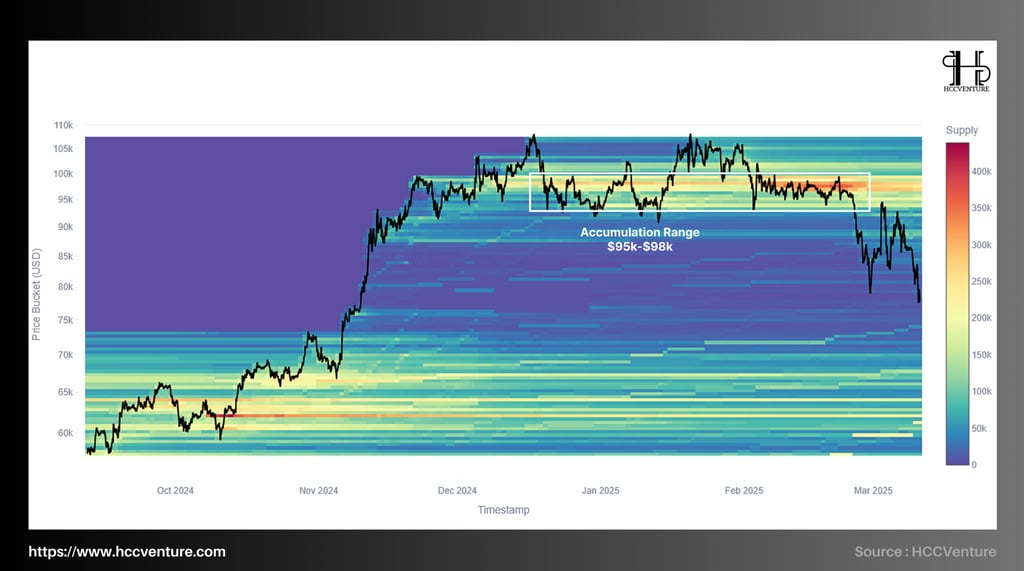
However, one of the major limitations of the Accumulation Trend Score is the bias by large entities (whales, organizations) , which does not accurately reflect where Bitcoin is accumulated. Therefore, to get a more detailed view of important price zones, the Cost Basis Distribution (CBD) Heatmap is used to identify the price levels where supply is concentrated, thereby predicting support or resistance zones.
Data from the CBD Heatmap shows that the market has been consolidating strongly at key price zones between mid-December 2024 and late February 2025 , especially around $95,000 - $98,000 .
Investors consider this an attractive price range to buy, showing confidence in the long-term uptrend .
This could be an important support zone where bulls will try to defend against deep corrections.
Risk if price falls below $65,000 - $70,000?
If Bitcoin fails to sustain above this accumulation zone, the possibility of a major sell-off could emerge due to loss of investor confidence.
The $88,000 - $92,000 area could then become the market's next test point.
Current trends:
Cash flow is still concentrated in important price zones , showing that investor confidence has not been broken.
Strong corrections may just be a breather before the uptrend resumes, as in previous cycles.
Risks to note:
If the demand at $95,000 - $98,000 weakens, Bitcoin could retest the lower support zone.
Selling pressure from Short-Term Holders may increase if prices fall sharply below this support zone.
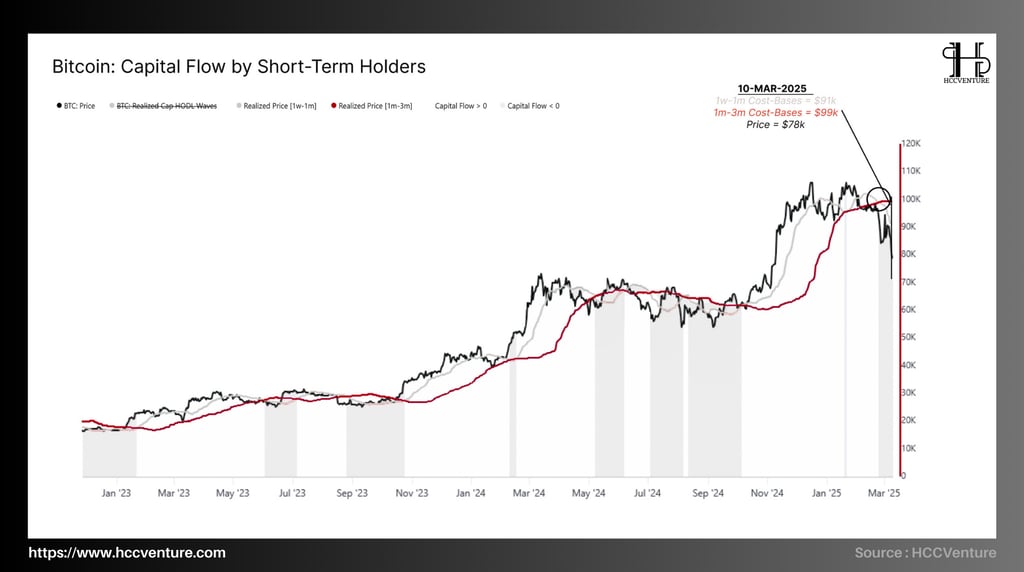
Based on the CBD Heatmap and Accumulation Trend Score , it can be seen that Bitcoin has not recorded significant accumulation since the end of February 2025. To understand this development more deeply, we analyze two groups of Short-Term Holders (STH):
1w–1m Holders : Investors who bought BTC in the last 7 - 30 days.
1m–3m Holders : Investors who bought BTC in the last 1-3 months.
During periods of abundant capital inflow , the capital price of the 1w–1m group is often higher than that of the 1m–3m group. This shows that new investors are willing to buy BTC at high prices , reflecting optimistic sentiment and positive market momentum.
However, since early 2025 , this trend has begun to weaken and flatten, signaling that demand is slowing down . BTC Price Drops Below $95,000: Signal of Capital Outflows
When BTC fell below $95,000, the cost of capital for the 1w–1m group fell below the 1m–3m group .
This is an important sign of net capital outflows , confirming a weakening in fresh buying momentum.
Transition from post-ATH euphoria to caution
In the previous period, the market maintained a "buy-the-dip" mentality , which helped support BTC prices.
However, since March 2025, new money flow has not been strong enough to absorb selling pressure .
This reversal shows that new investors are hesitant and are no longer willing to buy the bottom as strongly as before. This means that the probability of a deeper correction is increasing .
BTC needs to maintain the capital price of the 1w–1m group higher than the 1m–3m group , reflecting the new cash flow returning to the market. The recovery momentum will only be truly sustainable when BTC regains the $95,000 - $98,000 zone , showing the return of accumulation demand.
With Bitcoin in a post-ATH distribution phase, the fear level of short-term investors (STH) becomes a key indicator of seller exhaustion.
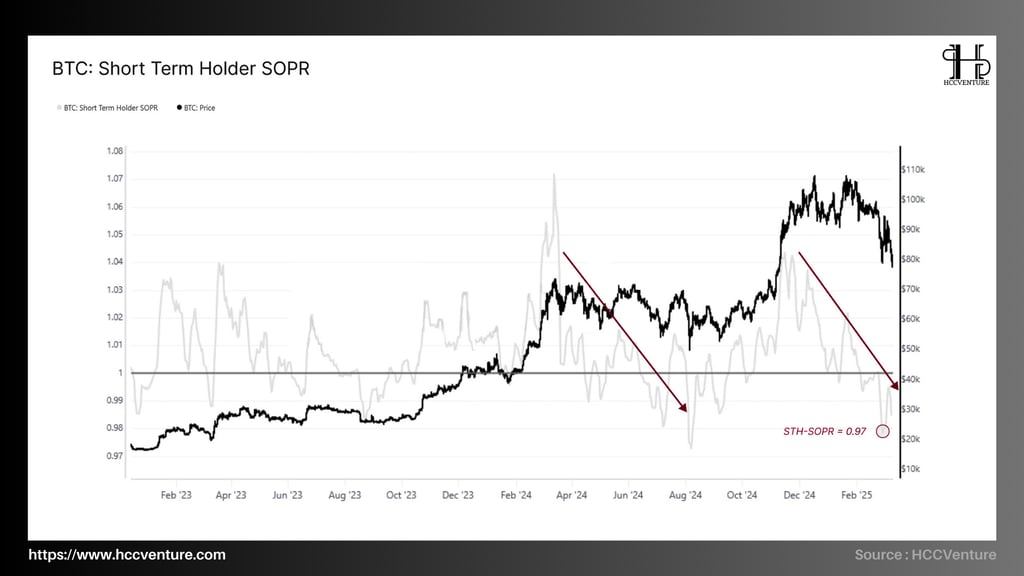
The key metric in this analysis is the Short-Term Holder Spent Output Profit Ratio (STH-SOPR) , which measures whether STH is selling BTC at a profit (SOPR > 1) or loss (SOPR < 1).
STH-SOPR Trend:
Since BTC price dropped below $95,000 , the 196-hour moving average of STH-SOPR has remained below 1 , signaling that the majority of short-term investors are accepting losses .
During the most stressful times, STH-SOPR dropped to 0.97 as BTC price plunged to $78,000 , indicating that panic was dominating the market.
Signs of panic selling: SOPR remaining below 1 for a long time reflects a widespread loss-taking trend among new investors. The more investors sell at a loss , the weaker the selling pressure will be over time, as the amount of BTC that is vulnerable to liquidation will gradually dry up.
Potential for a Local Bottom: These extreme sell-off conditions are often accompanied by seller exhaustion , opening up opportunities for long-term investors to re-accumulate BTC at low prices. History shows that sharp declines in STH-SOPR to lows (below 0.98) often coincide with short-term market bottoms.
If the STH-SOPR continues to decline and remains below 0.98 , the selling pressure could persist. This could lead to an extended accumulation phase or BTC retesting the $75,000 - $78,000 support level .
If STH-SOPR recovers above 1 , it means STH is starting to sell off with profits , indicating an improvement in market sentiment. A strong reversal could occur if BTC breaks back above the $92,000 - $95,000 zone , signaling a return of buying pressure.
Market sentiment is extremely sensitive, as Short-Term Holders are selling at a loss across the board . Although selling pressure remains high, signs of seller exhaustion may appear in the near future , opening up opportunities for a reversal.
Long-term investors can closely monitor the performance of STH-SOPR and the $75,000 - $78,000 price range to look for re-accumulation opportunities .
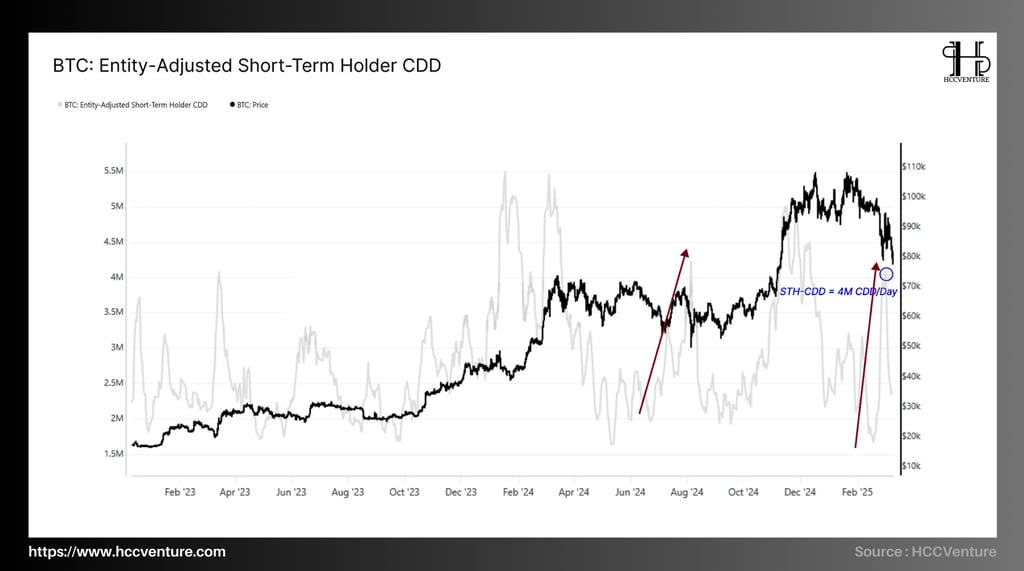
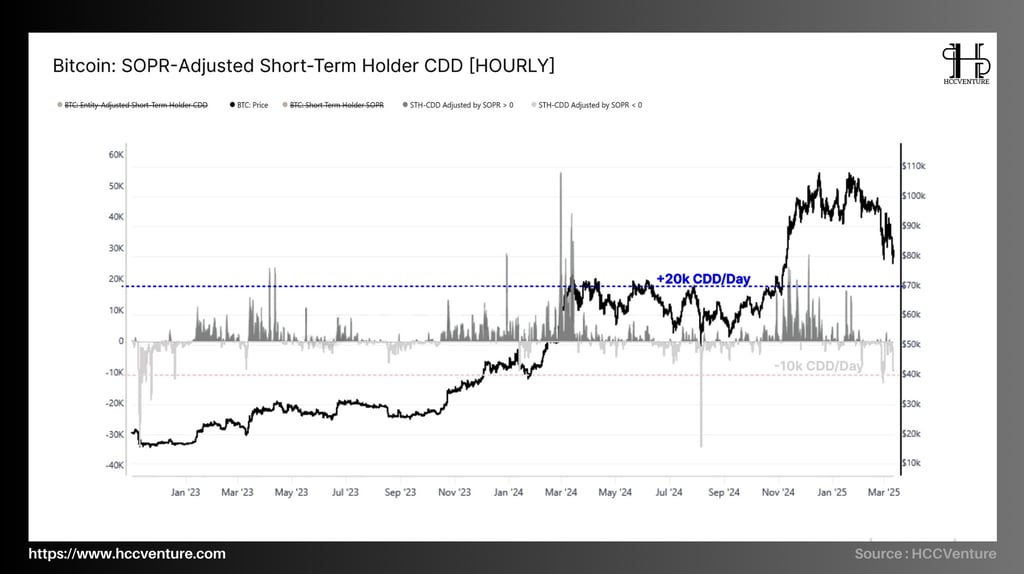
STH-CDD measures the economic weight of BTC spent by the short-term investor pool (STH) , by combining both BTC transaction volume and holding period before sale .
When STH-CDD spikes , this shows that short-term investors who have been holding BTC for a significant period of time are selling en masse .
Particularly during strong market downtrends , a spike in STH-CDD is a sign of capitulation , when the STH group accepts to sell off BTC in panic.
STH-CDD developments in Q1/2025:
During recent sharp declines, STH-CDD has had sharp spikes , reflecting the panic selling sentiment of short-term investors .
Notably, as Bitcoin fell from $95,000 to $78,000 , the STH-CDD index recorded one of its highest levels since the beginning of the bull cycle , confirming the capitulation of many new investors .
Historically, high STH-CDD peaks have coincided with extreme sell-offs before the market made a local bottom .
For example, in early 2022 and November 2022, STH-CDD also increased sharply when BTC fell sharply, signaling maximum selling pressure.
If STH-CDD continues to hold high for an extended period, BTC may not reach its strongest support zone yet. This could lead to a deeper drop to the $75,000 - $78,000 zone before buying power returns.
Positive case:
If STH-CDD starts to decline , this shows that the selling pressure from short-term investors is weakening, opening up an opportunity to accumulate BTC. If combined with STH-SOPR recovering above 1, BTC could form a bottom and head towards the $92,000 - $95,000 zone .
The STH-CDD index shows strong selling pressure from Short-Term Holders, reflecting increased fear . However, historically, high STH-CDD peaks often appear near local bottoms , signaling that the market may soon enter a balance zone.
Investors need to monitor the development of STH-CDD along with other indicators such as STH-SOPR and the support zone of $75,000 - $78,000 to determine the possibility of a bottom.
To get a more accurate view of the extent of the panic selling , it is worth checking out some other indicators:
Short-Term Holder Coin Days Destroyed (STH-CDD): Measures the level of selling by short-term investors.
Short-Term Holder SOPR (STH-SOPR): Determines whether this group is selling at a profit or loss.
If SOPR_STH > 1 , BTC is sold at a profit, indicating that the market still has positive momentum.
If SOPR_STH < 1 , BTC is sold at a loss, indicating panic is dominating the market .
Current Status: The metric just dropped to -12.8K coin days per hour , reflecting a massive loss realization . This is the lowest level since August 2024 , when Bitcoin plunged to $49K due to macro uncertainty .
Compared to previous cycles:
August 2024: The index hits a similar low as BTC plummets amid market fears of a global recession.
May 2021: A similar drop occurred as BTC fell from $64K to $30K, signaling a deep correction period.
Signals from historical data:
When this index bottoms, the market usually enters a recovery or accumulation phase before new bullish momentum emerges .
If this index continues to remain at extremely low levels, BTC may continue to correct to the $75K - $78K zone . Selling pressure may persist if there are no strong buy signals from long-term groups.
If the index recovers from the current bottom, BTC may have reached a strong support zone . It is necessary to monitor more accumulation signals from whales and long-term investors to confirm the recovery trend.
The STH-CDD Adjustment Index is reflecting the strongest panic sell-off since August 2024, which could be a sign of a capitulation phase in the market.
If following the previous cycle, the market may enter an accumulation phase after a sharp decline , but it is necessary to monitor the movements of whales and long-term holders to confirm the recovery trend.
Short-Term Holders (STHs) play an important role in determining market bottoms, as they are often sensitive to price fluctuations and tend to sell off when the market falls sharply.
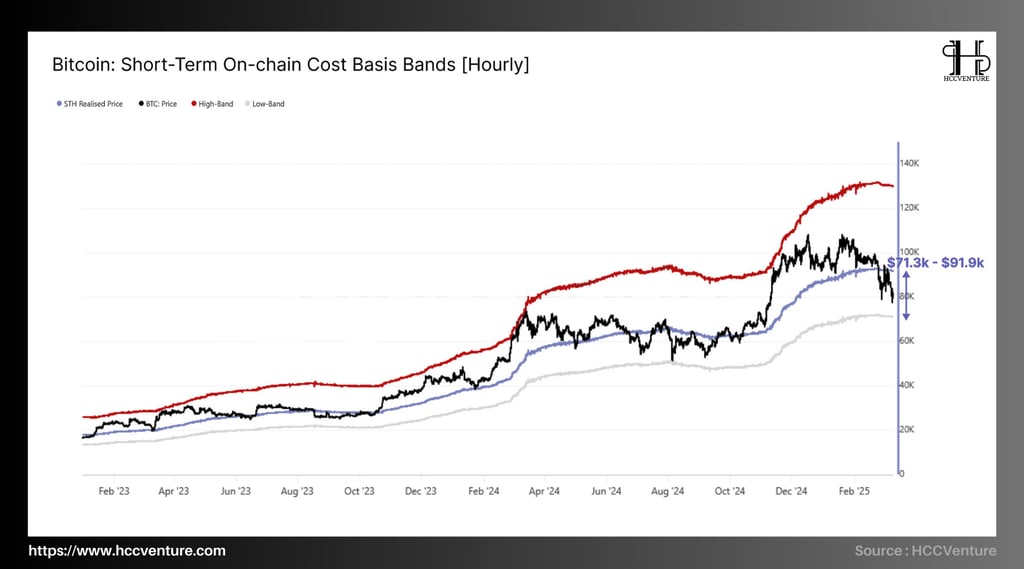
STH Cost Basis Index:
Is the average price at which short term investors bought BTC.
When the market price falls below this level, the STHs group begins to fall into an "underwater" state (negative equity), increasing selling pressure.
STH Cost Basis statistical analysis helps estimate potential support levels during corrections.
The lower boundary of the STH Cost Basis —the price at which most short-term investors are in a losing position— is in the $71.3K - $91.9K area . This area coincides with the $70K - $88K liquidity gap , meaning there is a high probability that the price will find temporary support here.
If BTC falls to near $71K , this would mean that a majority of STHs would be liquidated or cut, possibly leading to a final sharp sell-off before the market bottoms.
If the price recovers above $91.9K , this shows that STHs have started to regain confidence, helping the market enter an accumulation phase.
The market is currently testing the important support zone of $71.3K - $91.9K, which reflects the "underwater" status of short-term investors.
This price zone could be a temporary bottom , but if selling pressure continues to increase, a stronger correction could take BTC closer to $70K before finding solid support.
The coming period will be a test of investor sentiment and confidence. Monitoring the movements of whales and capital flows into the market will be key to determining the next trend.
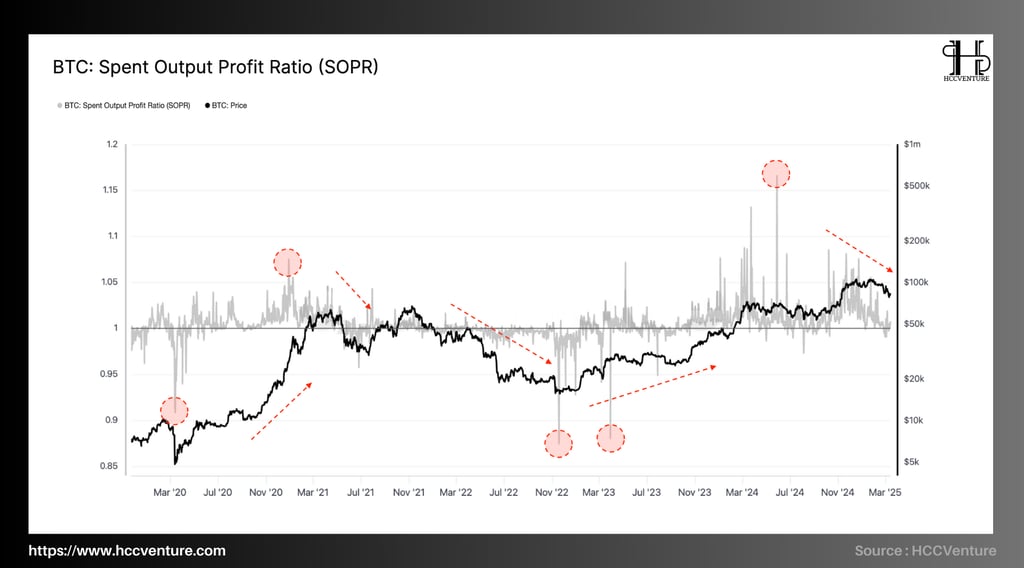

Spent Output Profit Ratio (SOPR) is a measure of profit or loss when BTC coins are spent. A SOPR value > 1 indicates that investors are selling at a profit, while a SOPR < 1 reflects selling at a loss. Analyzing this index helps determine market sentiment and Bitcoin's capital cycle.
2020 – Accumulation phase and the beginning of the uptrend cycle:
Q1/2020: During the sharp market decline due to the impact of the COVID-19 pandemic (March 2020), SOPR fell deeply below 1, indicating selling pressure from panicked investors.
Q2–Q3/2020: Since mid-2020, SOPR has gradually recovered and remained above 1, reflecting positive sentiment as Bitcoin begins a new bull cycle.
Q4/2020: SOPR continues to hold above 1, indicating slight profit-taking as BTC crosses $20,000 towards the end of the year. However, selling pressure is not strong enough to reverse the uptrend.
2021 – Peak of excitement and strong correction:
Q1/2021: SOPR spiked as BTC crossed $40,000 and hit $60,000 in April. This period represented euphoria, as many investors locked in profits at high levels.
Q2/2021: May 2021 marked a strong correction when BTC fell from $64,000 to $30,000 . SOPR dropped deeply to below 1, showing that many investors sold at a loss or exited their positions due to panic.
Q3–Q4/2021: After a sharp decline, SOPR gradually recovered as BTC bottomed around $30,000 and returned to profit levels as BTC re-established a new peak in November 2021 (near $69,000 ). However, SOPR did not stay above 1 for long, reflecting increasing selling pressure as the market entered a distribution phase.
Evaluation and Conclusion
Bitcoin’s market structure has shifted to a post-ATH (All-Time High) distribution phase , characterized by a weakening in overall demand and continued selling pressure from investors who bought at recent highs. Several key indicators indicate this trend:
Since early January , the Accumulation Trend Score has remained near 0.1 , indicating very limited accumulation activity and a market dominated by sellers. Historically, such low values indicate a lack of confidence from buyers , reinforcing bearish market sentiment.
STH's cost basis analysis shows that market momentum has turned negative , with outflows exceeding inflows . As Bitcoin's price fell below $95k , short-term investors began to sell off, reflecting a shift in sentiment from bullish buying at the bottom to capital preservation .
The Short-Term Traders' Spending Output Ratio (STH-SOPR) is consistently trading below 1 , indicating that short-term traders are selling at a loss .
Join the HCCVenture community to get the latest market information. Once again, we give our opinion on potential projects in the crypto market. This is not investment advice, consider your portfolio. Disclaimer: The views expressed in this article are solely those of the author and do not represent the platform in any way. This article is not intended to be a guide to making investment decisions.
API & Data : Glassnode
Compiled and analyzed by HCCVenture
Join our telegram community: HCCVenture
Explore HCCVenture group
HCCVenture © 2023. All rights reserved.


Connect with us
Popular content
Contact to us
E-mail : sp_contact@hccventure.com
Register : https://linktr.ee/holdcoincventure
Disclaimer: The information on this website is for informational purposes only and should not be considered investment advice. We are not responsible for any risks or losses arising from investment decisions based on the content here.

TERMS AND CONDITIONS • CUSTOMER PROTECTION POLICY
ANALYTICAL AND NEWS CONTENT IS COMPILED AND PROVIDED BY EXPERTS IN THE FIELD OF DIGITAL FINANCE AND BLOCKCHAIN BELONGING TO HCCVENTURE ORGANIZATION, INCLUDING OWNERSHIP OF THE CONTENT.
RESPONSIBLE FOR MANAGING ALL CONTENT AND ANALYSIS: HCCVENTURE FOUNDER - TRUONG MINH HUY
Read warnings about scams and phishing emails — REPORT A PROBLEM WITH OUR SITE.