


On-chain analysis week 10/2026: Potential for market stability amidst macroeconomic uncertainty
Bitcoin is entering a crucial transitional phase in its market cycle, where correction pressure persists but initial signs of stabilization are beginning to emerge.
3/18/202610 min read
Market Summary
Bitcoin is currently trading within a prolonged narrow range, and indicators related to capital flows, spending behavior, and derivative positioning are showing a shift from a defensive to a rebalancing phase. For over a month, Bitcoin has maintained a consolidation phase within the $62,800–$72,600 price range , with several failed attempts to reach the $70,000 mark .
In previous cycles, a prolonged SOPR (Severity Rate Percentage) < 1 typically reflected that the market had not yet completed its psychological rebalancing process and needed more time to build a price base. Notably, short-term rallies often brought the SOPR close to 1, but were quickly rejected, indicating that break-even selling pressure remained the dominant factor in market behavior.
A notable positive point in recent data is the improvement in institutional capital flows through US Spot Bitcoin ETFs . After weeks of net outflows, the 7-day moving average of ETF flows has returned to positive territory , indicating a recovery in demand from institutional investors.
Simultaneously, data from the Spot Cumulative Volume Delta (CVD) also shows that buying pressure is gradually returning. Investors are beginning to absorb the selling liquidity on major exchanges, marking a shift from a state of dominant selling pressure to a more balanced state.
However, this very state creates a market structure with the potential for reversal. When short positions become crowded, any increase in spot demand can trigger a short squeeze , forcing sell positions to close and thereby amplifying the upward momentum.
Analyzing on-chain metrics
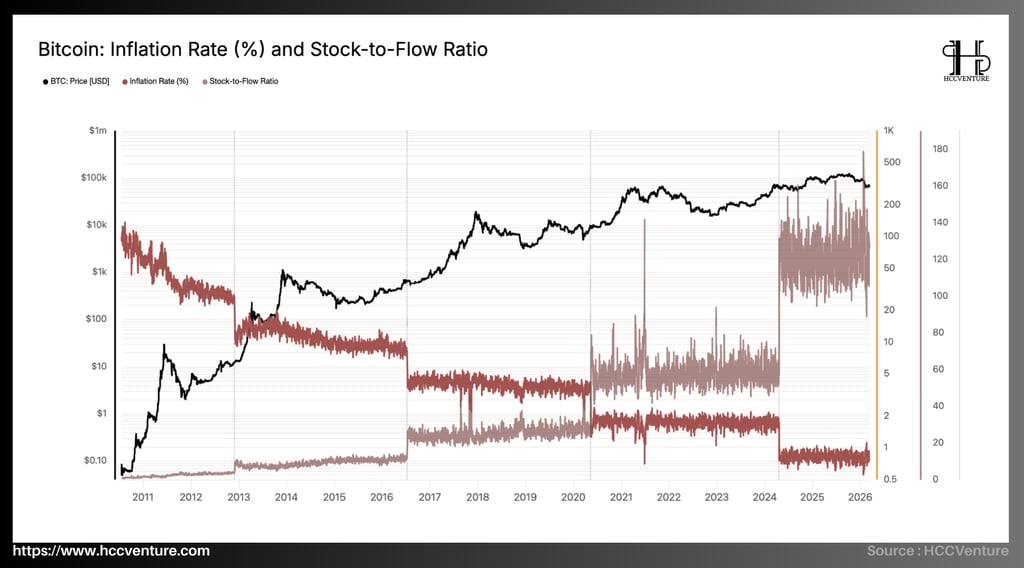

The book "Bitcoin Inflation Rate (%) and Stock-to-Flow Ratio" provides a fundamental perspective on the long-term pricing mechanism of Bitcoin, through the relationship between the supply inflation rate and the Stock-to-Flow (S2F) ratio .
The systematic decline in supply inflation after each halving cycle has altered the economic nature of Bitcoin, shifting it from a growth asset to a deflationary -like asset , with the pressure of new supply weakening over time. This is a core factor shaping the long-term upward trend of its price.
Currently, Bitcoin's annual inflation rate has fallen to approximately 0.85%–0.95% following the most recent halving event. This is the lowest level in the network's entire operating history. Compared to previous periods:
Period 2011–2012: inflation > 25%
After the 2012 halving: a decrease to approximately 10–12%.
After the 2016 halving: a decrease to approximately 4–5%.
Or halving 2020: ~ 1.7–2%
Currently (after halving 2024): <1%
This stepwise decline is not random but pre-programmed into Bitcoin's issuance mechanism. This creates a predictable supply-down trajectory, in stark contrast to traditional monetary systems.
In parallel with the decline in inflation, Bitcoin's Stock-to-Flow (S2F) ratio has risen to approximately 120–160 in the current period, approaching that of top scarce assets like gold. Stock-to-Flow measures the ratio between the total current supply (stock) and the annual supply issued (flow). As flow decreases, S2F increases, reflecting a growing level of scarcity.
This reflects the diminishing returns principle – returns decrease with market size. However, the important point is that even with declining returns, the scarcity structure continues to strengthen. Currently, with inflation below 1% and S2F at historically high levels, Bitcoin possesses the strongest supply structure ever, even as the price corrects in the medium term.
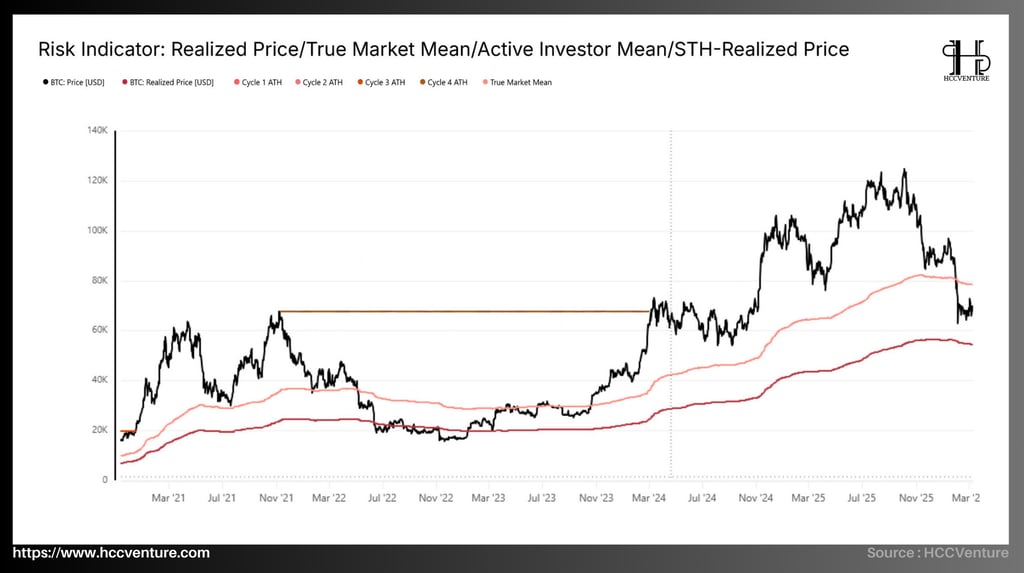
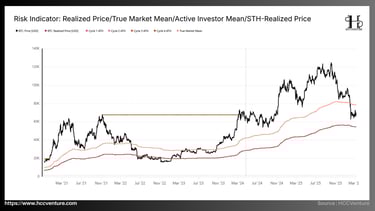
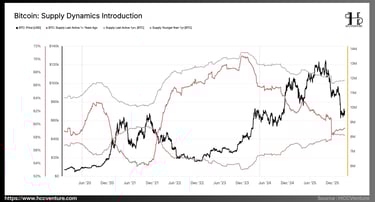
Data from the on-chain cost of capital indicator system confirms that Bitcoin is operating within an intermediate valuation zone, with the price sitting between the Realized Price ($54,000) and the Active Investor Mean ($78,000) . In this structure, the Realized Price continues to act as a long-term support level, while the Active Investor Mean and STH Realized Price form distinct behavioral resistance zones.
This structure indicates that the price is below the Active Investor Mean but above the Realized Price , placing the market in an intermediate state between growth and weakness.
Realized Price ~54.000 – 55.000 USD
Active Investor Mean ~78.000 – 80.000 USD
STH Realized Price ~70,000 USD (approximately)
In this structure, the Realized Price continues to act as a long-term support base, while the Active Investor Mean and STH Realized Price form distinct behavioral resistance zones. Compared to the past, this is a pricing zone that often appears in post-peak or consolidation phases after sharp corrections, when profits are not yet sufficient to trigger new capital inflows but also not negative enough to lead to large-scale capitulation.
Historical data shows that during periods of market weakness, the STH Realized Price often acts as a dynamic resistance level for the price. The current situation perfectly aligns with this characteristic, as Bitcoin has repeatedly failed to hold above the $70,000 mark.
The fact that prices remain below the Active Investor Mean and fluctuate around the STH cost basis suggests that the medium-term yield distribution remains skewed towards the negative . New capital inflows are not strong enough to absorb the supply hanging above, while short-term investors remain weak. This impact makes any rallies more technical in nature than the start of a new uptrend.
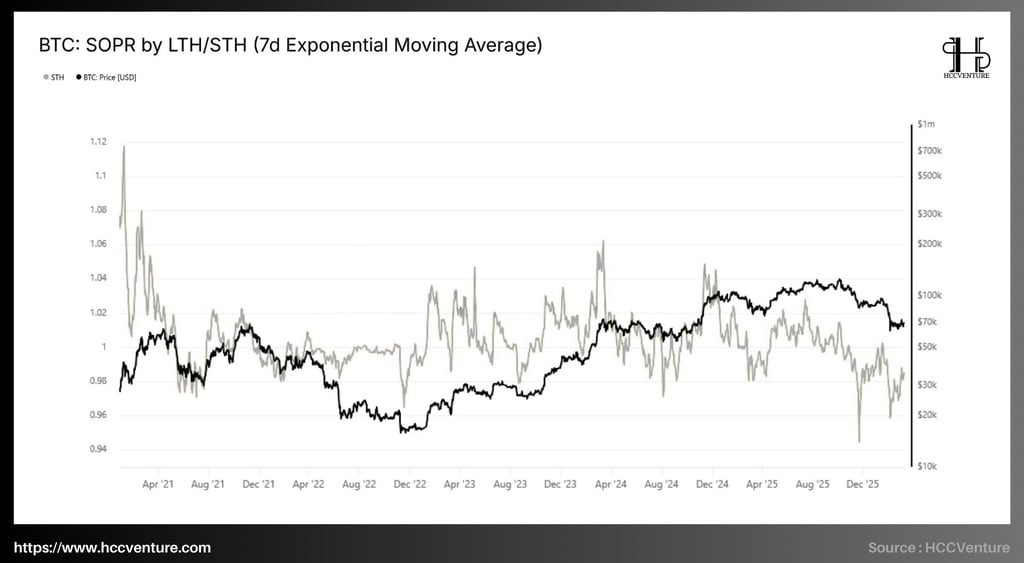
Currently, the STH-SOPR (7D-EMA) is fluctuating below the 1 threshold, around ~0.98–0.99 , confirming that short-term investors are continuing to spend Bitcoin at a loss. This is a typical quantitative characteristic of weak market phases or re-accumulation phases after distribution.
Observing the historical data on the chart reveals the following:
2021 period: STH-SOPR maintained >1 for most of the time → strong market growth.
2022 period: SOPR dropped sharply to ~0.95 → reflecting capitulation
2023 period: SOPR recovers and fluctuates around 1 → re-accumulation process
Currently (2025–2026): SOPR returns below 1 (~0.98)
This suggests that the current state is similar to the early phases of a bear market or post-peak periods, when upward momentum has weakened and the market enters a rebalancing phase. However, the current decline is not as deep as the 2022 capitulation phase, indicating controlled , distributed selling pressure rather than widespread panic.
A key characteristic of STH-SOPR during weak market phases is the role of the 1 level as dynamic resistance . Current data shows that recent price rallies have been accompanied by a recovery of SOPR to near 1, but it was quickly pulled back down, confirming that the market is under continuous selling pressure from short-term investors.
Although the chart focuses on STH, it needs to be placed in the broader context of LTH behavior. In previous cycles, when STH-SOPR remained below 1, LTH typically acted as an absorber of supply from the market. This structure predisposed to subsequent growth cycles, but required a sufficiently long accumulation period to re-establish supply-demand equilibrium.
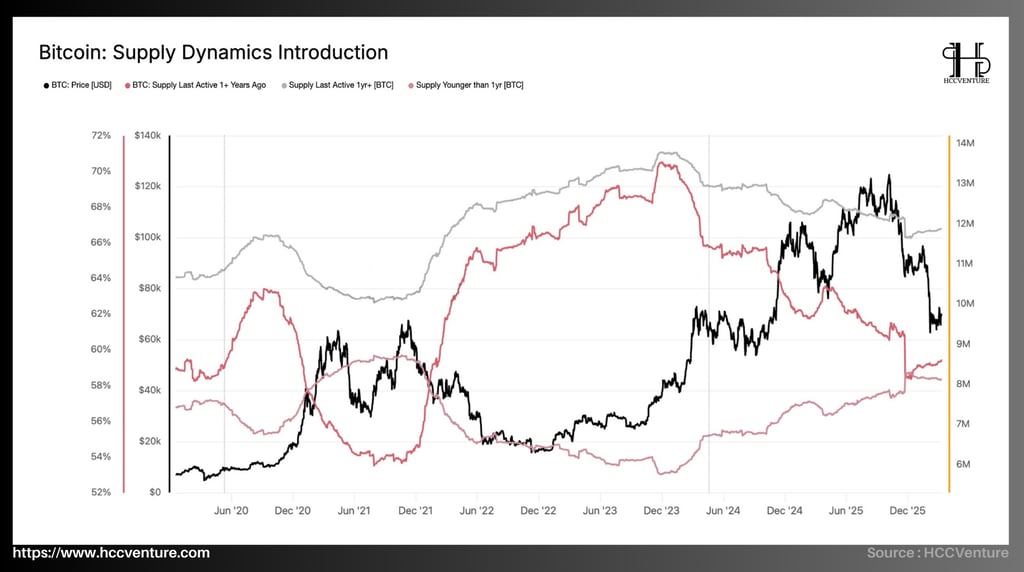
Currently, data suggests that Bitcoin is entering a clear transition phase, with young supply beginning to increase again after a prolonged period of decline, while long-term supply shows signs of stagnation.
The supply of Last Active >1y (LTH supply) is currently fluctuating around ~12.0 – 12.3 million BTC , a slight decrease from its peak of ~13.5 million BTC.
Supply <1y (STH supply) increased again to approximately 8.0 – 8.5 million BTC.
Compared to the peak of the previous cycle (2024–2025), when long-term supply reached historical highs, the current decline suggests that some of the Bitcoin has been recirculated into the market.
In previous cycles, this process typically occurred when prices reached high valuation zones, long-term investors began distributing, and supply shifted to new investors. The current structure confirms that this transfer has taken place, but has not reached the extreme levels seen at the 2017 or 2021 cycle peaks.
Despite a slight decline, long-term supply remains above approximately 12 million BTC , equivalent to over 60% of the total circulating supply . When long-term supply remains high, long-term selling pressure decreases, the supply circulating in the market is limited, and price fluctuations become more dependent on demand.
Long-term supply remains at historically high levels (~12 million BTC), serving as a stable foundation for the market structure. Meanwhile, the increase in young supply reflects the return of liquidity and new capital inflows, but it is not yet strong enough to create an explosive growth phase.
Compared to the past, the current state aligns with a post-distribution and accumulation phase , where the market is rebalancing supply and demand. This reinforces the view that Bitcoin is in the process of building a price base, with long-term momentum still supported by the scarce supply structure and long-term investor holding behavior.
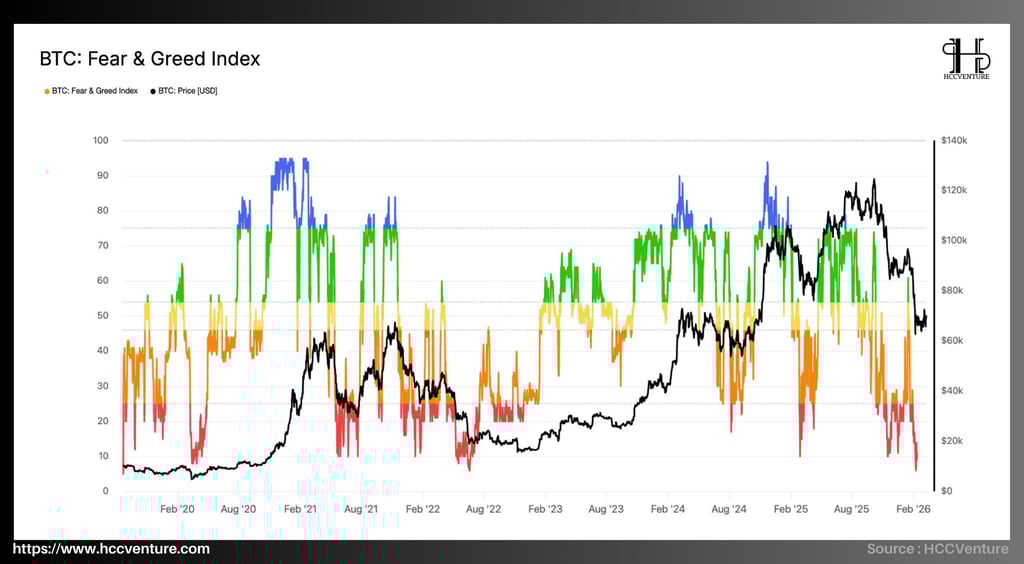
The Fear & Greed Index is a key composite tool reflecting market sentiment, built on multiple variables such as price volatility, trading volume, social media trends, and money flow. The current index fluctuates around 25–35 points , corresponding to the Fear zone , significantly lower than the neutral zone (~50) and far from the Extreme Greed zone (>80) that appeared at the peak of the most recent cycle (~$120,000). The Fear & Greed Index functions as an indicator reflecting crowd behavior.
When the index is high , investors tend to accept higher risks, which can easily lead to overvaluation.
When the index is low , investors become defensive, and liquidity decreases.
In the current context:
The index has fallen from around 80 to around 25.
The price was adjusted from approximately $120,000 to approximately $65,000.
Compared to previous cycles, the current psychological correction is similar to post-peak phases, when the market shifts from a distribution phase to a consolidation phase. However, it is noteworthy that the index has not remained in the Extreme Fear zone (<20) for long , indicating that widespread panic like the 2018 or 2022 cycle bottoms has not yet occurred.
Currently, the fact that the index has returned to the Fear zone but has not yet reached Extreme Fear suggests that the market has largely relieved its euphoria, but has not yet reached the extreme point to trigger a strong reversal cycle. Compared to the past, cycle bottoms usually form when the index remains below 20 for an extended period. The current state remains above this threshold, reflecting a controlled correction process.
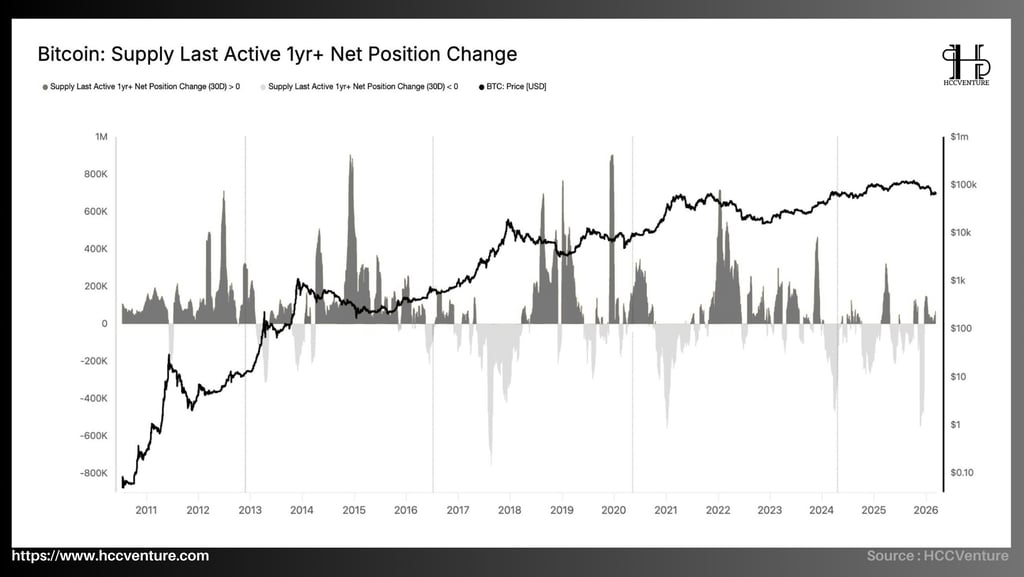
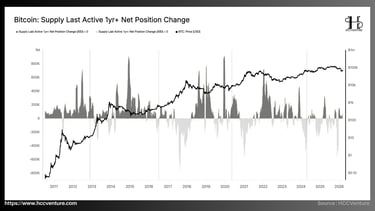
Data from the Supply Last Active 1yr+ Net Position Change indicator confirms that Bitcoin has ended its strong distribution phase from Long-Term Holders and is entering a stable and mild re-accumulation phase . In the current cycle:
The period from 2024 to early 2025 will see strong distribution phases from LTH.
Currently (2026), the indicator has returned to the neutral-slightly positive zone.
This confirms that the distribution process has weakened significantly, and the market is entering a phase of reabsorbing supply .
History shows that whenever Net Position Change shifts from negative to positive, long-term selling pressure decreases, the circulating supply narrows, and the market enters a stabilization or accumulation phase. Currently, Bitcoin's price has corrected from its peak of approximately $120,000 to around $65,000–$70,000, and Net Position Change has stopped declining and begun to stabilize. Compared to previous cycles, this is a typical characteristic of the post-distribution phase .
Compared to the past, the indicator's shift from negative to neutral-positive reflects a significant decrease in long-term selling pressure, while also suggesting that supply is gradually being absorbed again. However, the current accumulation intensity is still not strong enough to confirm a clear bullish reversal.
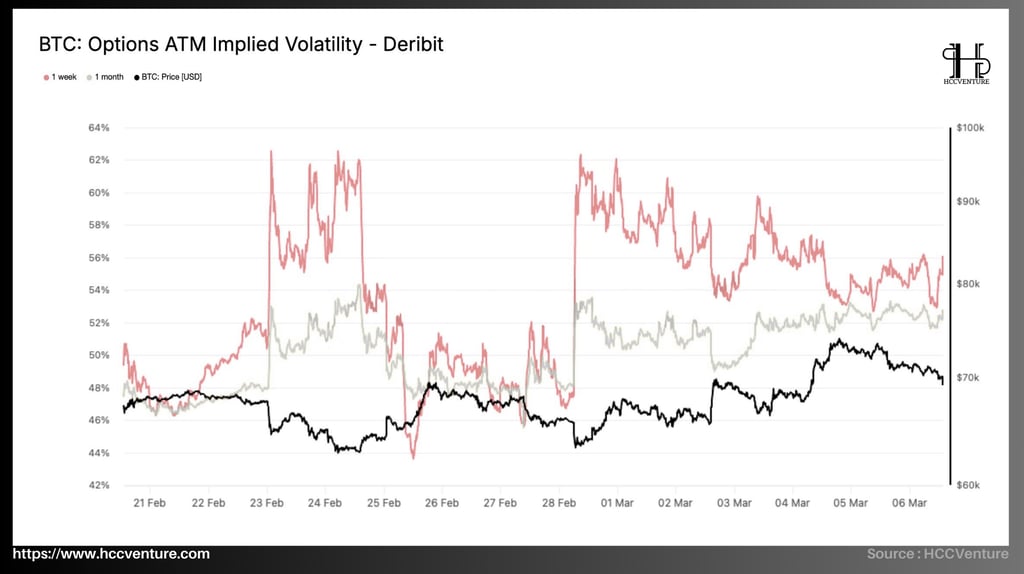

Current data shows implied volatility (IV) is trending downward after a period of strong growth , with short-term (1-week) indices falling to around 54–56% , while longer-term (1-month) indices are stabilizing around 51–53% . This reflects a clear shift in market risk perception: from a defensive stance against volatility to a more balanced state.
Observe the previous stages on the chart:
When the market faced a shock (2020, 2022, 2024): IV increased sharply to >60%
When the market stabilizes: IV decreases to the 45–50% range.
Currently, IV is in the 50–56% range , significantly lower than volatility peaks but still above the long-term base. This indicates:
The market has emerged from a state of stress.
But things haven't completely returned to normal yet.
Compared to the past, this is a typical characteristic of the post-turbulent – early stabilization period .
Currently, Bitcoin's price is fluctuating around the $65,000–$70,000 range , with a relatively narrow range compared to the previous period. The decrease in implied volatility reflects the market shifting to an accumulation phase, with reduced realized volatility and a downward adjustment in expectations for future price movements. Historically, bearish Phase IVs are often accompanied by consolidation phases , where the market builds a base before a new trend emerges.
Assessment and Conclusion
Bitcoin is currently operating in a structural transitional state, with all on-chain data and derivatives converging to show the market has moved out of a strong distribution phase and entered a stabilization phase. The price remains within a narrow range of approximately $62,000–$72,000, reflecting a temporary equilibrium between supply and demand, while being sandwiched between two key cost thresholds: the Realized Price around $54,000 and the True Market Mean of approximately $78,000. The fact that the price has failed to break above the $70,000 mark in multiple consecutive attempts confirms that current demand is still not strong enough to fully absorb the supply pressure above, even though the bearish structure has weakened significantly.
From an on-chain perspective, investor behavior shows a clear structural improvement. The STH-SOPR indicator remains below the 1 threshold at around 0.985, reflecting that short-term investors are still realizing losses, a typical characteristic of a weak or post-correction market phase. However, more importantly, the long-term supply side is more active, with Long-Term Holders having almost ceased distribution and shifted to a neutral to mild accumulation state. This has led to an increase in illiquid supply, significantly reducing the amount of supply available for sale. Compared to previous cycles, the current accumulation intensity has not yet peaked, but the decline in structural selling pressure is a confirming signal that the deep correction phase has passed.
Simultaneously, the demand side is beginning to show marginal signs of recovery. Capital flows from US spot Bitcoin ETFs have returned to positive territory after a prolonged period of withdrawal, while Cumulative Volume Delta data in the spot market indicates that buying pressure is gradually absorbing selling pressure. Although the scale of this capital flow is not yet large enough to create a strong uptrend, it plays a crucial role in establishing a price base and stabilizing the market structure. This suggests that the market is shifting from a state of insufficient demand to a state of returning demand, although it has not yet reached a level that leads the trend.
Disclaimer: The information presented in this article is the author's personal opinion in the field of cryptocurrency. This is not financial or investment advice. All investment decisions should be based on careful consideration of your personal portfolio and risk tolerance. The views expressed in this article do not represent the official position of the platform. We advise readers to conduct their own research and consult with experts before making any investment decisions.
Compiled and analyzed by HCCVenture
Follow HCCVenture here: https://link3.to/holdcoincventure
Explore HCCVenture group
HCCVenture © 2023. All rights reserved.


Connect with us
Popular content
Contact to us
E-mail : sp_contact@hccventure.com
Register : https://linktr.ee/holdcoincventure
Disclaimer: The information on this website is for informational purposes only and should not be considered investment advice. We are not responsible for any risks or losses arising from investment decisions based on the content here.
TERMS AND CONDITIONS • CUSTOMER PROTECTION POLICY
ANALYTICAL AND NEWS CONTENT IS COMPILED AND PROVIDED BY EXPERTS IN THE FIELD OF DIGITAL FINANCE AND BLOCKCHAIN BELONGING TO HCCVENTURE ORGANIZATION, INCLUDING OWNERSHIP OF THE CONTENT.
RESPONSIBLE FOR MANAGING ALL CONTENT AND ANALYSIS: HCCVENTURE FOUNDER - TRUONG MINH HUY
Read warnings about scams and phishing emails — REPORT A PROBLEM WITH OUR SITE.