


On-chain analysis week 10/2025: BTC/ETH drops sharply, market moves slowly
If the selling continues without strong institutional support or macroeconomic stability, digital assets may continue to face the risk of a deeper correction. However, any clarity on the US Strategic Digital Reserve or signs of recovery in the global economy could be a catalyst to restore investor confidence and spur a market recovery.
3/9/20259 min read
Market Summary
Bitcoin has fallen 28% from its cycle peak, while Ethereum and Solana have even recorded a drop of more than 50% , reflecting a deep correction and investor pessimism.
The sharp sell-off has resulted in a spike in realized losses , marking the second-largest stop-loss event of the cycle. This underscores the severity of the current correction, with many investors exiting the market with significant losses.
Although the market briefly rallied following former President Donald Trump ’s announcement of the creation of the Strategic Cryptocurrency Reserve , it turned into a “sell-the-news” event, as prices continued to fall and are now trading lower than they were before the news was announced.
Based on price structure and on-chain indicators, Bitcoin needs to reclaim the $92,000 area to reestablish bullish momentum. In case the downtrend continues, the $70,000 area is seen as a key support level where buyers can start to rebuild demand. If Bitcoin fails to hold this level, the risk of a deeper correction remains.
On-chain metrics analysis
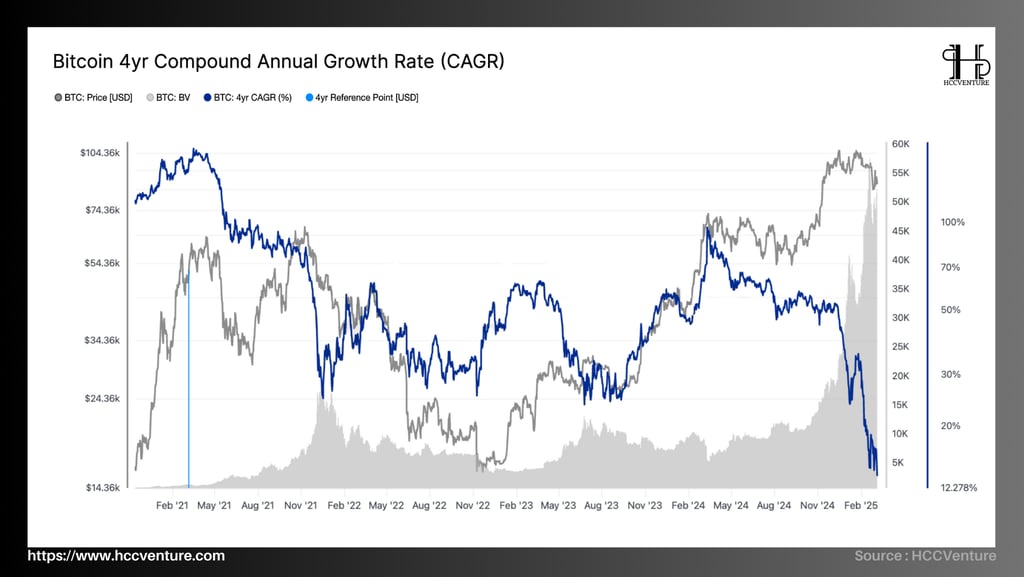
Compound Annual Growth Rate ( CAGR ) shows the average annual return an investor could achieve if Bitcoin grew at a constant rate over a period of 4 years.
For Bitcoin, the four-year period is particularly significant because it corresponds to the Halving cycle , an event that reduces miner block rewards, thereby affecting the BTC supply and often leading to strong growth cycles.
2021-2022: After Bitcoin reached ATH $69K in November 2021 , the market entered a strong correction phase as the FED started to raise interest rates and money flowed out of risky assets. At that time, the CARG index decreased by -16%.
2022-2023: The market witnessed a correction of -44%, the strongest correction in Bitcoin history due to the impact of the causes. This is the worst year for Bitcoin since 2018, but it is also the period when long-term investors (LTH) accumulate strongly .
LUNA-UST Event (May 2022) : Market crashes after Terra fails, causing a wave of bankruptcies (Celsius, 3AC).
FTX Event (November 2022) : Second largest exchange goes bankrupt, sending Bitcoin below $16K .
2023-2024: Recovery phase when BTC price increases from $23.5K to $48.5K (+106%), CARG index reaches 106% after 2 years of sharp decline before. The market is stimulated by good news such as:
The FED paused raising interest rates , and money began to flow back into the market.
BlackRock and many large institutions apply for Bitcoin Spot ETF , creating positive effects.
The 2024 Halving event is approaching, triggering a new growth cycle.
2024-2025: BTC price increases from $48.5K to $84,252 (+73%), CARG index reaches 73%, thanks to the approval of Bitcoin ETF along with President Trump's election to the top position of the White House. Bitcoin reaches ATH $109K (December 2024) due to strong capital flow from ETF funds.
Trend assessment from 2025 onwards:
Bitcoin is still in a growth cycle, but at a slower pace : The 13.92% CAGR is still an attractive return compared to many traditional assets, but it is no longer as groundbreaking as before. This makes BTC a long-term investment asset rather than a short-term speculative instrument.
Reasonable price target for 2025 - 2029 period : If CAGR maintains around 12-15% in the next cycle, Bitcoin price could fluctuate between $150,000 - $180,000 in 2029 , lower than the extreme predictions of some analysts expecting BTC > $500K.
Bitcoin is becoming a safe haven asset and an institutional asset : The slowing growth rate but still maintaining an upward trend shows that Bitcoin is increasingly considered a safe haven asset (Store of Value), instead of just a speculative vehicle. This will attract more capital flows from institutions, investment funds and countries.
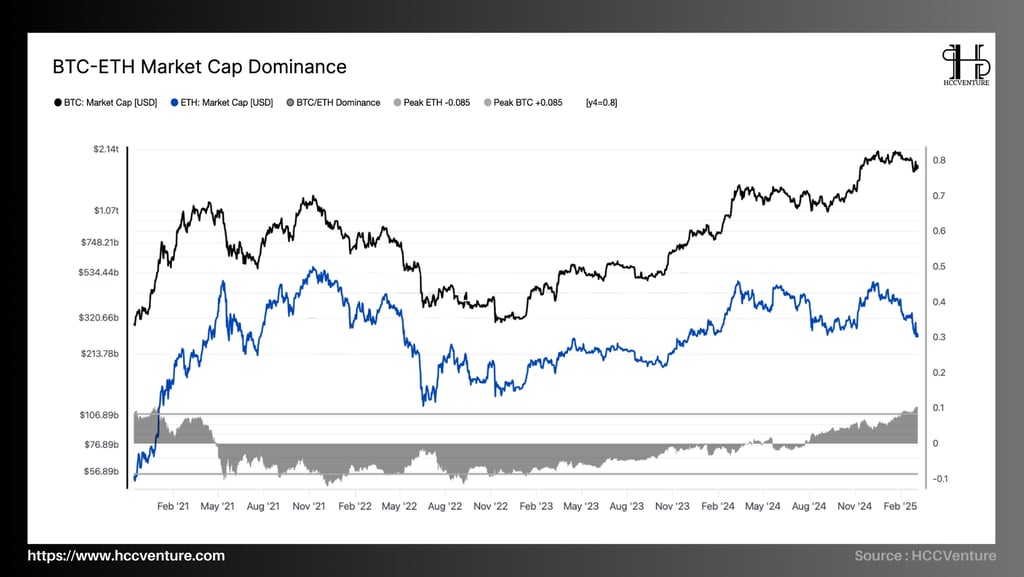

Over the past four years (2021-2025), the market cap dominance of Bitcoin (BTC) and Ethereum (ETH) has undergone significant fluctuations, reflecting changes in market sentiment and the growth of the cryptocurrency ecosystem.
2021: Bitcoin accounts for about 60.36% of the total cryptocurrency market capitalization.
2022: This ratio falls below 50% by April 2024, due to rumors of central banks stopping or possibly cutting interest rates.
2023-2024: Bitcoin and Ethereum together account for more than half of the cryptocurrency market by 2024, with newer coins losing market share.
Bitcoin hit a new ATH (~$109,000) in March 2024 after the Bitcoin Spot ETF was approved earlier this year. However, ETH continued to slow down due to disappointment from institutional investors as there was no clear sign of an ETH Spot ETF approval .
At the same time, the rise of Layer 2 Scaling Solutions like Base, zkSync, and StarkNet has driven some on-chain activity away from Ethereum Layer 1, negatively impacting ETH's market cap.
In addition, Solana, Avalanche and new blockchains such as Aptos, Sui also attract capital from investors, competing directly with Ethereum.
Trend Assessment in 2025:
Bitcoin continues to play the role of "digital gold" , attracting long-term institutional capital. Dominance rate may stabilize in the range of 45-55% in the coming years.
Ethereum could recover if ETH Spot ETF is approved, but faces competition risks from Layer 2s and other blockchains. Dominance could remain around 18-23% depending on the performance of the ETH ecosystem.
Altseason could happen if ETH recovers strongly, leading to the growth of the DeFi ecosystem, NFTs and Layer 2s.
Downside risk if Bitcoin & Ethereum fail to attract new money, or if FED monetary policy tightens further.
Bitcoin is increasingly asserting its important role on the international financial stage , as many countries begin to integrate Bitcoin into their economic and monetary strategies . Some typical examples include:
The Kingdom of Bhutan has launched large-scale Bitcoin mining operations , taking advantage of its abundant hydroelectric power.
El Salvador is the first country to recognize Bitcoin as legal currency , with the aim of attracting investment and boosting economic growth.
The US government is also evaluating Bitcoin's potential as a strategic reserve asset , similar to gold in the traditional financial system.
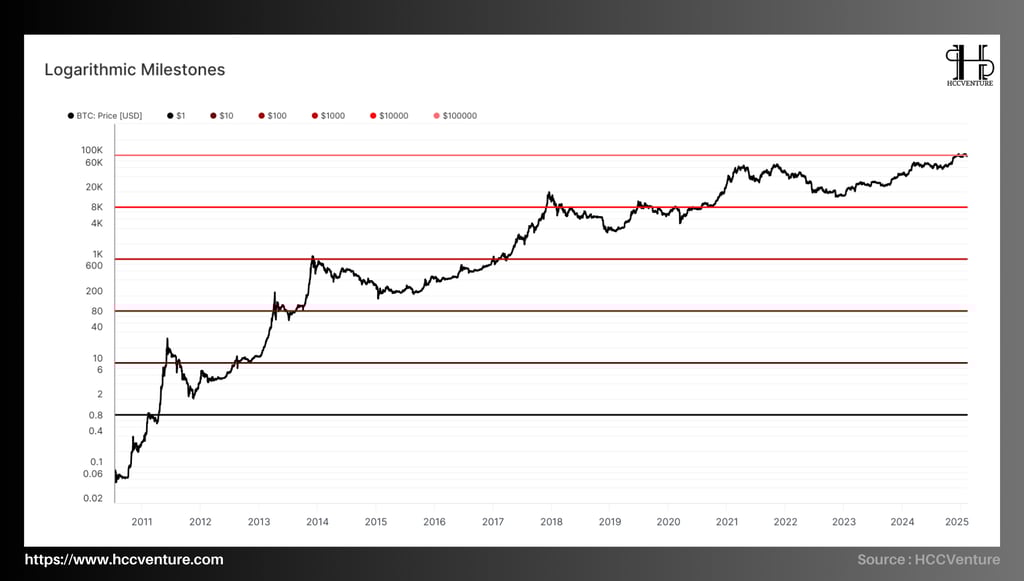
Bitcoin has now held above $100,000 for weeks , a milestone that many critics once said was unattainable . This marks a huge jump in value , as Bitcoin reaches this psychologically important milestone exactly seven years after surpassing $10,000 during the 2017 bull run.
This event not only demonstrates Bitcoin's exponential growth , but also reflects the traditional financial markets' growing acceptance of Bitcoin as a long-term store of value .
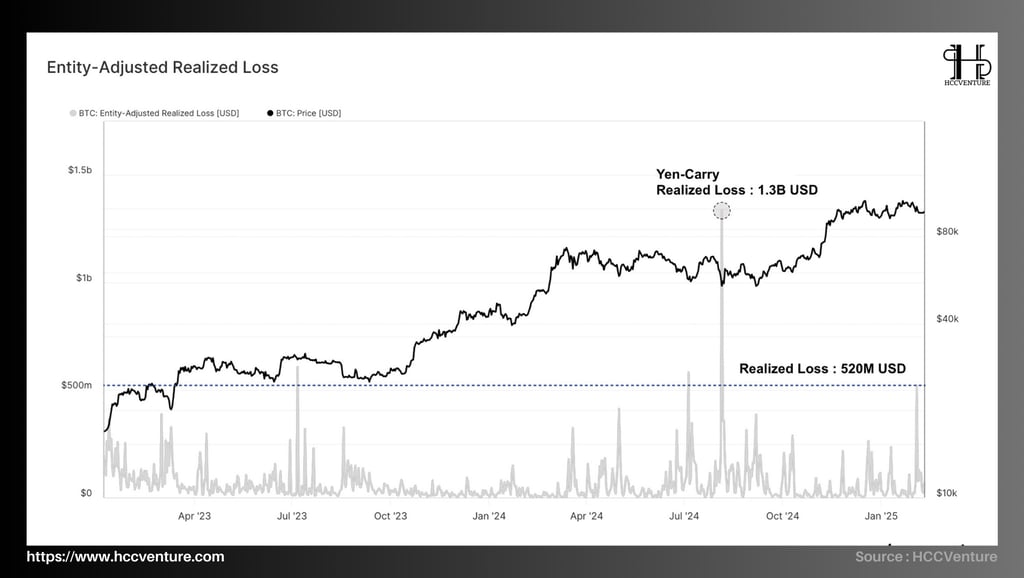
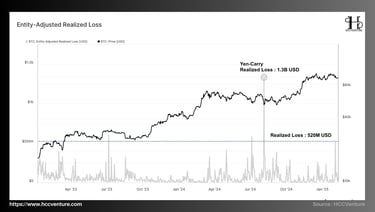
Although Bitcoin price has remained relatively stable over the past week, on-chain data shows that investors have recorded the largest Realized Losses in the current bull cycle .
Specifically, when BTC dropped to $93,000 , investors accepted losses selling with a total value of up to $520 million , marking one of the largest local sell-off events since the beginning of the cycle .
Historical data shows that this loss is second only to the event on August 5, 2023 , when the market witnessed a major collapse related to the yen-carry trade unwind , resulting in a realized loss of up to $1.3 billion in a single day .
With such a large loss, this can be considered a significant "capitulation" in a long-term uptrend of Bitcoin.
This shows that selling pressure from short-term investors (Short-Term Holders) is still very large , especially those who bought near the top and were forced to cut losses when prices fell sharply.
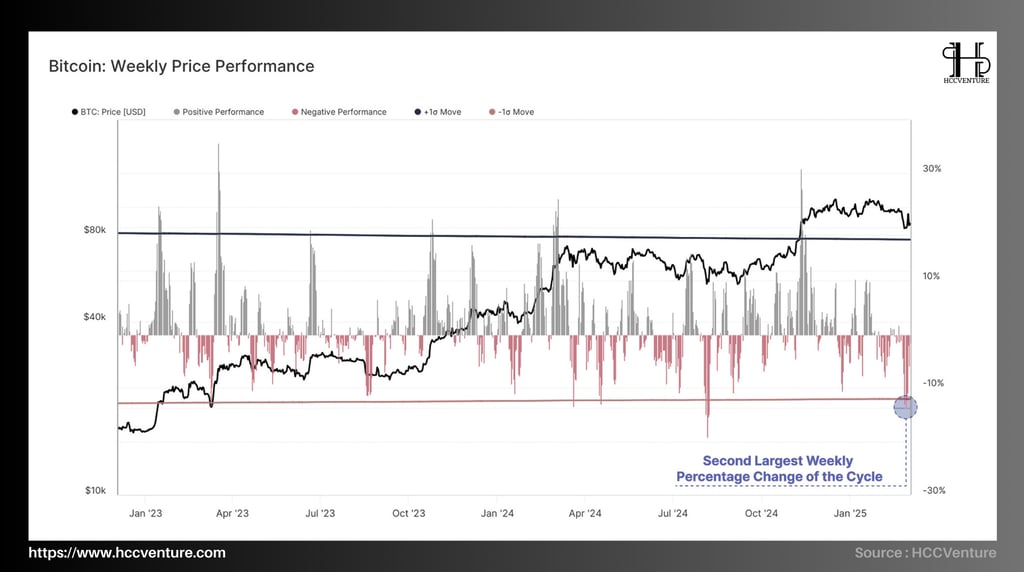
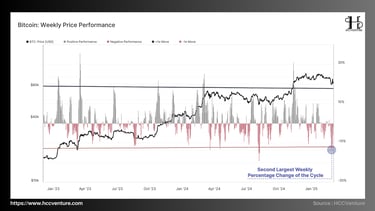
While Bitcoin is outperforming other digital assets during the recent sell-off, the -13.9% drop in a week still marks the second-largest weekly decline this cycle .
The only correction with a stronger decline occurred on August 5, 2024 , when the market was affected by the "unwind" of the Japanese Yen carry trade - an event that had a ripple effect on both traditional financial markets and the crypto market.
Phase 2021 : Strong bull market, Bitcoin price grows on average +5.2% per week , there are weeks of increase over +15% when institutional money flows in.
2022 Phase : Prolonged bear market, weekly performance down -4.8% on average , with weeks Bitcoin lost over -20% due to the collapse of Terra-LUNA and FTX.
Phase 2023 : Market recovers, price performance gradually becomes positive with an average increase of +3.6% per week , peaking at the end of the year when Bitcoin Spot ETF is expected.
Phase 2024 : The market entered a strong growth phase at the beginning of the year, with a week increasing by +12% , but from the second quarter, there were strong corrections, with a week decreasing by -13.9% , especially after the Bybit hack.
Forecast 2025 : Bitcoin may continue to be volatile due to the influence of Halving and global monetary policy.
Bitcoin’s weekly price performance clearly reflects the market’s transition from a bull market to a deep correction. The 2021-2024 period saw weeks of outstanding growth as institutional money poured in, but also weeks of sharp declines as panic prevailed.
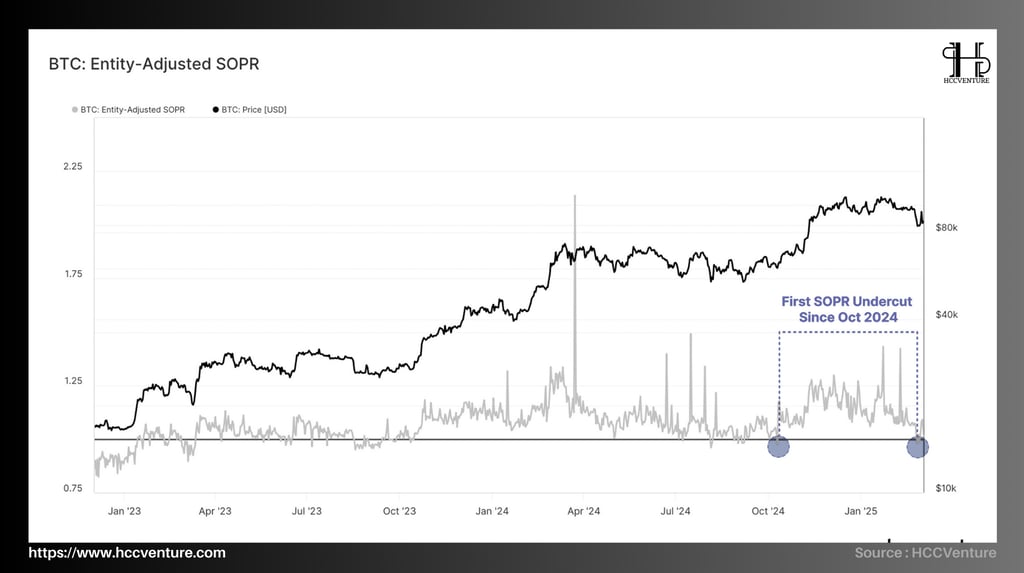

The Spent Output Profit Ratio (SOPR) measures the average profit or loss that investors make when they sell Bitcoin. We are currently witnessing the first period of loss dominance since October 2024 , reflecting weak market sentiment and increased selling pressure.
However, there are still positive signs in the SOPR structure. If the indicator finds support at the 1.0 equilibrium level , it indicates that investors are protecting their capital and are ready to buy when the price hits this area. In previous bull markets, short dips below 1.0 have often triggered strong buying pressure and kept the momentum going.
Historical data shows that in previous bull cycles , SOPR has had brief dips below 1.0 but quickly recovered, demonstrating buying momentum. If this happens again, it may just be a short-term correction before the market resumes its uptrend.
If SOPR quickly recovers from 1.0, this would be a sign of a protected bull market , with strong buying pressure from long-term investors.
Conversely, if the SOPR falls below 1.0 and fails to recover for a long time, the risk of a prolonged period of decline increases.
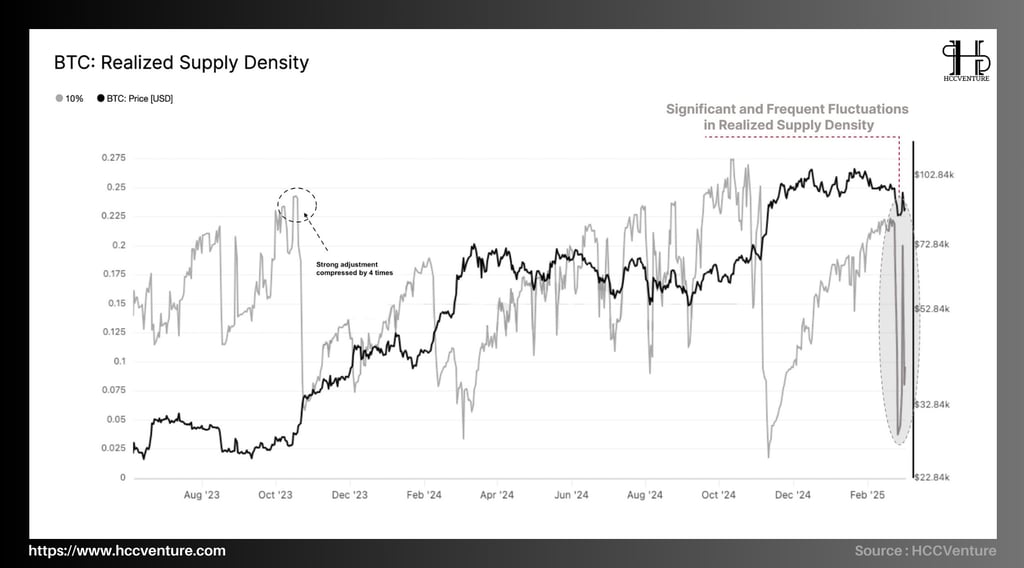

BTC Realized Supply Density is an important on-chain metric that measures the distribution of Bitcoin supply according to actual purchase prices of investors. This metric helps identify price zones where a lot of BTC is accumulated, thereby reflecting potential support/resistance zones based on market sentiment and behavior.
Phase 2023
Realized Supply Density shows a large amount of BTC being bought in the $25,000 - $35,000 range , forming a strong support zone.
At the $50,000 - $55,000 price level , supply density is lower, allowing prices to move faster as the market breaks through this zone.
Phase 2025
If Bitcoin continues to correct, the key support zone will be in the $60,000 - $72,000 range , where there is a high supply density.
If BTC can sustain above $92,000 , this could be the basis for a new bull cycle, especially if institutional money continues to flow in through ETFs.
Strong support zone : 60,000 - 72,000 USD (where many BTC are bought before the strong 2024 surge).
Dangerous "air gap" zone : 70,000 - 88,000 USD (low supply density, price can drop quickly if support is lost).
Important resistance zone : 100,000 - 110,000 USD (where many investors take profits after BTC sets a new peak).
Evaluation and Conclusion
In recent months, the cryptocurrency market has seen volatility compression, leading to a deep price correction across all digital assets. This decline has triggered massive sell-offs, marking the second-largest capitulation event in the current cycle.
The Short-Term Holder (STH) Cost Basis is currently at $92,000 , indicating that this is a key price level in determining market momentum. If Bitcoin stays above this level, it could be a sign that buyers are still protecting their entry costs, keeping the uptrend intact.
If the market continues to weaken, the $71,000 area is the most important support level that bulls need to defend. This area coincides with important technical indicators such as long-term moving averages, as well as large on-chain liquidity zones . A break below $71,000 could trigger panic selling , putting the market at risk of a deeper correction.
This capitulation is the second-largest event in the current cycle , behind only the Japanese Yen carry trade unwinding in August 2024. Realized Losses have spiked, indicating that a large number of investors sold at a loss during this bearish period .
Bitcoin is currently at a critical stage, with $92,000 being the key level to maintain short-term momentum , while $71,000 is the bulls' last line of defense . With the market still under heavy selling pressure, investors need to closely monitor price reactions at these key areas to assess appropriate trading strategies.
Join the HCCVenture community to get the latest market information. Once again, we give our opinion on potential projects in the crypto market. This is not investment advice, consider your portfolio. Disclaimer: The views expressed in this article are solely those of the author and do not represent the platform in any way. This article is not intended to be a guide to making investment decisions.
API & Data : Glassnode
Compiled and analyzed by HCCVenture
Join our telegram community: HCCVenture
Explore HCCVenture group
HCCVenture © 2023. All rights reserved.


Connect with us
Popular content
Contact to us
E-mail : sp_contact@hccventure.com
Register : https://linktr.ee/holdcoincventure
Disclaimer: The information on this website is for informational purposes only and should not be considered investment advice. We are not responsible for any risks or losses arising from investment decisions based on the content here.
TERMS AND CONDITIONS • CUSTOMER PROTECTION POLICY
ANALYTICAL AND NEWS CONTENT IS COMPILED AND PROVIDED BY EXPERTS IN THE FIELD OF DIGITAL FINANCE AND BLOCKCHAIN BELONGING TO HCCVENTURE ORGANIZATION, INCLUDING OWNERSHIP OF THE CONTENT.
RESPONSIBLE FOR MANAGING ALL CONTENT AND ANALYSIS: HCCVENTURE FOUNDER - TRUONG MINH HUY
Read warnings about scams and phishing emails — REPORT A PROBLEM WITH OUR SITE.