


On-chain analysis for week 9/2026: Fragile market structure but room for growth
Bitcoin is currently trading within a fragile consolidation phase below the psychological threshold of $70,000, reflecting a significant weakening of short-term buying momentum, as the market has yet to establish a demand base.
3/11/202611 min read
Market Summary
The weakening of buying momentum is most evident through on-chain realized profit indicators. Realized Profit (30-day moving average) has sharply declined from over $1 billion per day to around $350–400 million , equivalent to a contraction of approximately 63% compared to the period before the market correction.
Simultaneously, the Percent Supply in Profit indicator has fallen to approximately 56–57% of total profitable supply , below the -1 standard deviation threshold of the long-term cycle (~60%) . In previous cycles, similar levels have appeared in the early stages of bear markets, most notably in May 2022 and late 2018 , when a large proportion of investors began moving into unrealized losses and selling pressure increased.
Another important structural factor comes from the cost basis of Short-Term Holders , especially those holding coins for 1 week to 1 month . On-chain data shows that the average cost basis for this group is currently around $70,000 , forming a significant psychological benchmark in the market's behavioral structure .
Although the market structure remains defensive, some stabilizing signals are beginning to emerge in the spot data. Selling pressure in the spot market has started to ease at the margins , as evidenced by the improvement in Cumulative Volume Delta (CVD) on several major exchanges.
However, the formation of a sustainable uptrend in the medium term still depends on a core factor: the return of stronger spot capital flows to absorb the supply hanging above the market , especially around the cost basis of short-term investors.
Analyzing on-chain metrics
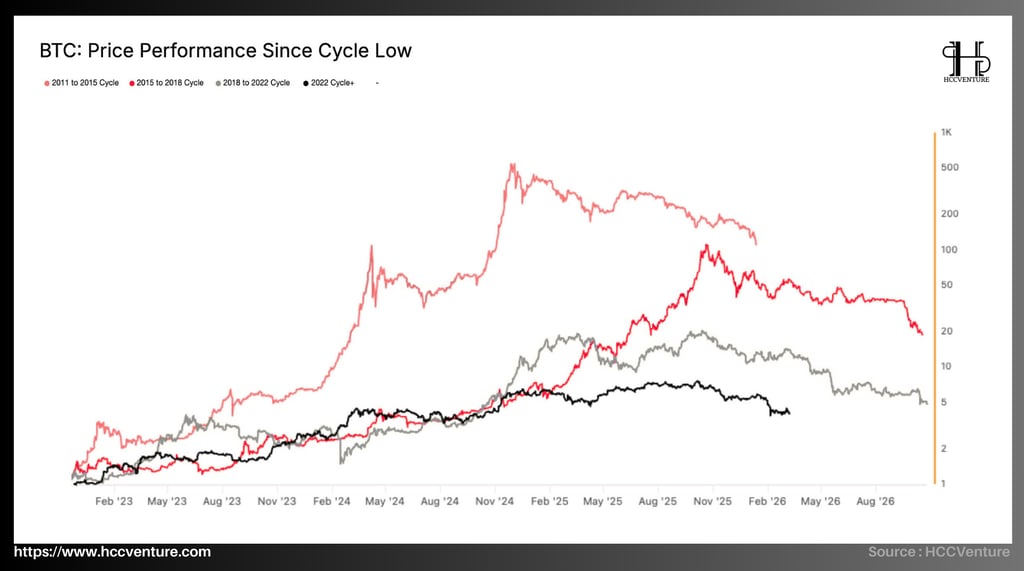

Analysis of the BTC Price Performance Since Cycle Low indicator suggests that Bitcoin's current market cycle is following the historical structure of previous cycles, but with significantly lower growth margins due to market maturity and larger market capitalization.
During the 2011–2015 cycle , Bitcoin experienced extremely strong growth from the bottom of the cycle, with its price increasing more than 500 times before peaking. This was a period when the market was still very small, where new capital inflows could create enormous price fluctuations.
During the 2015–2018 cycle , growth performance remained very strong, with the price of Bitcoin increasing approximately 100 times from its cycle bottom before peaking at the end of 2017.
The 2018–2022 cycle marked a more mature market as growth from the bottom slowed to around 20 times , reflecting the increasing market capitalization and the participation of financial institutions.
Compared to previous cycles, the current cycle since the 2022 bottom shows significantly more modest growth performance. At its peak of nearly $110,000 , Bitcoin only increased by about 6–7 times from the cycle bottom , considerably less than in previous cycles. This gradual decline in growth performance across cycles is a clearly observed phenomenon in Bitcoin's history and reflects the maturation of the market .
As Bitcoin's market capitalization increased from a few billion dollars to trillions of dollars, the amount of capital needed to sustain the same exponential growth also increased significantly. This means that new cycles typically have lower but more stable growth margins compared to the early market cycles.
The current cycle shows a similar structure. Although growth is lower than previous cycles, Bitcoin has still achieved multiple gains from its cycle bottom amidst a market that has become a global financial asset with the participation of ETFs, financial institutions, and macro capital flows .
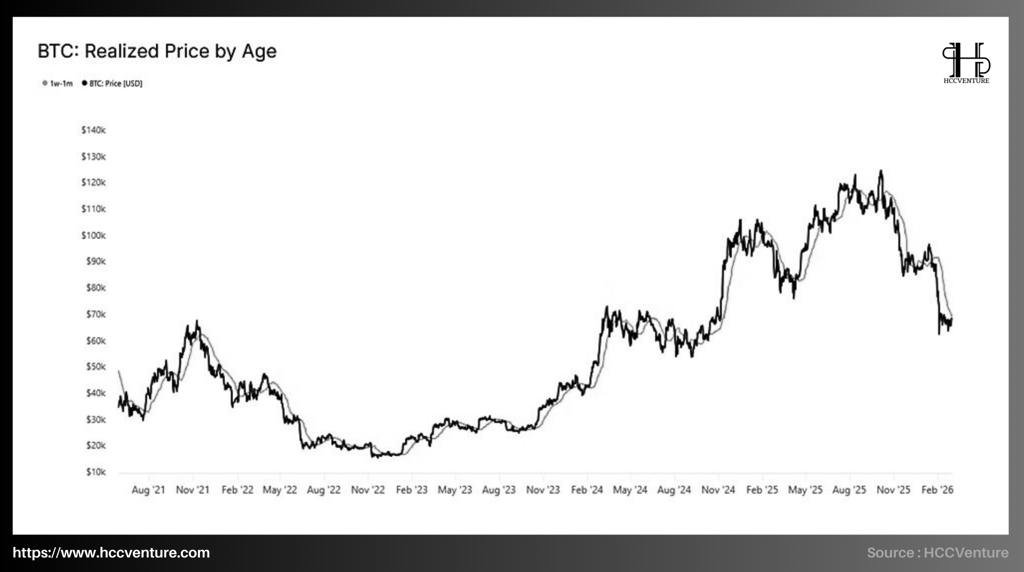
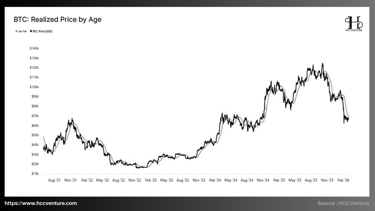
Realized Price by Age (1W–1M) reflects the average on-chain cost of short-term investors , specifically those Bitcoins purchased within a period of 1 week to 1 month . This group typically moves very close to the market price because they have short trading cycles and react quickly to price fluctuations. The Realized Price of the 1W–1M group is currently around $70,000 , closely matching the market price range after Bitcoin corrected from its cycle peak of approximately $110,000–$115,000 .
Observing previous cycles reveals a fairly clear pattern: during market phases transitioning from growth to correction , the price of Bitcoin typically fluctuates around the cost basis of short-term holders .
During the 2021 cycle , when Bitcoin corrected from its peak of around $69,000 , the Realized Price line of the short-term cohort also became a significant resistance zone. Each time the price recovered close to the cost level of the new group of investors, selling pressure often increased as they took advantage of the opportunity to exit their positions at break-even .
A similar structure is emerging in the current cycle. After peaking near $110,000 , Bitcoin has corrected sharply down to the $65,000–$70,000 range . In this context, the Realized Price of the 1W–1M group is around $70,000 , forming a significant behavioral resistance zone.
This means that any short-term rebound in Bitcoin price to this region is likely to trigger distribution activity from new investors who previously bought at higher prices and are looking for opportunities to reduce their risk.
The ±2% zone around the cost basis of $70,000 , equivalent to approximately $68,500 to $71,500 , thus becomes a significant behavioral resistance zone in the short term . Historically, such cost basis zones often act as distribution areas in the early stages of a bear market or mid-term corrections .

The Percent Supply in Profit ( PCI) has fallen to approximately 57% of the total supply , below the -1 standard deviation threshold in the historical distribution. This indicates a significant proportion of investors are holding Bitcoin at unrealized losses. Furthermore, the Realized Price data for short-term holders (1W–1M) is currently hovering around $70,000 , close to the current market price. This means any recovery to this level could trigger selling as short-term investors seek to exit positions at break-even.
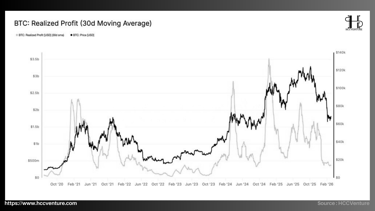
During the 2020–2021 cycle , Realized Profit peaked at nearly $3.5 billion per day as Bitcoin entered its late-cycle euphoria and the price approached the $60,000–$69,000 range . The surge in profit-taking at that time reflected large unrealized gains across the market and strong participation from speculative capital.
Similarly, in the current cycle, Realized Profit also surged during the period when Bitcoin rose from $30,000 to over $100,000 , with realized profit peaks reaching approximately $3 billion per day during the market's peak near $110,000 .
However, after Bitcoin's price began to correct, this indicator declined rapidly. Currently, the 30-day average Realized Profit is only about $370 million per day , the lowest level since August–September 2024 , when the market was in an accumulation phase before entering a strong growth phase.
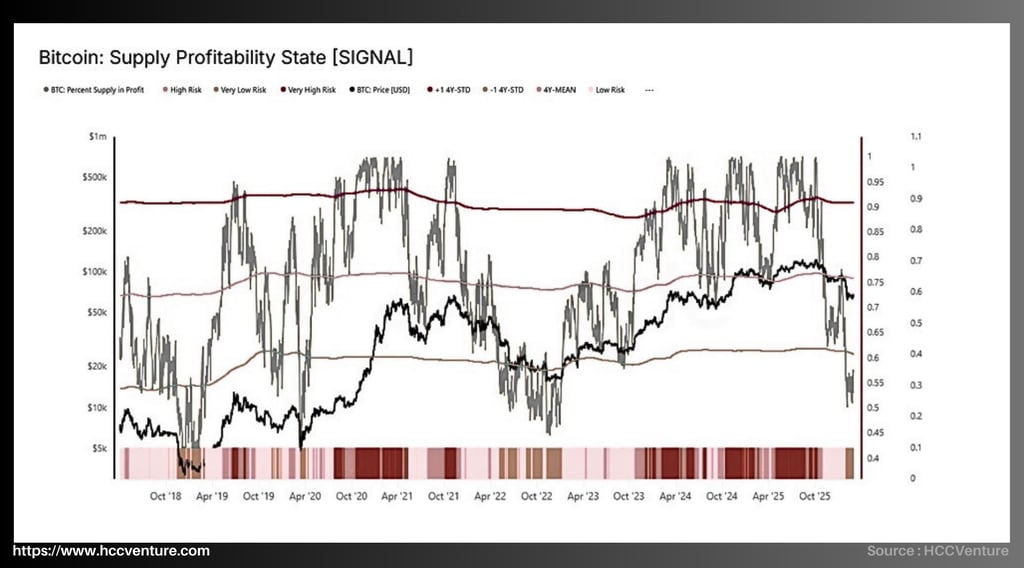
The Bitcoin Supply Profitability State indicator is currently providing a crucial signal about the state of the market cycle. The fact that the supply profitability ratio has fallen to around 57% and broken through the -1 standard deviation threshold around 60% places the market in the same historical context as the early stages of previous bear markets, particularly November 2018 and May 2022 .
When the profitable supply ratio is high, the market is typically in a strong growth phase, where the majority of investors hold profitable positions and market sentiment remains optimistic. Conversely, when this ratio declines significantly, it indicates that a large portion of the supply is beginning to fall into a loss-making state , often accompanied by increased selling pressure and a less favorable market environment.
During bear market phases like November 2018 or May 2022 , this index typically fell to the 50–60% range , as a large number of investors began taking losing positions after sharp corrections. In the current context, the index has broken through the -1 standard deviation threshold around 60% , and is currently fluctuating around 57% , placing the market in the same historical data zone as the early stages of previous bear markets.
The average 30-day realized profit has dropped sharply from over $1 billion to approximately $370 million per day , indicating a significant weakening of profit-taking momentum and new buying demand. Furthermore, the average cost for short-term holders (1W–1M) is currently around $70,000 , close to the market price.
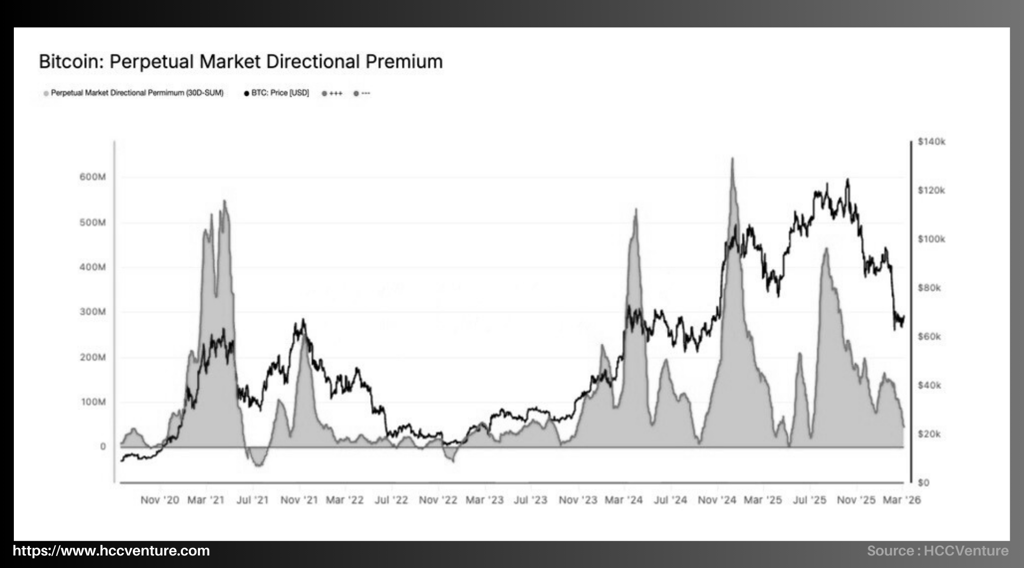
The Perpetual Market Directional Premium indicator is currently clearly reflecting the decline in leveraged speculative activity in the Bitcoin market. After peaking at nearly $600 million during the period when Bitcoin surpassed $100,000 , the indicator has sharply declined to near the lowest point of the cycle.
A similar pattern has emerged in the current cycle. As Bitcoin surged from the $30,000 range to over $100,000 , the Directional Premium also rose sharply, reaching peaks near $600 million , indicating strong participation of speculative capital in the derivatives market.
However, after Bitcoin began correcting from its peak of $110,000–$115,000 , this indicator declined rapidly. Currently, the Perpetual Market Directional Premium has fallen to near the lowest point of the cycle , reflecting a significant decrease in leveraged activity in the futures market.
The narrowing of the Directional Premium indicates that leveraged long positions are being closed and bullish sentiment in the derivatives market has significantly weakened . However, this delevering process also helps eliminate systemic risk from excessive leverage, paving the way for the market to move towards a more balanced state.
A similar pattern has emerged in the current cycle. As Bitcoin surged from the $30,000 range to over $100,000 , the Directional Premium also rose sharply, reaching peaks near $600 million , indicating strong participation of speculative capital in the derivatives market.
However, after Bitcoin began correcting from its peak of $110,000–$115,000 , this indicator declined rapidly. Currently, the Perpetual Market Directional Premium has fallen to near the lowest point of the cycle , reflecting a significant decrease in leveraged activity in the futures market.
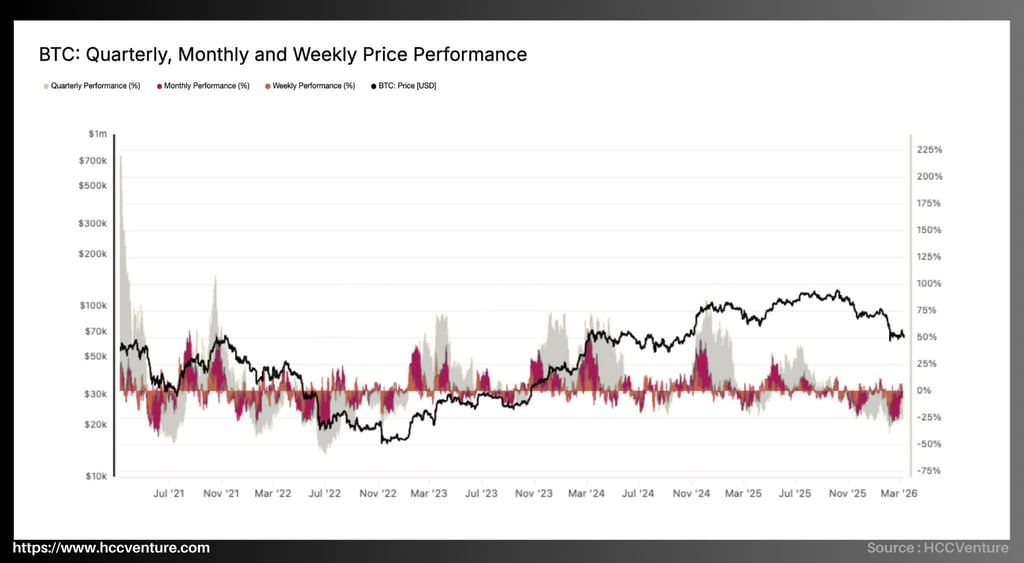
A similar pattern has emerged in the current cycle. As Bitcoin rose from the $25,000–$30,000 range to above $100,000 , quarterly performance repeatedly exceeded 70–90% , reflecting a surge in capital flows into the market.
However, after the price peaked near $110,000 , the performance structure changed significantly. Currently, quarterly performance has sharply declined to neutral or slightly negative territory , while monthly performance also fluctuates around -10% to +10% , reflecting a marked weakening of growth momentum.
Amid weakening demand momentum, declining unrealized profits, and the withdrawal of speculative leverage, the Bitcoin market is currently entering a supply-demand rebalancing phase , where short-term price trends are likely to continue fluctuating within a wide range until new capital inflows emerge.
Analysis of the Quarterly, Monthly, and Weekly Price Performance indicator shows that Bitcoin's price momentum is clearly weakening after a period of strong growth in the current cycle. After peaking near $110,000–$115,000 , quarterly and monthly performance has declined sharply, reflecting a shift in the market towards a neutral volatility state.
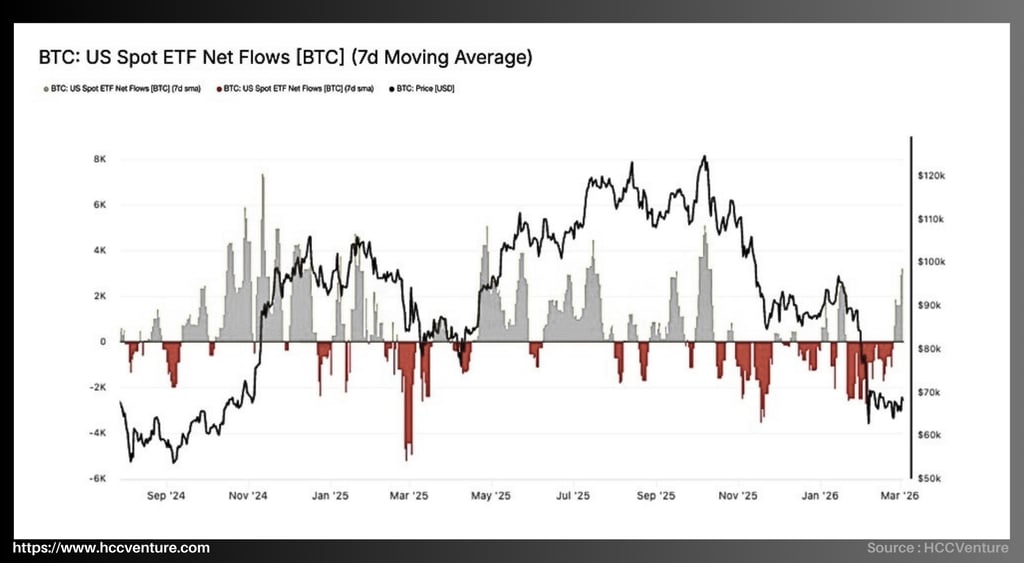
The US Spot Bitcoin ETF Net Flows (7-Day Moving Average) indicator is providing an important signal about the behavior of institutional capital flows in the Bitcoin market. After recording significant outflows of up to -5,000 BTC per day during the recent correction phase, ETF flows are now beginning to stabilize , with the first sessions recording inflows.
During the current cycle's strong growth phase, particularly from late 2024 to mid-2025, ETF inflows recorded several periods of robust capital flows , with net inflow peaks reaching approximately 6,000–7,500 BTC per day . These periods coincided with Bitcoin's strong breakouts and its progress towards the $100,000–$110,000 range , reflecting the active participation of institutional capital during this growth phase.
However, as the market entered a correction phase after the cyclical peak, the capital flow structure changed significantly. For several consecutive weeks, ETFs recorded strong net outflows , with withdrawals reaching -3,000 to -5,000 BTC per day , particularly during the sharp market downturn in early 2026.
This sustained net outflow of capital indicates that institutional investors have been reducing portfolio risk , consistent with the market entering a correction phase after reaching its peak.
This shift is occurring as Bitcoin prices are fluctuating around the $65,000–$70,000 range , significantly lower than the cycle peak. Historically, periods of ETF capital flow stabilization often occur when the market begins to enter a consolidation phase after a correction , as institutional investors reassess asset valuations.
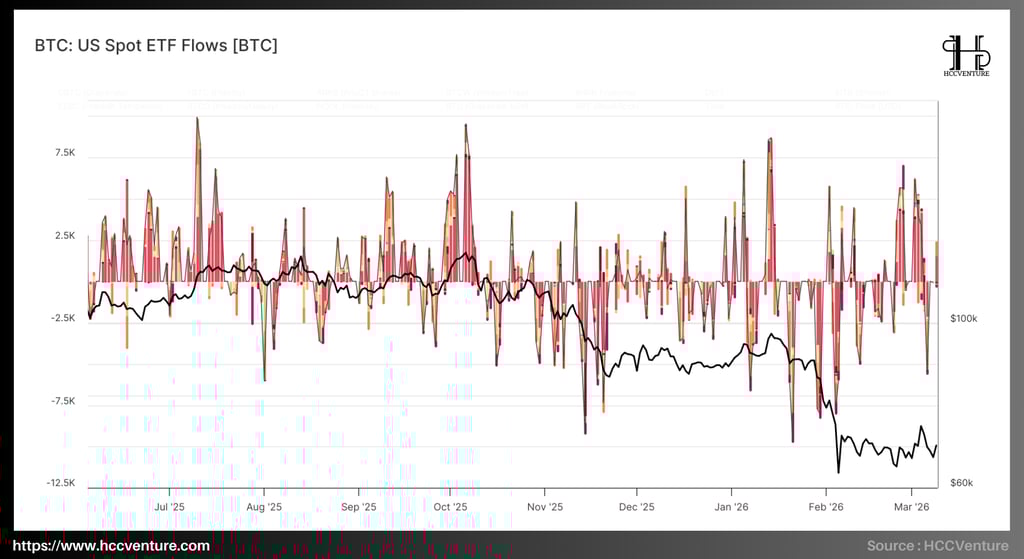
Since Bitcoin ETFs were approved and began trading widely, ETF inflows have become one of the main drivers of Bitcoin price volatility , particularly during periods of liquidity expansion or contraction. The latest data analysis shows that ETF inflows are clearly reflecting the portfolio repositioning of institutional investors after peaking in the 2024–2025 bull cycle .
During the strong market growth phase of 2025, especially as Bitcoin entered the $100,000–$110,000 range , many sessions recorded net ETF inflows of 6,000–8,000 BTC per day , reflecting a significant increase in investment demand from asset management funds and institutional investors. These large capital inflows directly contributed to expanding liquidity in the spot market , while simultaneously driving Bitcoin's price to set new highs in the cycle.
However, as the market entered a correction phase after its peak, the capital flow structure reversed significantly. From late 2025 to early 2026, the chart shows several sessions recording large net outflows , with volumes reaching -7,000 to -10,000 BTC in a single day , especially during the period when Bitcoin's price plummeted from around $100,000 to approximately $65,000 .
Compared to the 2021–2022 cycle, periods of weakening institutional capital flows often coincide with times when market unrealized profits decline sharply and investors take profits or rebalance their portfolios. However, the difference in the current cycle lies in the fact that the participation of ETFs makes institutional capital flows more transparent and directly measurable through on-chain data and ETF flow data .
The emergence of spot Bitcoin ETFs has significantly altered the liquidity structure of the crypto market. Instead of relying solely on capital flows from traditional crypto exchanges, the market now receives funding from large financial institutions, pension funds, investment funds, and global asset managers .
Assessment and Conclusion
A combination of on-chain indicators and derivative market data suggests that Bitcoin is currently maintaining a fragile consolidation phase below the psychological threshold of $70,000 , reflecting a liquidity rebalancing phase after the market experienced a sharp correction from its cyclical peak. Key quantitative indicators agree that buy-side momentum has weakened significantly , leaving the market lacking sufficient demand to establish a sustainable uptrend in the short term.
One of the clearest signals comes from the Realized Profit (30-day Moving Average) indicator . Recent data shows that the 30-day average realized profit has sharply declined from over $1 billion per day to around $350–400 million per day , equivalent to a decrease of over 60% compared to the previous period. This significant contraction in realized profits reflects investors' increasing unwillingness to trade at high prices , indicating a clear weakening of speculative demand and new demand.
Although on-chain indicators suggest a weakening liquidity environment, market data also records initial signs of stabilization beneath the price surface . Specifically, selling pressure in the spot market is showing signs of easing, evidenced by a slight improvement in the spot Cumulative Volume Delta (CVD) and increased buy order absorption on major exchanges.
Furthermore, options order flow data shows a decreasing Put/Call ratio , reflecting a gradual increase in demand for upside through call options. In particular, the $75,000 strike price is emerging as a key gamma magnet , where a large concentration of options positions could generate hedging flows from market makers, pushing Bitcoin's price towards this area should new demand emerge.
Disclaimer: The information presented in this article is the author's personal opinion in the field of cryptocurrency. This is not financial or investment advice. All investment decisions should be based on careful consideration of your personal portfolio and risk tolerance. The views expressed in this article do not represent the official stance of the platform. We recommend that readers conduct their own research and consult with experts before making any investment decisions.
Compiled and analyzed by HCCVenture
Follow HCCVenture here: https://link3.to/holdcoincventure
Explore HCCVenture group
HCCVenture © 2023. All rights reserved.


Connect with us
Popular content
Contact to us
E-mail : sp_contact@hccventure.com
Register : https://linktr.ee/holdcoincventure
Disclaimer: The information on this website is for informational purposes only and should not be considered investment advice. We are not responsible for any risks or losses arising from investment decisions based on the content here.
TERMS AND CONDITIONS • CUSTOMER PROTECTION POLICY
ANALYTICAL AND NEWS CONTENT IS COMPILED AND PROVIDED BY EXPERTS IN THE FIELD OF DIGITAL FINANCE AND BLOCKCHAIN BELONGING TO HCCVENTURE ORGANIZATION, INCLUDING OWNERSHIP OF THE CONTENT.
RESPONSIBLE FOR MANAGING ALL CONTENT AND ANALYSIS: HCCVENTURE FOUNDER - TRUONG MINH HUY
Read warnings about scams and phishing emails — REPORT A PROBLEM WITH OUR SITE.