


On-chain analysis for week 4/2026: Stablecoins are not weakening, but repositioning
Recent developments suggest that stablecoins are entering a structural phase of development, fundamentally different from previous cycles, with many countries experimenting with or deploying national stablecoins and CBDCs.
2/3/202611 min read
Market Summary
Commercial stablecoins (USDT, USDC, PYUSD, EURC, XSGD…) and CBDCs are not mutually exclusive , but are forming a parallel model. Central banks focus on controlling monetary sovereignty, while private stablecoins act as a flexible liquidity layer , serving cross-border transactions, capital markets, and the digital economy.
The total supply of stablecoins has increased sharply from the 2022–2023 cycle bottom, far surpassing historical lows and approaching previous peaks, indicating that underlying liquidity is being regenerated . The volume of on-chain stablecoin transfers and the number of transactions have both shown sustainable growth, without exhibiting characteristics of short-term speculative surges, reflecting genuine demand . Stablecoin supply on exchanges and exchange buying power suggest that capital remains ready for disbursement, albeit at a more cautious pace compared to the euphoric period.
The fact that countries are researching national stablecoins or CBDCs is often misinterpreted as a threat to private stablecoins. However, data and practice suggest the opposite trend.
More importantly, the increasing backing of stablecoins by US Treasuries and high-quality traditional assets demonstrates that deep integration between TradFi and Crypto is underway, significantly reducing systemic risk compared to previous cycles.
Analyzing on-chain metrics
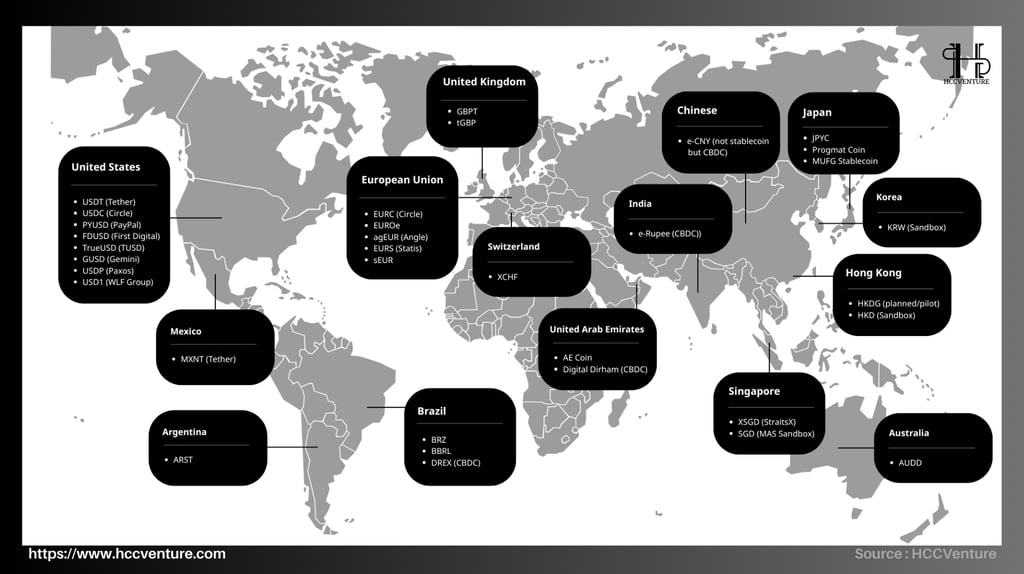

The map of stablecoin distribution by country reveals a structural reality: stablecoins are no longer a localized phenomenon of the crypto market , but have evolved into a layer of digital monetary infrastructure parallel to the traditional fiat currency system , encompassing most major financial centers around the world.
Currently, the total global stablecoin market capitalization exceeds $250 billion , significantly higher than the 2022–2023 cycle low (approximately $130 billion). This expansion is not uniform, but concentrated in regions with:
The financial system is well-developed.
There is a high demand for cross-border payments.
Or the domestic monetary environment is unstable.
The United States continues to be the world's largest issuer of stablecoins , with USD-backed stablecoins accounting for over 90% of the total global stablecoin market capitalization . Stablecoins such as USDT, USDC, PYUSD, FDUSD, GUSD, TUSD, and USD1 form a multi-tiered ecosystem , serving everything from retail and institutional transactions to cross-border payments.
The Eurozone (EU) is notable for its EUR-pegged stablecoins such as EURC, EUROe, agEUR, EURS, and sEUR. Although still small in scale compared to USD stablecoins, the total supply of EUR stablecoins has increased sharply from its 2023 lows , reflecting the demand for on-chain payments within the eurozone.
Compared to the low point of the previous cycle, the geographic coverage, supply scale, and economic role of stablecoins have now reached a whole new level , indicating that they are no longer a cyclical phenomenon, but a sustainable component of the global monetary system in the digital age .
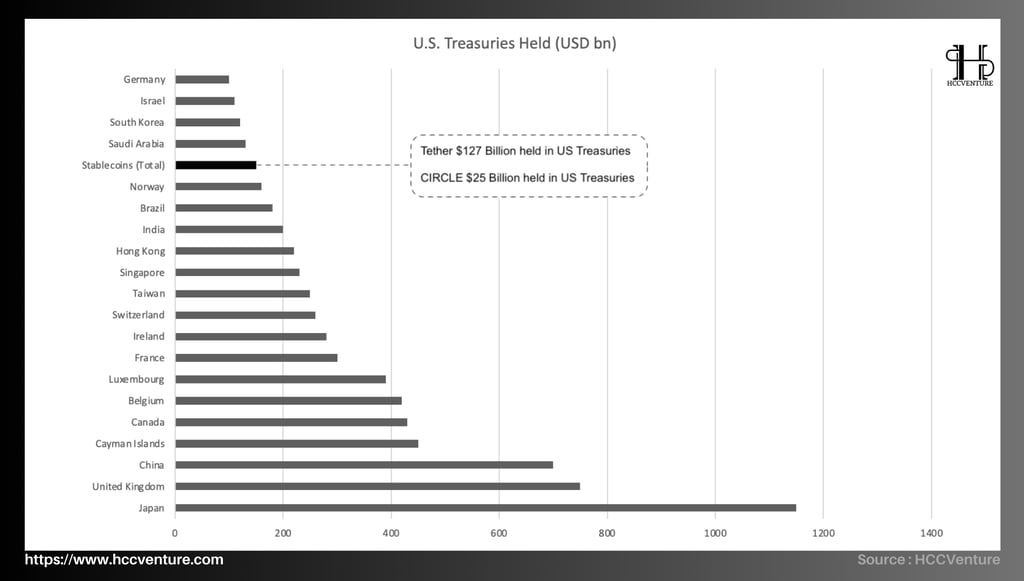
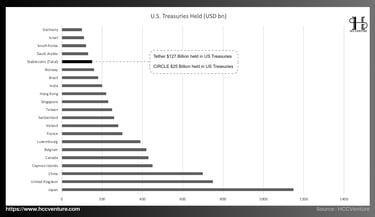
US Treasury Held (USD bn) represents a structural shift in the global financial system: stablecoins – through issuers such as Tether and Circle – have become one of the largest holders of US Treasury bonds, with holdings comparable in size to many sovereign nations .
Currently, the total amount of US Treasuries held by stablecoin issuers is approximately $150 billion , of which:
Tether holds approximately $127 billion.
Circle holds approximately $25 billion.
This scale places stablecoins above or on par with countries like Germany, Israel, South Korea, and Saudi Arabia, and close to the group of medium-to-large economies on the list of US debt holders.
Although their absolute size remains smaller than that of major financial powers, the key lies in the nature of stablecoin holders: they are not states or central banks, but private digital currency issuers that participate directly in the US public debt market.
The sharp increase in Treasuries held by stablecoin issuers shows that the role of stablecoins is shifting from a medium of exchange to a core financial infrastructure , both supporting crypto market liquidity and becoming an increasingly important component in the global USD ecosystem.

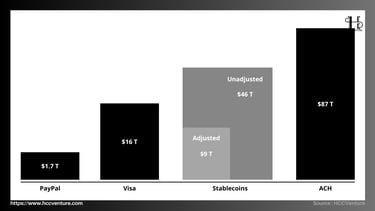
Stablecoins have reached annual transaction volumes that match, or even surpass, many traditional payment networks , when considered in terms of nominal (unadjusted) volume. Even after adjusting for insider transactions, wash transfers, and technical manipulation (adjusted), stablecoins still maintain a transaction volume comparable to major payment systems like Visa, and are second only to ACH – the backbone of interbank payments in the United States.
The unadjusted volume of stablecoins exceeds Visa's by nearly three times . This reflects the extremely high level of stablecoin usage in various operations.
Cross-border transactions.
Liquidity intermediary between exchanges.
DeFi, OTC, market-making và settlement on-chain.
Even with strict adjustments , excluding technical transactions that don't reflect ultimate economic needs, stablecoins still reach approximately $9 trillion per year , equivalent to over 50% of Visa's market capitalization and many times larger than PayPal.
Stablecoin supply is expected to increase sharply in 2024–2025, transfer volume and transaction count will reach historical highs, and buying power on and off exchanges will remain strong. This indicates that it is acting as a liquidity rail for the digital finance market, rather than just a "parking lot" for crypto traders.
Even after adjusting to remove the specific technical elements of blockchain, stablecoins still reach trillions of dollars annually , far surpassing traditional fintech platforms like PayPal and approaching global payment networks like Visa.
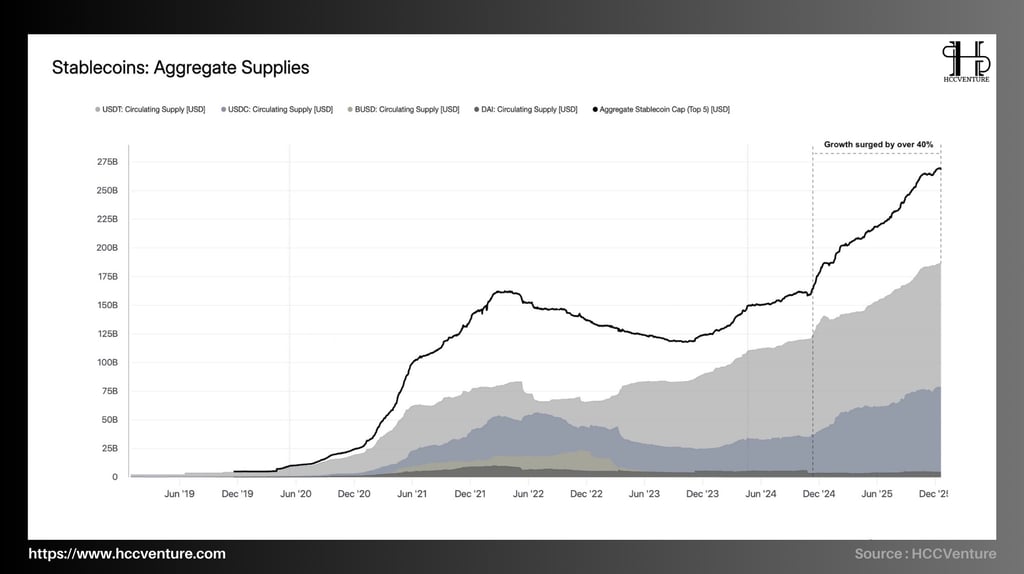
The total supply of stablecoins across the market has entered a distinct and structural liquidity expansion cycle , with growth exceeding 40% from the most recent cycle bottom. This is not a short-term speculative fluctuation, but rather a systemic reaccumulation of capital , reflecting the preparation of cash flow for large-scale risk reallocation phases within the digital asset ecosystem.
Compared to previous growth phases, the current stablecoin expansion is more durable, more diversified, and less reliant on leverage , thus serving as a liquidity platform for the emerging medium-term cycle.
Since the second half of 2024, the total supply of stablecoins has accelerated steadily , surpassing $170 billion and now approaching $270–280 billion , equivalent to a growth of over 40% in less than 12 months . This scale of expansion was only seen in the early stages of major bull cycles (2017 and 2020–2021).
A prominent feature of the current cycle is the internal restructuring of the stablecoin supply . USDT continues to play a pivotal role in liquidity, accounting for the largest share and being the main driver of growth. Meanwhile, USDC, after a sharp decline in 2023, has returned to a stable expansion trend, reflecting a recovery in institutional capital confidence.
The sharp increase in the total supply of stablecoins has clear economic implications: the market's capacity to absorb supply has improved significantly . With Bitcoin consolidating around key cost basis areas, the undeployed stablecoins act as potential demand (dry powder) .
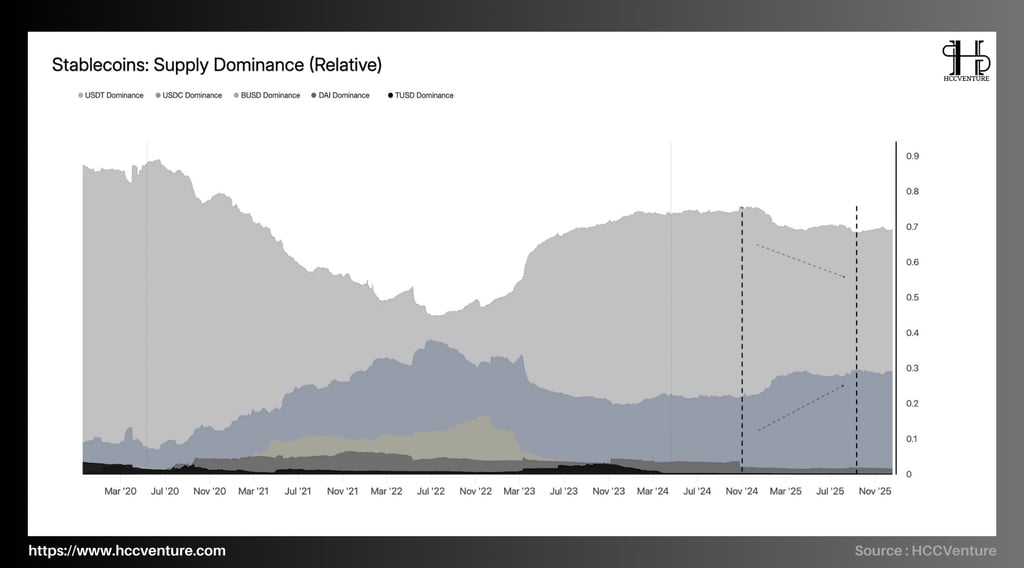
The dominant structure of stablecoin supply is entering a systemic rebalancing phase , with USDT continuing to play a key role as a liquidity pillar , while USDC shows a clear recovery in weighting after the sharp decline of 2022–2023. This shift not only reflects a technical adjustment in the stablecoin ecosystem, but also directly demonstrates the cautious and selective return of institutional capital to the crypto market .
During the 2020–2021 period, the decline in USDT dominance was accompanied by a rapid increase in USDC and BUSD, reflecting an extremely strong and risk-on liquidity environment . Conversely, the 2022–2023 period saw a surge in USDT dominance as the market entered a defensive phase.
By the end of 2025, USDT will still maintain dominance in the range of approximately 65–70% of the total stablecoin supply , lower than the 2023 defensive peak but significantly higher than the 2021 cycle bottom. This suggests that:
Market liquidity has returned.
But it remains in the form of a highly flexible stablecoin, prioritizing transactions and risk management .
The fact that USDT dominance did not decline sharply during a period when the total supply of stablecoins increased by more than 40% suggests that new capital is not in a hurry to shift to risky assets , but is still prioritizing a wait-and-see approach and gradual allocation.
One significant structural shift in the chart is the marked recovery of USDC dominance , from a low of under 20% in 2023 to approaching 30% by the end of 2025. Additionally, BUSD dominance nearing zero is a definitive change. However, instead of causing liquidity disruption, capital flows have been relatively smoothly reallocated to USDT and USDC .
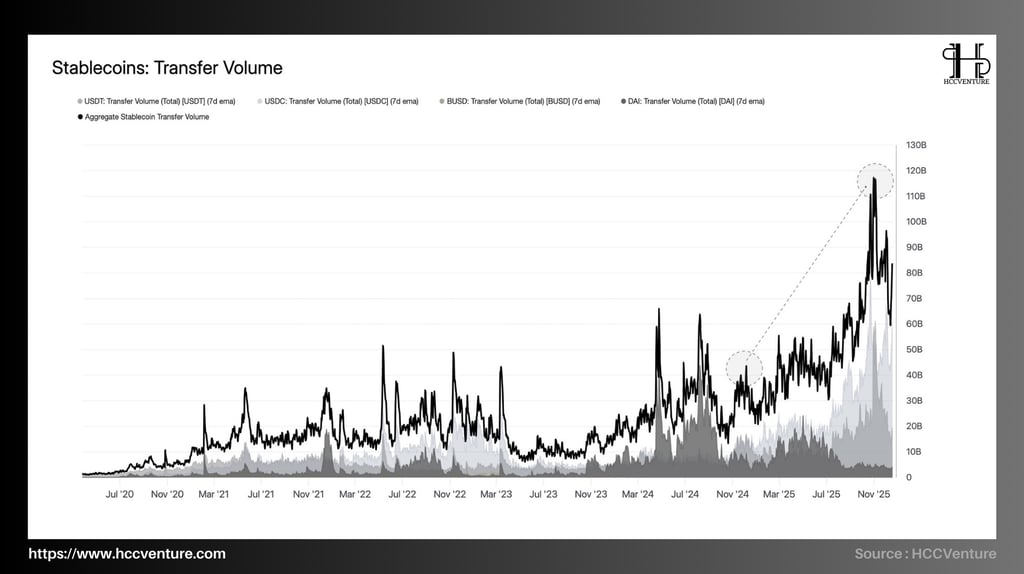
Stablecoin Transfer Volume is sending out one of the most important liquidity signals of the current cycle. The total volume of on-chain stablecoin transfers has surged and set new highs , far exceeding the average of previous accumulation phases, and approaching – and at times surpassing – the peaks observed during the 2021 growth cycle.
This increase is occurring while Bitcoin's price has not yet entered a trend extension phase , indicating that liquidity is circulating and being strongly reallocated , but remains in a "waiting for confirmation" state rather than being massively invested in risky assets. This is characteristic of a cyclical preparation phase , not an euphoric phase.
The structural difference is that transfer volume has far exceeded the average of the previous cycle , with local peaks reaching over $100–120 billion/day (7D EMA) , while Bitcoin price has remained mostly fluctuating within a medium-term range.
Compared to the 2022–2023 cyclical low, when transfer volume was often only around $10–15 billion , the current level is 6–8 times higher , reflecting a clear return of systemic liquidity .
Market capitalization is moving, evaluating, and repositioning , but has not yet entered a full-blown risk-taking phase. This is a common state preceding sustained trend extensions , when the market needs to accumulate sufficient confidence and confirmation of real demand.
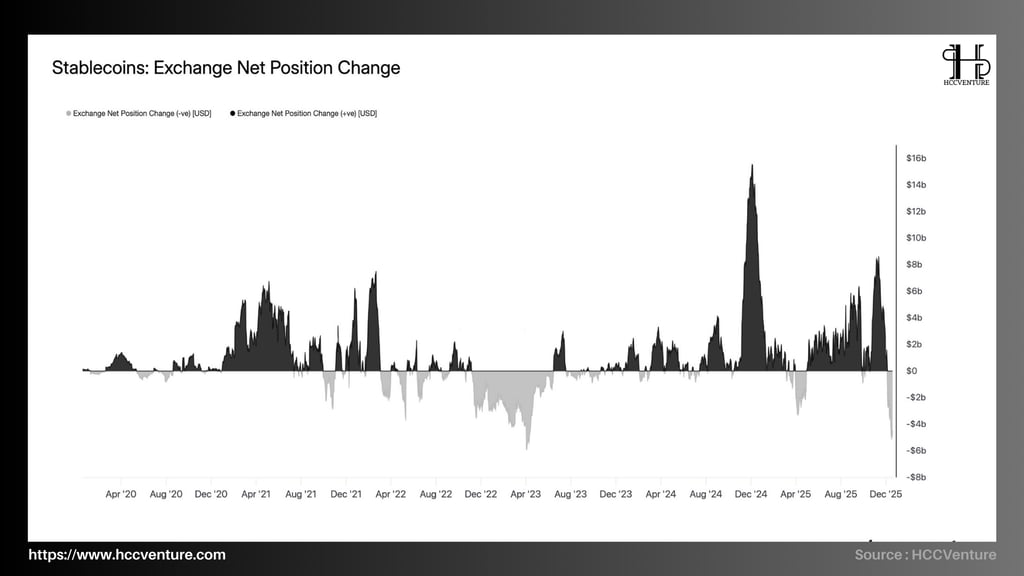
Stablecoin Exchange Net Position Change reveals a crucial structural picture: stablecoin flows are returning to exchanges with significantly greater intensity and frequency compared to previous accumulation phases . While Bitcoin's price remains in a medium-term accumulation zone, the behavior of stablecoin flows suggests the market is no longer in a defensive stance , but is entering a phase of risk reallocation .
A notable development is the emergence of large-scale stablecoin net inflows , at times exceeding $10–15 billion , significantly higher than the average of previous cycles. Simultaneously, while net outflows still exist, they are no longer as prolonged or panic-driven as in 2022. Compared to the 2023 cycle low – when the exchange net position frequently remained below zero – the current level indicates that liquidity has returned to a more active state .
A key characteristic of the current phase is the fragmented but cyclical flow of stablecoins onto exchanges , rather than a single boom. This reflects:
Investors continuously refinance their trading accounts .
The market has expectations of action in the short and medium term .
But there hasn't been a widespread FOMO (fear of missing out) phenomenon yet.
The alternation between small inflows and outflows indicates a process of price exploration and supply absorption , rather than a distribution of peaks or a sell-off. Structurally, this is a necessary condition for a trend extension phase. History shows that no sustainable bull cycle forms when stablecoins are constantly withdrawing from exchanges . Therefore, the current state signifies base building , not weakness.
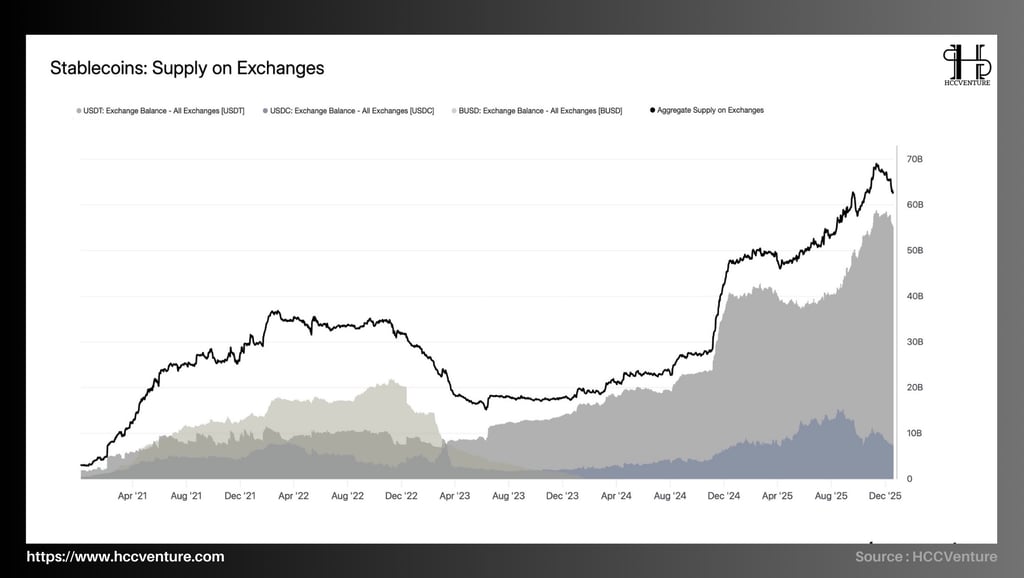

Stablecoin supply on exchanges reflects a structurally significant state for the entire crypto market: the amount of stablecoins held on exchanges has surged and remained at historically high levels , far exceeding the averages of previous cycles. Compared to the 2022–2023 cycle bottom, the current landscape indicates a complete reversal in capital status , from liquidity contraction to active liquidity accumulation.
The chart shows a strong, steep, and sustained upward trend in aggregate stablecoin supply on exchanges. The total value of stablecoins on exchanges has exceeded $60–70 billion , significantly higher than:
The 2023 low (below $20 billion).
And approaching, or even surpassing, the highs of the 2021 cycle.
The key difference is that this increase occurred in a low-leverage, neutral funding environment , indicating significantly better liquidity quality.
From a cyclical structure, this is a necessary condition for a sustained trend extension phase. History shows that no strong growth cycle begins when stablecoins on exchanges are at low levels , and conversely, major upward phases are always driven by a period of liquidity accumulation similar to the current situation.
A large amount of stablecoins on exchanges means better supply absorption , reducing the risk of liquidity collapse. But it also increases market sensitivity , as capital outflows or withdrawals can happen quickly. However, in the current context, data does not show signs of large-scale stablecoin withdrawals from exchanges – a signal usually associated with a defensive phase or the end of a cycle.
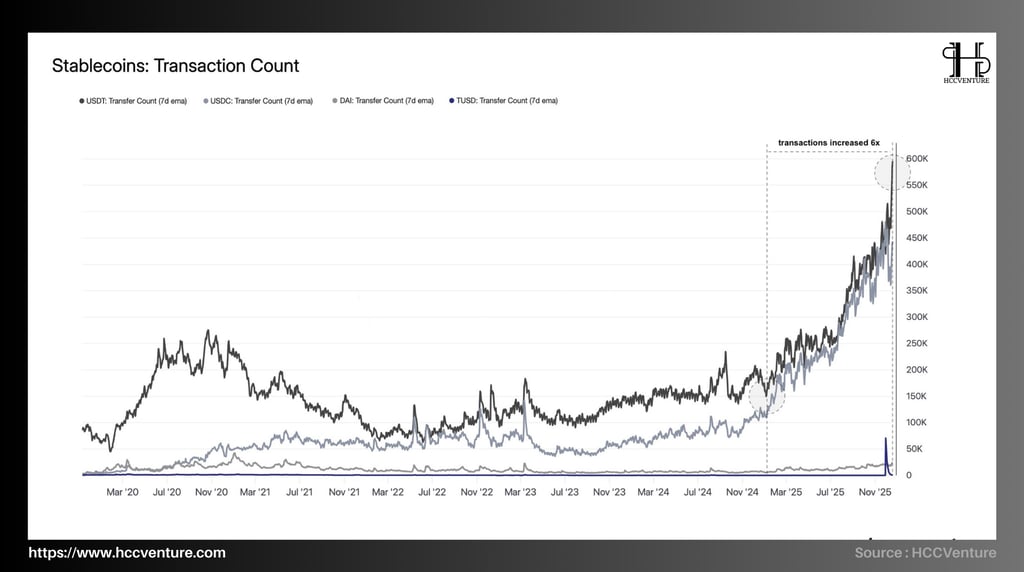
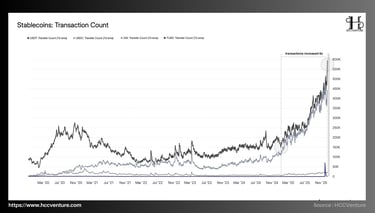
Stablecoin Transaction Count – the number of stablecoin transactions on the chain – has entered a structural expansion phase, with transaction speeds skyrocketing many times over compared to the 2022–2023 cycle bottom . Unlike short-term speculative surges in the past, this increase is occurring simultaneously with low leverage, neutral funding, and a concentration of stablecoin capital flows on exchanges , reflecting a genuine liquidity activation process , rather than speculative rotation.
The chart shows a steep and continuous upward trend , especially from the end of 2024:
The total number of stablecoin transactions has increased approximately sixfold since its 2023 low .
USDT and USDC are expanding sharply at the same time, indicating that both offshore and institutional capital are participating .
Instead of short-term spikes followed by collapses, the trend is one of sustained upward movement , reflecting real economic activity across the supply chain.
A key point in the current data is that while the transaction count has increased sharply, it hasn't been accompanied by panic selling from exchanges, nor has it shown extreme spikes like during the liquidity crisis. This suggests that current stablecoin transactions are driven by reallocation and position preparation, rather than emotional reactions or extreme defensive actions.
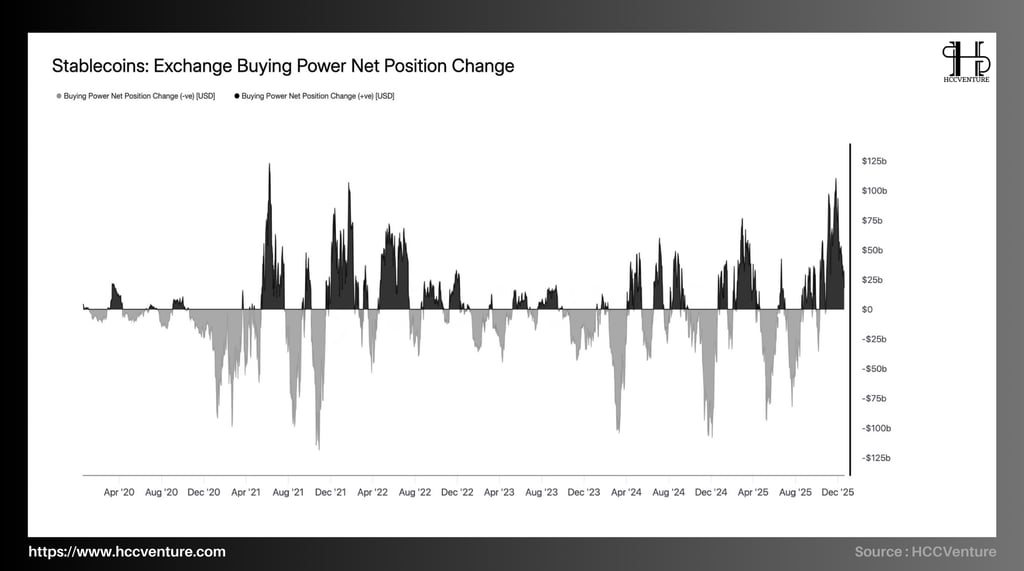

The Net Position Change in Stablecoin Exchange Buying Power directly reflects the net change in stablecoin buying power present on exchanges —that is, the capital readily available to purchase crypto assets. Compared to the downturn of 2022–2023, when buying power was consistently negative and depleted, the current state reflects a clear reversal of capital flows , indicating that stablecoins are no longer leaving exchanges as a defensive measure, but are returning to await deployment.
Positive buying power phases are appearing more frequently and lasting longer , with positive peaks reaching tens to over 100 billion USD , equivalent to or exceeding the accumulation phases at the beginning of the previous cycle, and no longer in a continuous and prolonged negative state like during the recession. This confirms that buying power has returned to the trading system , but has not yet been immediately and massively disbursed.
The accumulation of buying power also means the market is becoming more sensitive to macroeconomic news and policies. A portion of this buying power can quickly turn into buying pressure when a catalyst appears. However, there are no signs of depleted buying power , nor is there any sign of mass distribution – a common occurrence before major negative reversals.
Assessment and Conclusion
Stablecoins are no longer driven by short-term speculative cycles , but are entering a more structured and sustainable liquidity accumulation phase . The consolidated supply of stablecoins has recovered strongly from its 2022–2023 lows and is now significantly higher than during the deep market downturn, reflecting the return of cash flows into the digital asset ecosystem.
Simultaneously, the volume of on-chain stablecoin transfers and the number of transactions both reached new all-time highs, far surpassing the previous cycle's lows. This confirms that stablecoins are increasingly being used as a means of payment, a transaction intermediary, and a tool for capital circulation , rather than just as a "temporary safe haven."
A recurring theme throughout the charts is the increasing role of stablecoins as financial entities tied to traditional markets . The growing backing of stablecoins by US Treasuries, coupled with the scale of US government bond holdings comparable to many medium-sized countries, indicates that stablecoins have become an intermediary liquidity channel between TradFi and Crypto .
Based on all the data, it can be concluded that stablecoins are in a liquidity accumulation phase , rather than a cyclical peak or a weakening phase. Compared to the lowest point of the previous cycle, most key indicators – from total supply, transfer volume, transaction volume to buying power – have significantly improved and remained at higher levels consistently.
Disclaimer: The information presented in this article is the author's personal opinion in the field of cryptocurrency. This is not financial or investment advice. All investment decisions should be based on careful consideration of your personal portfolio and risk tolerance. The views expressed in this article do not represent the official stance of the platform. We recommend that readers conduct their own research and consult with experts before making any investment decisions.
API & Data : Glassnode
Compiled and analyzed by HCCVenture
Join the HCCVenture organization here: https://link3.to/holdcoincventure
Explore HCCVenture group
HCCVenture © 2023. All rights reserved.


Connect with us
Popular content
Contact to us
E-mail : sp_contact@hccventure.com
Register : https://linktr.ee/holdcoincventure
Disclaimer: The information on this website is for informational purposes only and should not be considered investment advice. We are not responsible for any risks or losses arising from investment decisions based on the content here.
TERMS AND CONDITIONS • CUSTOMER PROTECTION POLICY
ANALYTICAL AND NEWS CONTENT IS COMPILED AND PROVIDED BY EXPERTS IN THE FIELD OF DIGITAL FINANCE AND BLOCKCHAIN BELONGING TO HCCVENTURE ORGANIZATION, INCLUDING OWNERSHIP OF THE CONTENT.
RESPONSIBLE FOR MANAGING ALL CONTENT AND ANALYSIS: HCCVENTURE FOUNDER - TRUONG MINH HUY
Read warnings about scams and phishing emails — REPORT A PROBLEM WITH OUR SITE.