On-chain analysis for week 23/2026: Short-term selling pressure from retail investors
Bitcoin briefly declined to the $60,000 price level, triggering a large-scale wave of leveraged liquidations across the derivatives market, but a significant number of whales are accumulating in this area.
PHÂN TÍCH
6/3/202612 min read
On-chain analysis week 23/2026: Short-term selling pressure from retail investors
Bitcoin briefly declined to the $60,000 price level, triggering a large-scale wave of leveraged liquidations across the derivatives market, but a significant number of whales are accumulating in this area.
Analysis • 11 June, 2026


Market Summary
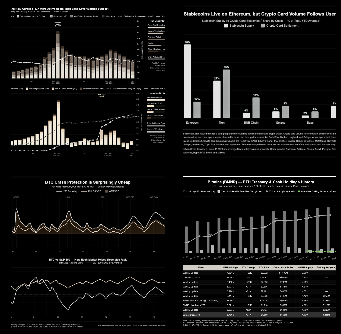
Historically, Bitcoin's periods of increased trading volume accompanied by price declines often occur during market cleanups . Spot trading shows that selling pressure continued to dominate the market last week. The Spot Volume Delta remained in deep negative territory as the volume of active sell orders consistently outnumbered buy orders. The sharp increase in spot trading volume during the price decline does not reflect an expansion of new investment demand but is primarily due to exiting positions by existing investors.
One of the most notable signals of the week was the sustained outflow of capital from US Bitcoin Spot ETFs. Despite a sharp increase in ETF trading volume due to increased price volatility, net inflows remained negative for much of the week. ETF investor return data suggests average returns are approaching the accumulation cost range.
In the options market, the need for portfolio protection has increased significantly. The 25-Delta Skew index has shifted strongly toward put options, while the spread between maturities continues to widen. This signals that institutions and professional traders are increasing their defenses against the risk of adverse short-term volatility.
Despite the sharp price correction, the fundamental indicators of the Bitcoin network remain remarkably stable. The number of daily active addresses continues to stay above 850,000-950,000 , significantly higher than the 2022 cycle bottom. The volume of value transferred across the network also remains high, reflecting the continued expansion of Bitcoin usage.
One of the most positive factors in the current context is that the supply allocation structure remains strongly skewed towards long-term investors. UTXO and HODL Waves data show that the proportion of supply held by Long-Term Holders continues to remain near the cyclical peak. Although short-term investors are under significant pressure from declining returns, the long-term holding group has not yet shown signs of large-scale distribution.
Analyzing on-chain metrics
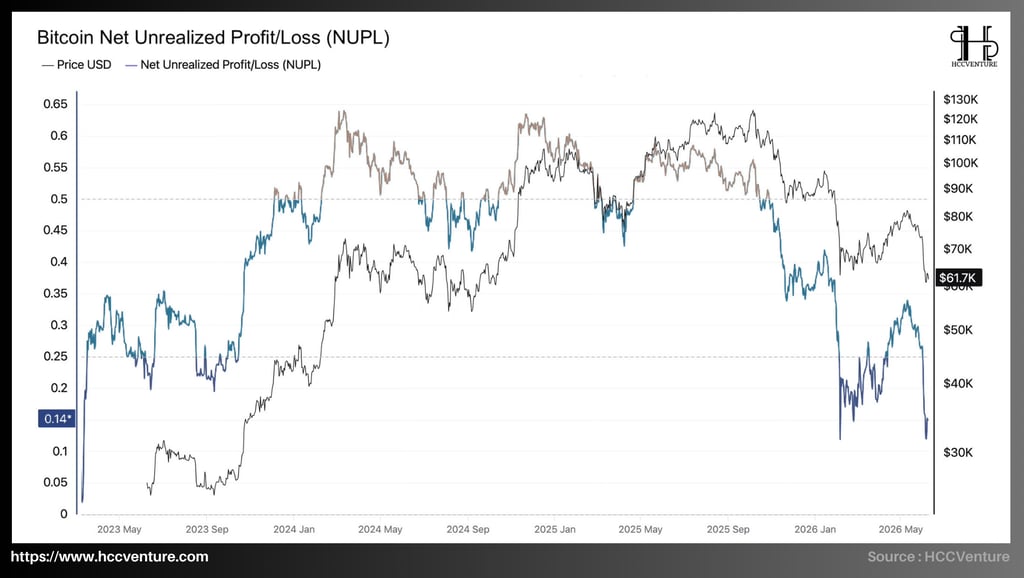
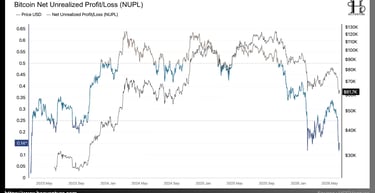
Net Unrealized Profit/Loss (NUPL ) reflects the sharp decline in Bitcoin's value to 0.14 , the lowest level since the deep correction in early 2023. Compared to the most recent cycle, when this indicator reached approximately 0.62–0.63 at the end of 2024-2025, it has decreased by 77%. More importantly, NUPL is returning to the range seen during previous cycles' capital reaccumulation phases, indicating that a large portion of speculative profits generated during the earlier growth phase has been absorbed and significantly redistributed.
Observing the historical trends on the chart shows that the period from Q4/2023 to Q3/2025 was the strongest period of profit expansion in the current cycle. During this time, NUPL consistently fluctuated above the 0.50 threshold and repeatedly approached the 0.60-0.63 range.
This area typically reflects a situation where a large portion of the Bitcoin supply holds significant unrealized profits. Historical statistics from HCCVenture show that whenever the NUPL exceeds 0.60, the percentage of investors holding unrealized profits across the network reaches extremely high levels, and the pressure to realize those profits also begins to increase.
However, since Bitcoin's all-time high of $120,000, the NUPL has consistently fallen to 0.14 , a decline reflecting a sharp contraction of unrealized profits in the market. Objectively speaking, most of the profits generated during the 2024-2025 growth period have been wiped out through prolonged price corrections, leverage liquidation, and investor profit-taking.
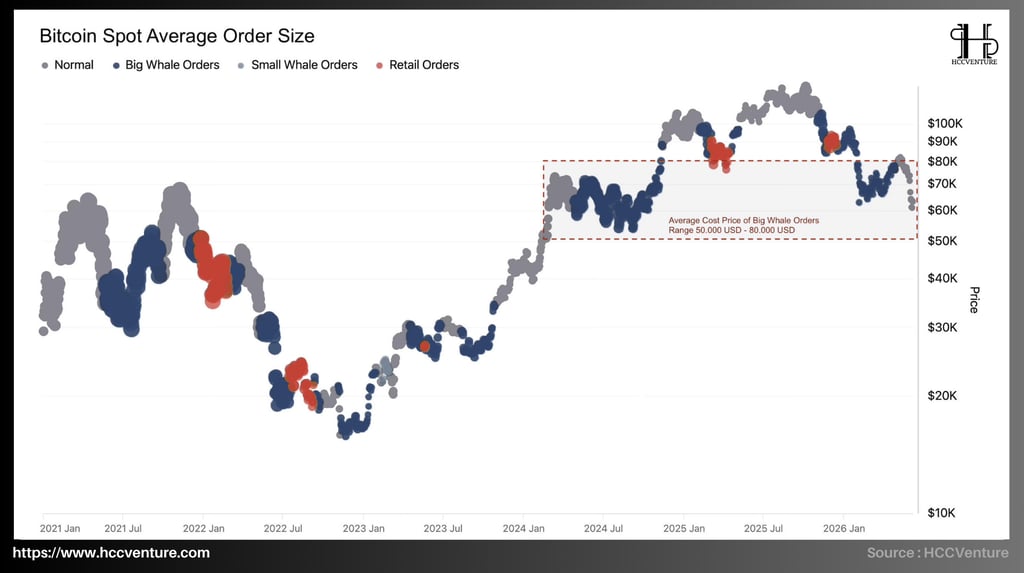
Whale money flows continue to dominate the market structure, with the $50,000-$80,000 price range becoming a crucial capital base for the cycle. Data from HCCVenture shows that Bitcoin is still being led by Big Whale Orders , while the trading volume of retail investors continues to decline significantly compared to previous peak periods.
The price range of $50,000 to $80,000 is emerging as the primary accumulation zone for large-scale orders, forming a crucial cost of capital base for the entire current market structure.
After Bitcoin bottomed out around $15,500 in late 2022, whale activity continued to increase sharply throughout 2023 and early 2024. By the time the market reached a new all-time high above $120,000, the majority of liquidity still came from large-scale orders rather than retail capital.
Institutional capital participation has become the main driving force of the market, significantly replacing the role of retail speculative money that dominated previous cycles.
Having been absent from the market for over a year, these whales have resumed buying Bitcoin at the Average Cost Price of Big Whale Orders (USD 50,000 to USD 80,000) . This large and mysterious flow of money continues to buy amidst extreme market panic. Compared to the all-time high (ATH), this price range is clearly very discounted for long-term investors.
The fact that the majority of institutional liquidity is formed in this area is particularly significant. In previous cycles, price zones with concentrated large volumes of accumulated volume often acted as long-term structural support areas because this is where supply transferred from weaker investors to owners with stronger financial capacity.
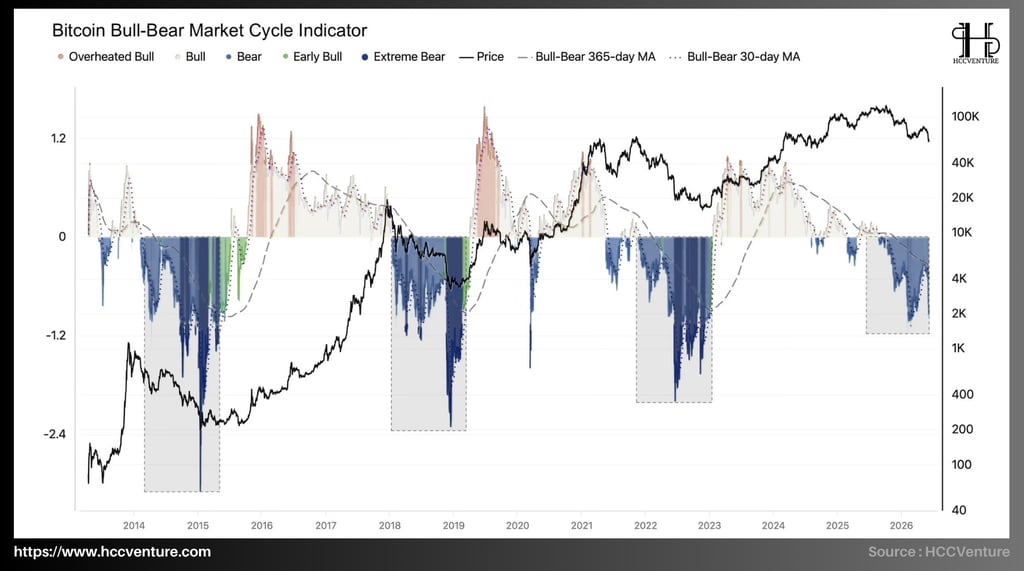
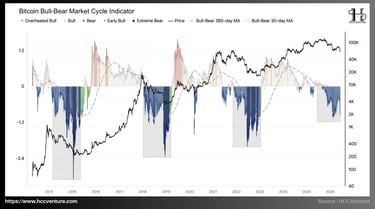
The Bitcoin Bull–Bear Market Cycle identifies the cyclical state of Bitcoin by combining price momentum, realized profit trends, on-chain capital flows, and long-term cyclical moving averages. This indicator has been consistently in negative territory since the beginning of 2026 and is currently deep within Bear Mark territory .
The 30-day Bull-Bear continues to remain below equilibrium while the 365-day Bull-Bear maintains a downward trend , confirming that capital revaluation remains the dominant driver of the market.
Based on historical data from 2013 to the present, the current structure has many similarities to the medium-term bear market phases that occurred after the peaks of the cycles in 2014, 2018, and 2022, when the market needed a significant amount of time to absorb the accumulated profits from the previous growth cycle.
In the current cycle, Bitcoin peaked above $120,000 by the end of 2025 before entering a sharp correction phase. Since then, the Bull-Bear Indicator has continuously declined and is currently fluctuating in deep negative territory, similar to the Bear Market phases that occurred in 2015, 2019, and 2022.
Although the current correction is significantly less severe than the bear markets of 2015, 2018, and 2022, cyclical data suggests that new capital inflows are not yet strong enough to reverse the long-term trend. The 30-day Bull-Bear line continues to remain below neutral, while the 365-day Bull-Bear line is still declining, confirming that the process of revaluation and supply absorption remains a prominent feature of the market.
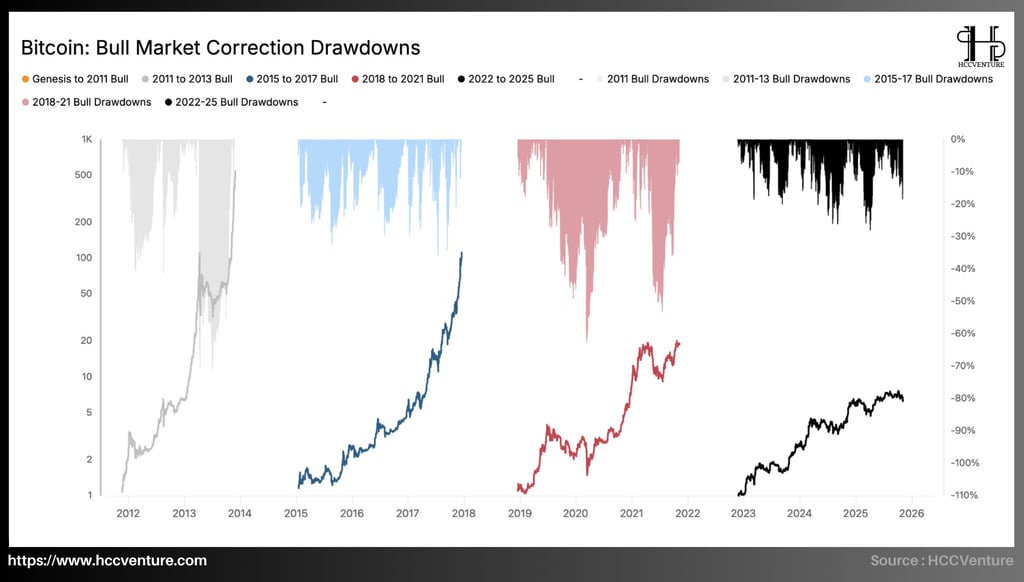
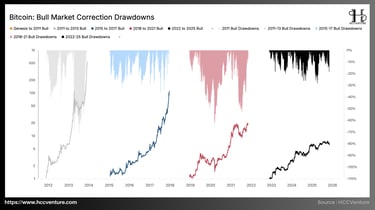
According to data from HCCVenture, the Bitcoin Bull Market Correction Drawdowns indicator shows that the maximum drawdown of the current cycle fluctuates around -25% to -30%, significantly lower than previous bull cycles where Bitcoin frequently experienced corrections of -35% to -60% before completing a long-term uptrend. Using the current drawdown of approximately -25% to -30% as a benchmark, Bitcoin is currently at the lowest end of the dynamic range of historical bull cycles.
The 2011–2013 cycle frequently saw drawdowns exceeding -40%.
The 2015–2017 cycle saw several corrections ranging from -35% to -40%.
The 2018–2021 cycle saw periods of decline exceeding -50% and even approaching -60%.
Meanwhile, the current cycle has yet to see any corrections of a similar magnitude. This confirms that current volatility remains within the historical limits of a long-term bull market and has not yet created signs of structural recession like those seen at true cycle peaks.
Although Bitcoin has surged from its lows of around $15,500 to over $120,000, representing a gain of over 670%, corrections throughout the cycle have been relatively limited. Most drawdowns have ranged from -10% to -25% , with the deepest drop only around -30%.
In other words, much of the gains from the growth cycle have been preserved. Compared to previous cycles, where prices typically lost 50-70% of their gains during intermediate correction phases, the current decline is still relatively limited.
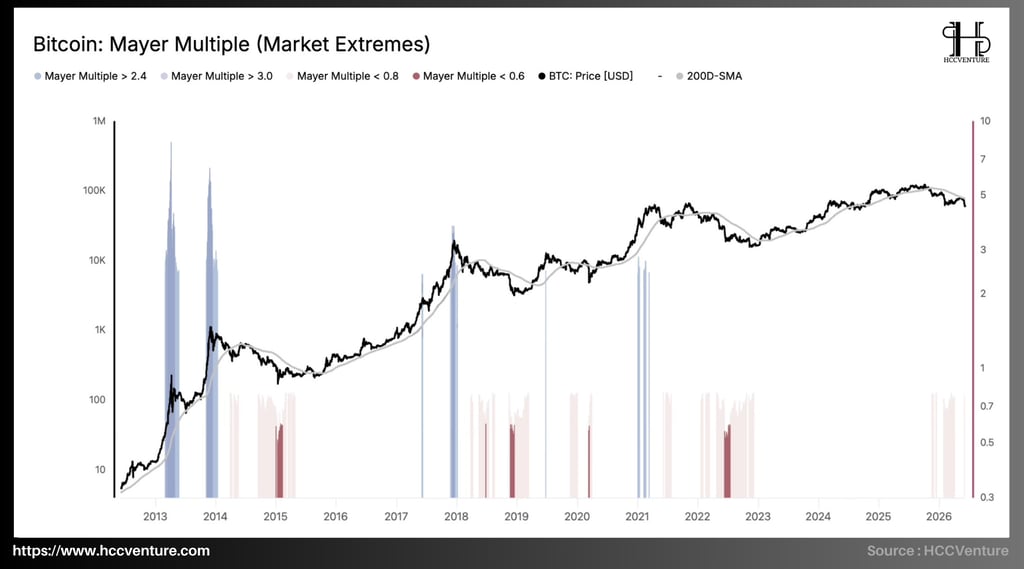
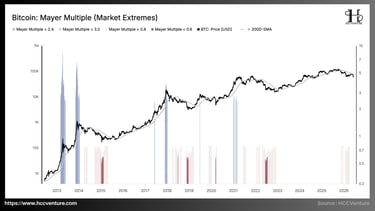
During the 2013 cycle, the Mayer Multiple repeatedly exceeded 3.0 and at times approached 5.0. Similarly, the peak of the 2017 cycle and the early part of 2021 also saw strong expansions as the index entered extreme zones. In contrast, the current cycle is completely different; although Bitcoin has risen from its low of around $15,500 at the end of 2022 to over $120,000 at the end of 2025, the Mayer Multiple has only fluctuated around 1.8–2.0 times at the highest point of the cycle.
The significant gap between the current level and the 2.4–3.0x range indicates that the market's level of speculation is much lower than in previous bubble phases. In other words, Bitcoin's growth momentum in this cycle is supported by the expansion of its long-term base value rather than solely based on short-term speculative capital flows.
Instead of witnessing the Mayer Multiple surge to extreme levels as in previous cycles, the market is currently correcting through time rather than price, meaning the 200-day moving average is continuing to rise while the price corrects back towards the underlying trend.
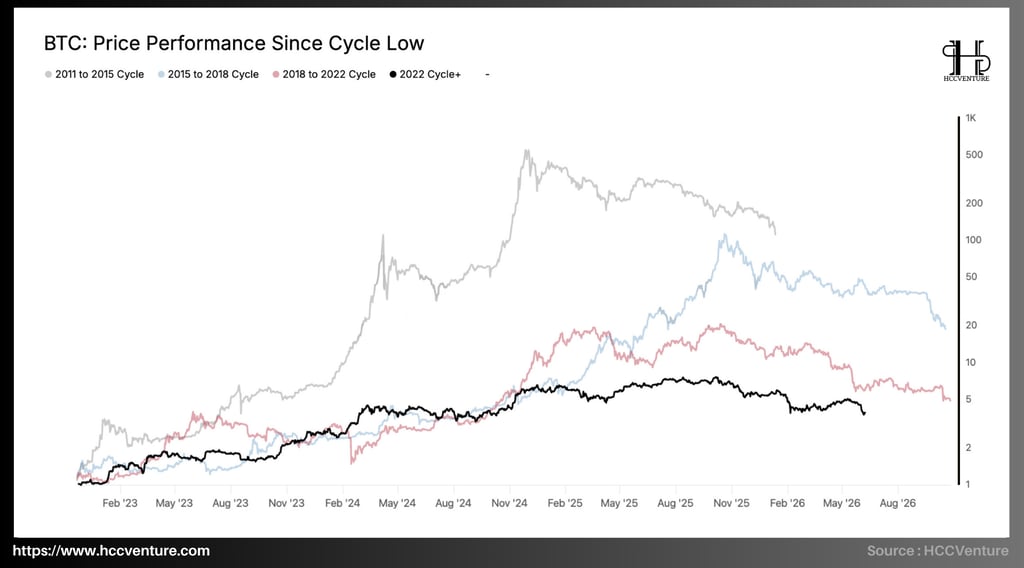
In previous cycles, Bitcoin often experienced multiple corrections of 40% to 60% even within bull markets. The 2015–2018 and 2018–2021 cycles saw several periods of sharp declines before continuing to expand to new highs. Conversely, the 2022–2026 cycle shows a more stable growth performance curve. Although the market corrected from its peak of $123,000 to the $75,000 area, the maximum decline was significantly lower than the extreme corrections seen in history.
The holdings of financial institutions, spot ETFs, and long-term investors are currently at their highest levels in history. The circulating supply is increasingly less affected by short-term speculation, significantly reducing cyclical volatility.
Observing the declining trend in performance from one cycle to the next, it's clear that Bitcoin is following a maturation pattern similar to traditional financial assets. The continuous contraction of returns doesn't reflect a decline in the asset itself, but rather the ever-increasing scale of the network. This is a common characteristic of assets transitioning from explosive growth to long-term value accumulation.
Research and Analysis
Market Summary
Analyzing on-chain metrics
Net Unrealized Profit/Loss (NUPL)
Big Whale Orders
Bitcoin Bull–Bear Market Cycle
Bitcoin Bull Market Correction Drawdowns
Mayer Multiple
Price Performance Since Cycle Low
Realized Loss của Long-Term Holders
Percent of Supply Last Active 1+ Years Ago
Average Cost Basis of US Spot ETF Deposits
Assessment and Conclusion
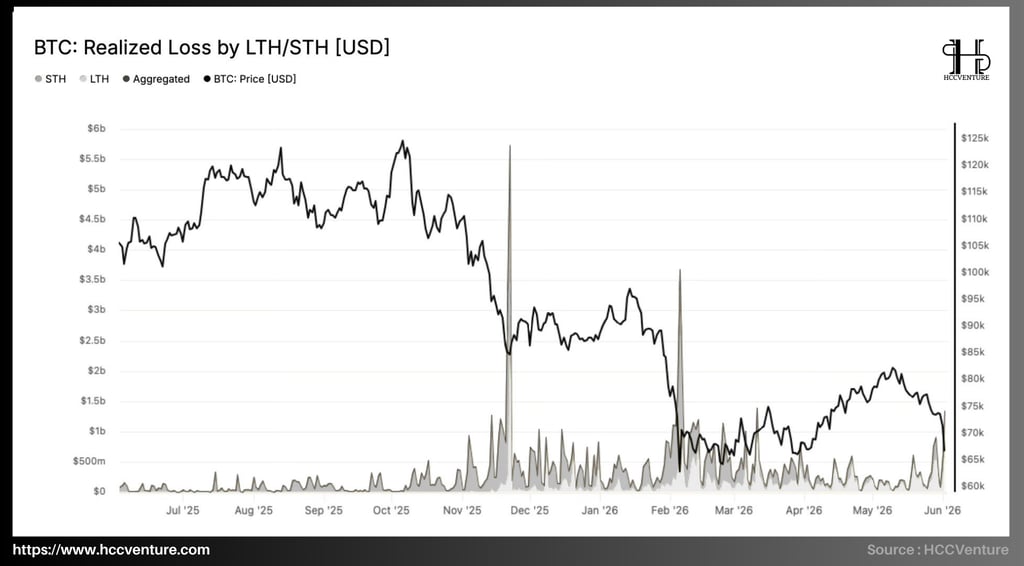
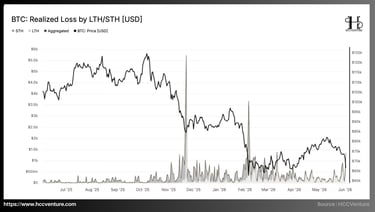
Realized Loss for Long-Term Holders and Short-Term Holders confirms the end-of-cycle redistribution phase. The total network-wide Realized Loss has increased significantly compared to the end of 2025, but remains considerably lower than large-scale capitulation events that occurred in previous cycles. This indicates that the market is undergoing a process of repricing and redistributing supply, but a systemic panic has not yet emerged.
During sharp corrections from the $120,000 region down to below $90,000 and then to the $70,000 area , losses recorded from the STH group frequently reached several hundred million dollars to over $1 billion per day. This reflects the fact that the majority of buyers during the euphoric late-cycle phase are being forced to close their positions at prices significantly lower than their cost basis.
The group of investors who enter the market latest are usually the most affected when the market reverses, due to their high cost basis and high sensitivity to price fluctuations.
In contrast to the STH group, data shows that the Realized Loss of Long-Term Holders (LTH) remained relatively low for most of the time. Although there were some spikes in the actual loss value, these were mostly localized and short-lived, but this indicates that the majority of long-term holdings have not yet participated in the widespread sell-off.
In previous Bitcoin cycles, true bear market phases typically only formed when the LTH pool began recording large and sustained Realized Losses for several consecutive months. At that point, a large volume of low-cost supply was released into the market, creating structural supply pressure.
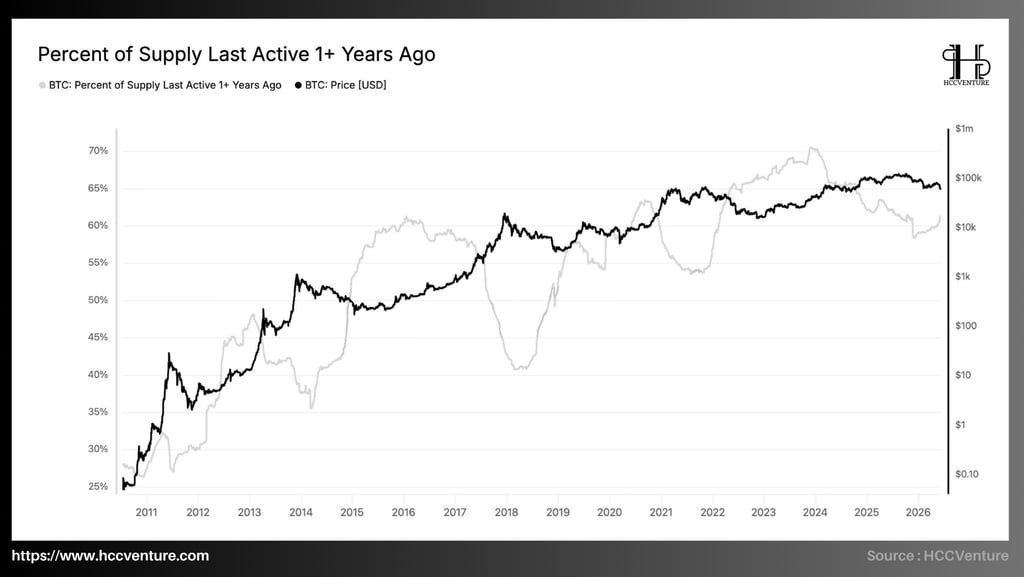
Percent of Supply Last Active 1+ Years Ago indicates that approximately 60–61% of the total Bitcoin supply has remained unmoved for over a year. While this is down 70% from its historical peak in 2024, the current level is still significantly higher than for most of Bitcoin's history.
From a cyclical perspective, the maintenance of the ratio of real estate supply over one year above 60% reflects that the distribution process after the peak has occurred but has not yet changed the long-term accumulation structure of the network.
During periods of strong market growth, long-term investors tend to realize profits, causing the supply of unsold properties to decrease. Conversely, in prolonged bear markets, supply is gradually absorbed by long-term holders, causing this index to rise.
At the bottom of the cycle in 2018, the percentage of unsold properties (those with a lifespan of over one year) reached approximately 60%.
In the post-bear market period of 2022, this index continued to rise and set a historical high of nearly 70%.
Currently, although Bitcoin has undergone a sharp correction from its peak above $100,000 to the $70,000 region, the inactive supply ratio remains around 60–61%. This is about 20 percentage points higher than the lows during the strong growth phase of 2017–2018 when the index fell to nearly 40%.
With the total circulating supply currently at around 19.9 million BTC, 60–61%, or more than 12 million BTC, is currently out of circulation. This means that less than 8 million BTC are actually participating in the daily price action on exchanges and OTC markets.
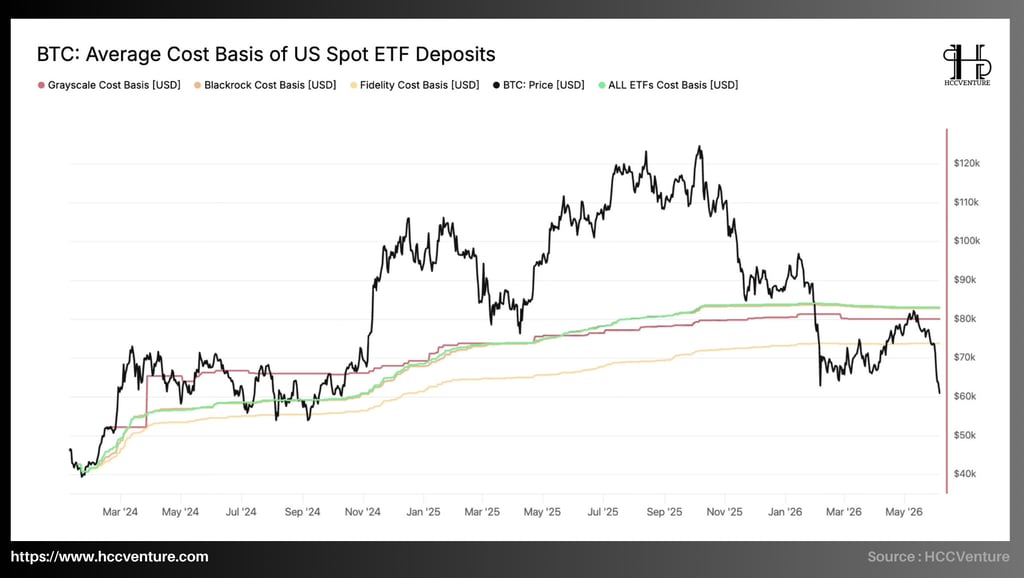
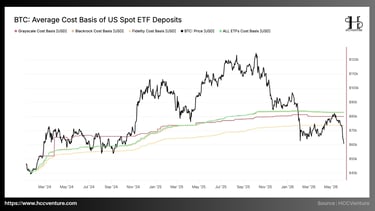
The Average Cost Basis of US Spot ETF Deposits shows that Bitcoin is currently trading below the overall cost basis of the US Spot ETF ecosystem. With a market price around $60,000-$62,000 compared to the average cost basis of the entire ETF at nearly $83,000 , a significant portion of institutional capital has shifted to unrealized losses for the first time since Spot ETFs were launched.
Observing developments since the beginning of 2024 shows that the average cost basis of all Spot ETFs has continuously increased from around $45,000 to nearly $83,000 . This reflects the continuous buying by institutional investors throughout the period when Bitcoin rose from $40,000 to over $120,000. However, after reaching its historical peak, the price of Bitcoin corrected sharply by more than 50%, pulling the market price down to nearly $60,000. Meanwhile, the cost basis of ETFs remained almost unchanged due to the large amount of assets held and the slow pace of portfolio restructuring.
As a result, Bitcoin is currently trading approximately $22,000 lower , equivalent to nearly 27% below the average cost basis of the entire Spot ETF system—clearly the largest negative spread since the official launch of spot Bitcoin ETFs. Although profit pressure has significantly decreased, the data does not show signs of a large-scale capital outflow. The stable cost basis lines reflect that the majority of institutions are still holding positions rather than realizing losses.
Assessment and Conclusion
Bitcoin is entering a deeper phase of a late-cycle correction, as selling pressure is no longer primarily driven by leveraged speculation but has spread to short-term investors. Following a sharp drop from its peak above $100,000 to the $60,000 region, the market has experienced one of the largest leveraged cleanups since the beginning of the current bull cycle.
However, unlike past periods of sustained bottoming, the rebalancing process after leverage has not yet been accompanied by a corresponding recovery in spot demand. US ETF Spot capital flow indicators show that the pace of institutional accumulation has slowed significantly compared to the strong expansion phase of 2024–2025. Bitcoin is currently trading below the average cost range of most ETF Spots, while net capital flows continue to remain weak.
NUPL has fallen to the approximately 0.15-0.20 range, significantly lower than the peak above 0.60 recorded during the euphoric phase of the cycle. Simultaneously, the Realized Profit/Loss Ratio has narrowed sharply from extreme levels above 10 times to near equilibrium, indicating that profit-taking momentum has almost disappeared and loss-making activity is now dominant.
Nevertheless, the current correction has brought many valuation indicators to significant discount zones compared to their peaks, suggesting that much of the excessive speculation has been eliminated and valuation risk has decreased significantly compared to the end of 2025. Leverage has been re-established at healthier levels, and many valuation indicators have returned to historically attractive zones, but sufficient demand momentum to absorb supply and initiate a new growth cycle has yet to emerge. Until spot cash flows and institutional demand recover significantly, the market structure remains skewed towards accumulation after capitulation rather than confirmation of a new sustainable uptrend.
Disclaimer: The information presented in this article is the author's personal opinion in the field of cryptocurrencies. This is not financial or investment advice at all. Every investment decision should be based on careful consideration of your personal portfolio and risk tolerance. The opinion in the article does not represent the official position of the platform. We recommend that readers do their own research and consult experts before making any investment decisions.
API & Data: Glassnode
Synthesized and analyzed by HCCVenture
Join the HCCVenture organization here: https://link3.to/holdcoincventure
Explore HCCVenture group
HCCVenture © 2023. All rights reserved.


Connect with us
Popular content
Contact to us
E-mail : sp_contact@hccventure.com
Register : https://linktr.ee/holdcoincventure
Disclaimer: The information on this website is for informational purposes only and should not be considered investment advice. We are not responsible for any risks or losses arising from investment decisions based on the content here.
TERMS AND CONDITIONS • CUSTOMER PROTECTION POLICY
ANALYTICAL AND NEWS CONTENT IS COMPILED AND PROVIDED BY EXPERTS IN THE FIELD OF DIGITAL FINANCE AND BLOCKCHAIN BELONGING TO HCCVENTURE ORGANIZATION, INCLUDING OWNERSHIP OF THE CONTENT.
RESPONSIBLE FOR MANAGING ALL CONTENT AND ANALYSIS: HCCVENTURE FOUNDER - TRUONG MINH HUY
Read warnings about scams and phishing emails — REPORT A PROBLEM WITH OUR SITE.