


On-chain analysis for week 21/2026: The distribution period occurs, high position warning
Bitcoin is entering the phase of accumulation and rebalancing capital flows when the short-term growth shows signs of slowing down, however, it warns that the risk of buying positions from investment funds is reaching the highest level of risk.
PHÂN TÍCH
6/3/202615 min read

On-chain analysis week 20/2026: The distribution period occurs, high position warning
Bitcoin is entering the phase of accumulation and rebalancing capital flows when the short-term growth shows signs of slowing down, however, it warns that the risk of buying positions from investment funds is reaching the highest level of risk.
Analysis • 03 June, 2026


Market summary
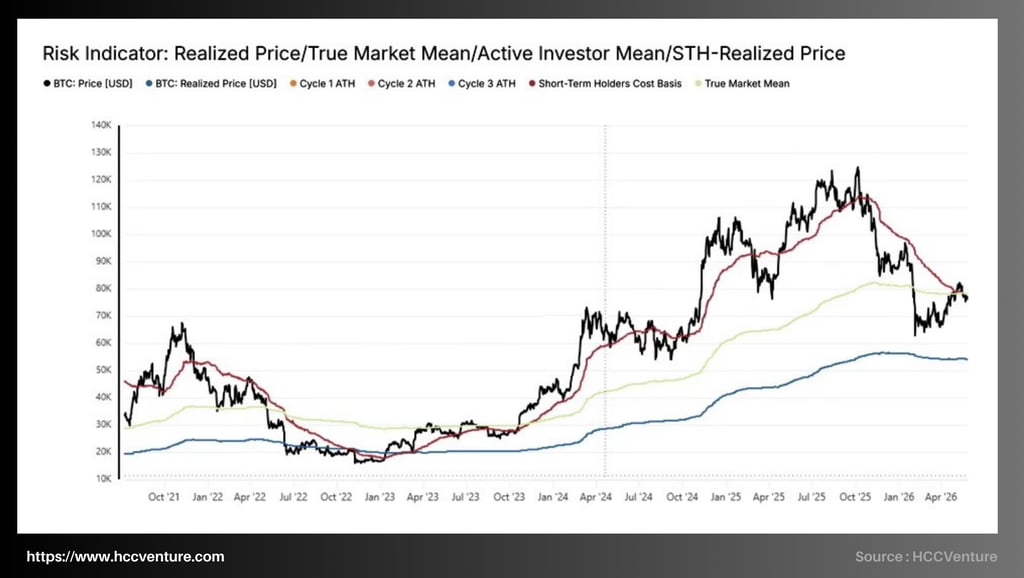
In the history of Bitcoin, when two factors Short-Term Holder Cost Basis and True Market Mean converge, it will represent the average capital cost of the group of short-term investors in the last 155 days as well as the average price of the entire supply operating on the network. Panic and fear are also easy to occur here, which is more worrying when investors are forced to make a decision to continue holding or stop the game here. Bitcoin is still constantly fluctuating right near this equilibrium instead of creating a safe distance like the early bull market in 2020 or the end of 2023.
The Realized Profit/Loss Ratio is currently around 1.56 and reflects a larger amount of profit realized capital than the amount of loss realized capital. Although this is one of the most significant improvements since the beginning of this year, when most of the network activities are carried out in a state of loss after a sharp correction from the historical peak. However, the fact that this ratio is still below the historical threshold of extended growth periods shows that the market is in a state of capital recovery and psychological improvement rather than entering a comprehensive cycle of excitement.
On the other hand, when referring to the standardized STH Net Realized Profit/Loss indicator according to Realized Cap, which is showing a strong recovery from -0.44% in February to only about -0.02% at the present time, it reflects most of the selling pressures originating from the short-term investors that have been significantly relieved. If in the early period of 2026 many investors were forced to cut losses to preserve capital, now that state has almost disappeared from the market.
Data related to Spot Volume Delta shows that spot selling pressure has decreased significantly compared to the first quarter of 2026. Buying and selling activities on the spot market are currently maintaining a relatively balanced state, reflecting the stability of investor sentiment after a period of strong volatility. Notably, Bitcoin has repeatedly recovered to the high price area although Spot Volume Delta still fluctuates around the neutral level.
Analyze on-chain indicators
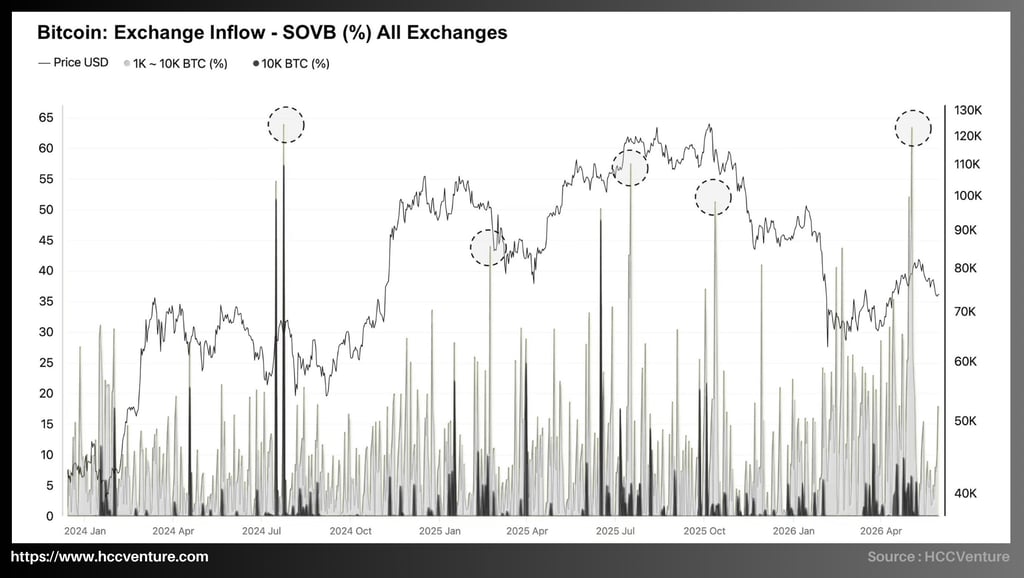
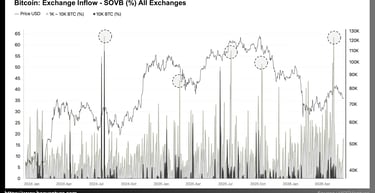
The beginning of the analysis from HCCVenture shows that Exchange Inflow - SOVB (Supply by Volume Band) is having a proportion of BTC flow loaded on the exchange from the group of wallets owning 1,000 - 10,000 BTC and especially the group over 10,000 BTC has increased sharply again, reaching the highest levels since the distribution around the peak at the end of 2025.
When looking at history, we see that the periods of sudden cash flow from the big whale group often coincide with the time when the market entered the supply redistribution phase after strong recovery rhythms. Therefore, the fact that the proportion of BTC flows of large wallets is now increasing while the price of Bitcoin is still fluctuating around the area of 75,000 - 80,000 USD shows that potential supply pressure is being reactivated after a long accumulation period in the first quarter of 2026.
According to the collected data, the proportion of BTC flows loaded to exchanges from the group of wallets owning 1,000 - 10,000 BTC has skyrocketed to over 60% of the total amount of Bitcoin transferred to the exchange in some recent sessions, which is considered the highest level since the large distribution took place in the period when Bitcoin reached a historical peak around the area of 120,000 USD at the end of 2025.
Notably, the group of wallets owning more than 10,000 BTC also has large transaction clusters with a sudden cash flow ratio, similar to the periods of July 2024, March 2025 and October 2025. In all 3 historical periods above, the sharp increase in whale capital flow to the floor all appeared near the medium-term peaks of the market before prolonged corrections or accumulations occurred.
If we compare with the early period of 2026, when the proportion of cash flow from large whales usually fluctuates below 20–25%, the current increase reflects a significant change in the behavior of large-scale investors. A large part of the supply is being brought back to centralized trading locations instead of continuing to accumulate outside the market.

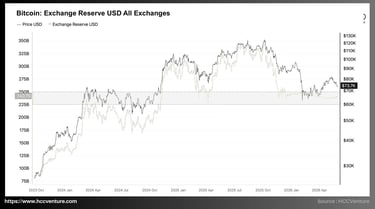
Bitcoin Exchange Reserve USD All Exchanges is showing that the total value of Bitcoin held on exchanges now reaches about 240.7 billion USD, a sharp drop from the peak of nearly 330 - 340 billion USD recorded in the third quarter of 2025. Although Bitcoin has recovered from the bottom at the beginning of this year, the amount of Bitcoin stored on exchanges continues to remain at the lowest level in more than a year.
Since Bitcoin set a historical peak above 120,000 USD at the end of 2025, this indicator began to decline continuously. Currently, Exchange Reserve USD is nearly 100 billion USD lower than the peak of the previous cycle and is considered a significant decline in the context of Bitcoin's market capitalization still maintaining over 1.4 trillion USD.
The important thing is that this decrease not only comes from price fluctuations but also reflects the trend of withdrawing Bitcoin from exchanges. In previous cycles, especially in the period 2020–2021, the prolonged decline of Exchange Reserve often appeared simultaneously with the accumulation process of long-term investors and institutions. The current model is repeating on a larger scale.
If we consider the market structure, this is considered a particularly positive signal. When a market has a continuously declining trading supply and the price remains above critical capital cost thresholds, it often reflects investors' long-term confidence in the growth trend of the asset.
In real distribution cycles, the price recovery is often accompanied by the flow of Bitcoin returning to the exchange to realize profits. However, the current data does not show that phenomenon, which means that the supply pressure that is appearing in the market mainly comes from short-term trading activities and position rotation among investors, rather than coming from long-term strategic supply.
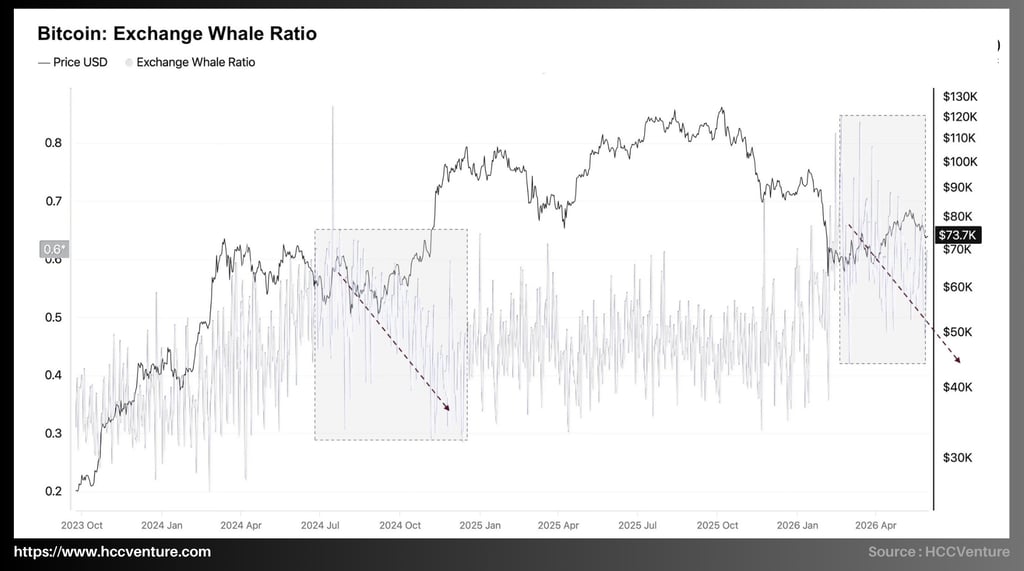
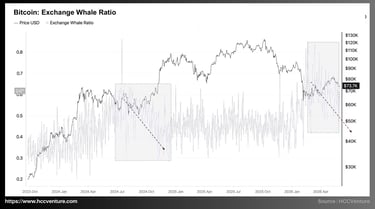
Although the current trend is positive, it should be noted that the Exchange Whale Ratio around 0.60 is still significantly higher than the historical bottom below 0.30, large entities still play an important role in trading cash flow and continue to strongly affect short-term market fluctuations. A continuous downward trend of the index in recent months shows that distribution pressure from large entities is gradually weakening.
Observing data from the end of 2023 until now shows that Exchange Whale Ratio has experienced two remarkable periods of sharp increase:
The first phase appeared in mid-2024 when the index increased to the area of 0.60–0.65, then gradually decreased to the area of 0.30–0.35 in the last months of the year.
The second phase took place from the beginning of 2026 when the index soared above 0.80, marking one of the highest levels since Bitcoin entered the current growth cycle.
The point of attention when the Exchange Whale Ratio above 0.70 usually reflects the majority of the exchange deposit flow comes from a very small number of addresses that own large amounts of Bitcoin, and the activity of transferring assets to the exchange is dominated by a large-scale group of investors instead of small capital flows. The fact that the index reached the 0.80 - 0.85 area in the first quarter of 2026 shows that the supply pressure at that time mainly came from organizational entities and whales, coinciding with the period when Bitcoin adjusted from the historical peak above 120,000 USD to below 70,000 USD.
The decline of Exchange Whale Ratio in the context of Bitcoin price maintaining around the area of 70,000–80,000 USD is of particular importance. If large entities continue to boost distribution, this index will usually remain in the high area or continue to increase as the price recovers, but current data shows that although Bitcoin has recovered more than 20% from the bottom of the first quarter of 2026, the trading weight of the whale group in the total deposit flow is decreasing.
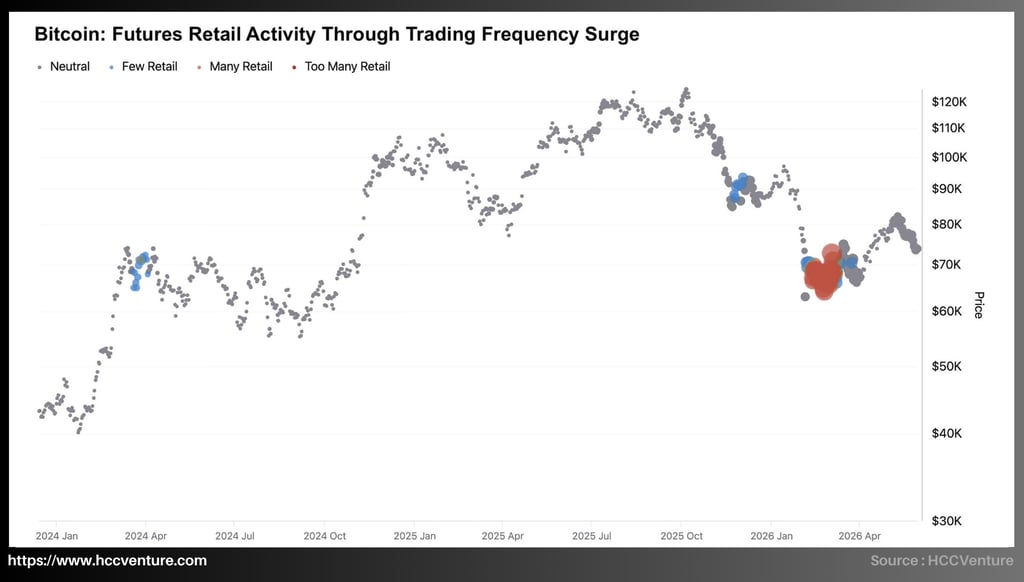
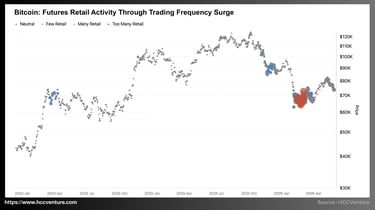
Futures Retail Activity Through Trading Frequency Surge is built to measure the participation of retail investors in the Bitcoin futures market through transaction frequency, helping to determine periods of strong increase in individual speculative capital flow, especially when the market forms a medium-term bottom or enters the re-accumulation phase.
According to the data we collected, this indicator is showing that the trading activity of retail investors has increased sharply since the deep correction in early 2026. The "Many Retail" and "Too Many Retail" signal clusters appear densely in the price area of 65,000 - 72,000 USD, marking the highest level of participation of individual investors since the bottoming period in the first quarter of 2024. The highlight when this increase appeared after Bitcoin adjusted nearly 50% from a historical peak of about 123,000 USD to a bottom of nearly 65,000 USD, reflecting the return of small speculative capital flows in the market revaluation period.
If we look at 2025, we will find that the Bitcoin market is almost led by the flow of institutional capital and large-scale investors during that time, the number of signals related to small trading activities is almost very limited. However, after a strong adjustment in early 2026, this structure began to change significantly. From the price area of 65,000 USD, the number of "Many Retail" and especially "Too Many Retail" signals appear with the densest density since the beginning of 2024.
The fact that small trading activity accelerates in a price area that is about 40–50% lower than the peak of the cycle shows that most of the personal capital flow is currently being deployed in the recovery phase instead of the distribution phase, which contributes to improving the overall liquidity structure of the market and supporting the ability to absorb short-term supply.
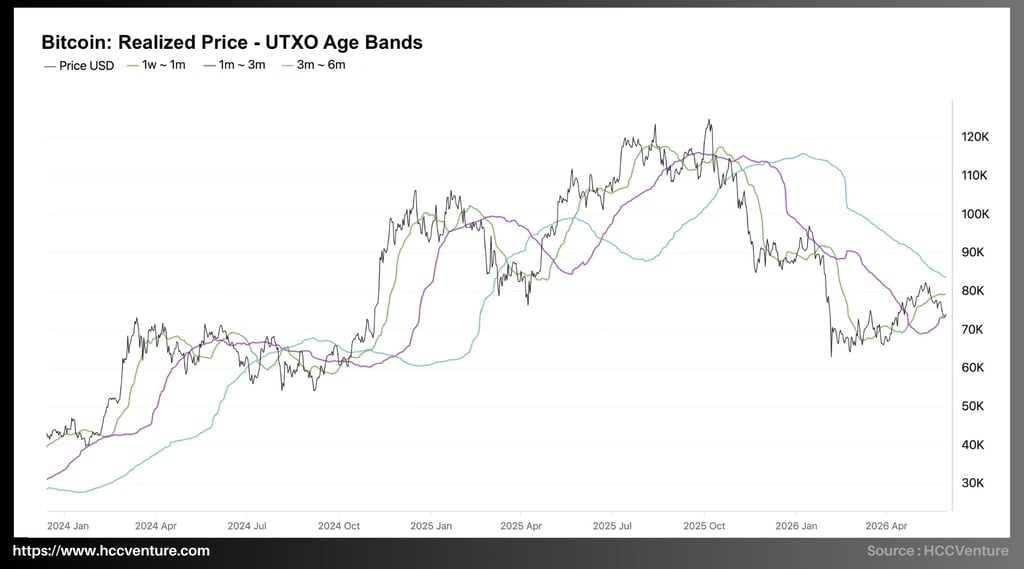
Realized Price by UTXO Age Bands is one of the most important tools in on-chain analysis to evaluate the capital cost behavior of groups of investors over time holding. Current data shows that Bitcoin is trading around the area of 76,000–78,000 USD, while the actual cost of short-term holding groups continues to converge and move higher.
The UTXO group from 1 week to 1 month is having a Realized Price of about 79,000 USD.
Group 1 - 3 months at about 74,000 USD and group 3 - 6 months maintained around 84,000 USD.
Observing developments from the end of 2025 to now shows that all Realized Price lines according to the UTXO age group have experienced a synchronous adjustment cycle after Bitcoin fell from the historical peak of about 123,000 USD to the bottom of nearly 65,000 USD. This structure reflects the near-completion of the supply redistribution process after the deep adjustment in early 2026, and confirms that most of the new capital flow is forming at a significantly higher price level than in previous cycles.
Currently, the capital price of the 1-week–1-month group has dropped from a peak of 117,000 USD to about 79,000 USD, equivalent to a correction of more than 32% and is a sign that the short-term capital cost floor has been significantly rebalanced and the pressure from buying positions in the high price area is gradually being removed from the system.
In periods of strong market growth, the gap between the Realized Price lines often widens significantly due to the continuous flow of new money buying at increasing prices. On the contrary, in the re-accumulation periods, the cost lines will gradually converge as the market seeks a new equilibrium. This convergence shows that the process of redistributing supply has taken place relatively completely. New investors are receiving supply from buyers in the higher price area, helping the market-wide capital cost floor become more stable and significantly reducing the risk of systemic sell-off.
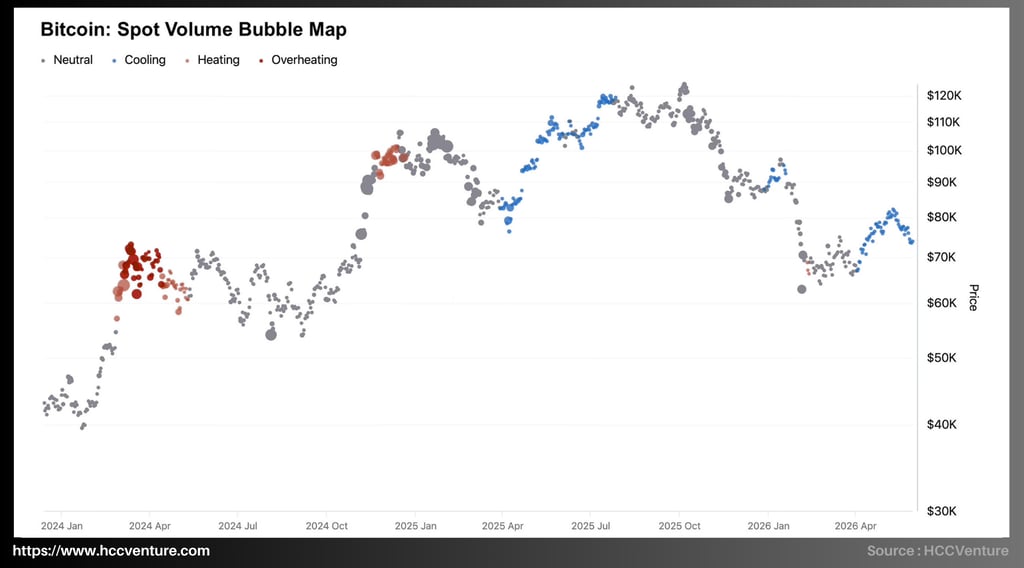
Spot Volume Bubble Map from HCCVenture will reflect the state of spot cash flow, from cooling, neutral, heating to overheating and at the same time the bubble size shows the relative volume of the transaction volume at each time.
Current data shows that Bitcoin is trading around the 74,000–76,000 USD area after a strong recovery from the bottom of nearly $65,000 set in the first quarter of 2026. In the recent recovery period, it is mainly marked by "Cooling" and "Neutral" signals, instead of "Heating" or "Overheating". On the other hand, this is showing a marked improvement in spot demand but there is no excessive speculation and structurally this is also considered a feature that often appears in periods of accumulation and sustainable recovery rather than in periods of end-cycle excitement.
Observing the entire period from the beginning of 2024 to now shows that the largest clusters of bubbles and the "Overheating" state appear concentrated in two important periods.
The first phase takes place in the first quarter of 2024 when Bitcoin surpasses the 60,000 USD mark and enters the 70,000 USD area for the first time.
The second phase will appear at the end of 2024 when the price exceeds the threshold of 95,000 USD and forms a strong increase towards the six-digit area.
In both cases, the sharp increase in spot volume is accompanied by the market's overheating, which is the time when speculative cash flows participate strongly, creating a rapid expansion of liquidity and pushing prices to new valuation zones.
In contrast, after a deep correction from a historical peak of about 123,000 USD to a bottom of nearly 65,000 USD in early 2026, the current liquidity structure has completely different characteristics. Spot cash flow is returning but there are no clusters of big red bubbles like the previous periods of excitement. This shows that the current recovery process is supported by controlled accumulation instead of short-term speculative cash flow.
Research and Analysis
Market Summary
Analyzing on-chain metrics
Exchange Inflow - SOVB (Supply by Volume Band)
Bitcoin Exchange Reserve USD All Exchanges
Exchange Whale Ratio
Futures Retail Activity Through Trading Frequency Surge
Realized Price by UTXO Age Bands
Spot Volume Bubble Map
ATM Implied Volatility (IV)
Realized Profit/Loss Ratio (RPLR)
True Market Means
Assessment and Conclusion
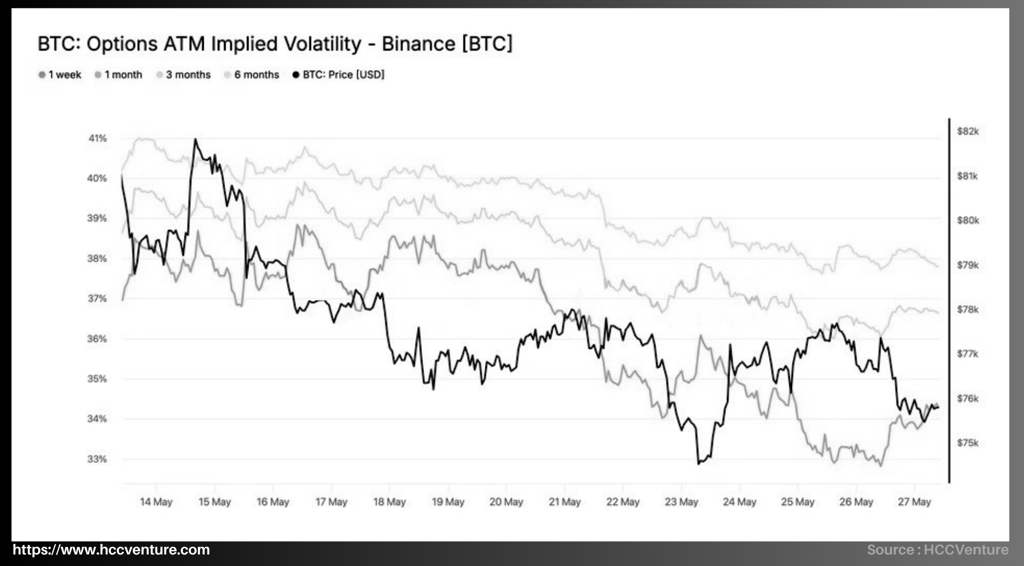
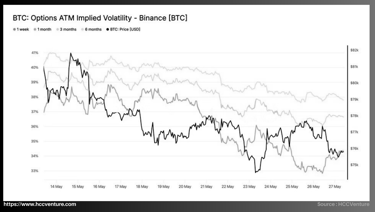
ATM Implied Volatility (IV) reflects the volatility expectations of the option market for Bitcoin in the future. Unlike Realized Volatility, Implied Volatility represents the level of risk that investors are willing to pay for hedging or speculation.
Current data of HCCVenture shows that the entire implied volatility curve on Binance is continuing to decline. IV with a 1-week term currently fluctuates around 34.3%, IV with a 1-month term of about 36.7%, IV with a 3-month term of about 37.8% and IV with a 6-month term maintains nearly 39%. Compared to the short-term peak in mid-May, the entire IV structure has decreased by 2 - 4 percentage points, reflecting a significant narrowing of fluctuating expectations across the entire term curve.
Specifically, IV 1 week is currently around 34%, about 5 percentage points lower than IV 6 months nearly 39%. This reflects that the market does not value strong fluctuations in the short term, and shows that institutional investors still maintain a certain level of hedge for macro events in the coming quarters.
During periods of real market tension, this structure is often reversed when short-term IV skyrockets beyond long-term IV. That phenomenon has appeared in the big sell-offs in 2022 and the previous strong corrections. However, current data does not show this feature at all.
The simultaneous decline of both short-term and long-term volatility shows that the options market is moving to a more stable state, with a significantly lower level of uncertainty than the previous period of strong correction, and is seen as a characteristic signal of a market entering the process of rebalancing liquidity instead of facing sell-off pressure or extreme volatility.
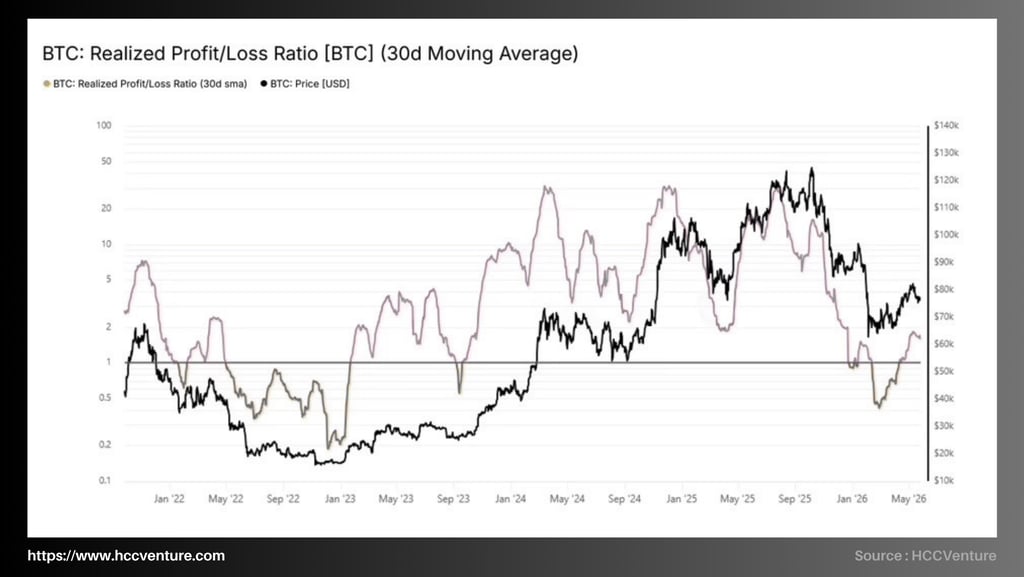
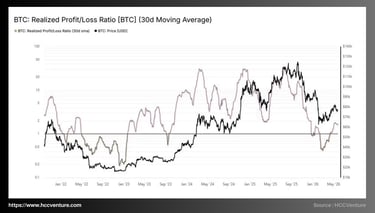
Realized Profit/Loss Ratio (RPLR) reflects the ratio between total realized profit and total realized loss of all investors. We observe this index to fluctuate around 1.6–1.8, a sharp increase from the bottom of about 0.45 recorded in the correction in early 2026, reflecting the significant recovery of profit-realization activities on the network and confirming that capital flows have returned to a positive state after a period of sharp decline. However, the current level is still significantly lower than the previous cycle peaks, when the index used to exceed 20 - 30 times during the extreme excitement periods of the market.
Observing the chart shows that the adjustment period from the end of 2025 to the beginning of 2026 has caused the Realized Profit/Loss Ratio to drop sharply from the area above 10 to below 0.5, which is the lowest level since the beginning of the current growth cycle and reflects the local capitulation state when a part of investors are forced to realize losses during the price adjustment process.
However, since Bitcoin formed a bottom around 60,000 - 65,000 USD, the index has recovered continuously for many months. If we consider the increase from 0.45 to nearly 1.8, which is equivalent to a recovery of more than 300%, it shows that the cash flow of losses has been quickly replaced by controlled profit-taking activities. Historically, the transition periods from RPLR below 1 to maintaining stability above 1 often mark the process of re-establishing a medium-term uptrend.
If the market is entering a large-scale breakout period, this index often spikes to extreme areas while the price begins to weaken. However, current data shows that RPLR increases over time with a relatively stable slope, reflecting the natural improvement of capital flows on the network. Besides, the total Realized Cap of Bitcoin has now exceeded 950 billion USD and continues to maintain near historical highs and confirms that the actual amount of capital held on the blockchain is still at a very large level, creating a supporting foundation for the current supply absorption process.
Considering the entire on-chain pricing system, Bitcoin is currently operating in a significantly healthier capitalization structure than in the late 2025 period. The last adjustment has helped eliminate most of the short-term speculative capital, while bringing the capital price of investor groups back to a more balanced state.
The Realized Price line currently fluctuates around the area of 54,000–55,000 USD, a sharp increase from about 20,000 USD at the bottom of the 2022 cycle, which means that the total actual capitalization of the whole network has increased by more than 170% in less than three years.
Unlike regular market capitalization, Realized Price reflects the average price at which the entire supply of Bitcoin was last traded on the blockchain, so the continuous increase of this index shows that the actual cash flow is still being absorbed into the network instead of withdrawing from the market.
In particular, although Bitcoin has experienced a correction of more than 45% from its historical peak, Realized Price shows almost no signs of decline. This is a characteristic that usually only appears during mature growth cycles, when most of the supply has been transferred to investors with longer-term holding capacity.
In the history of Bitcoin, True Market Mean often represents the boundary between the growth market and the prolonged correction market. When the price remains above this threshold, most of the operating capital flow on the network remains profitable. Observation of the period 2022 shows that when Bitcoin trades below True Market Mean for a long time, the market enters a deep recession and forms the bottom of the cycle. On the contrary, from the end of 2023 until now, prices have continuously moved above this line for most of the time. Although the correction in early 2026 brought Bitcoin to this support area, the market quickly recovered and re-established equilibrium. That shows that the True Market Mean area continues to be protected by long-term accumulated capital flows.
Evaluation and conclusion from us
Bitcoin continues to maintain a stable state above the USD price area of 75,000, however, on-chain data and market capital flows show that the current recovery process is taking place in the context of liquidity and relatively limited speculative demand. Although the price has recovered significantly from the bottom set in the previous correction period, the indicators reflecting the strength of the actual cash flow have not yet recorded a proportional expansion.
Net capital flow into US Bitcoin Spot ETFs has slowed down after a strong recovery period at the beginning of the year, reflecting the cautious mentality of the group of institutional investors in the context of global liquidity that has not really expanded. In parallel, Exchange Reserve data, Exchange Whale Ratio and trading capital flow indicators show that active selling pressure has decreased significantly, but new buying demand is not strong enough to create a positive supply and demand imbalance like the previous boom periods.
Another notable factor is the convergence of many important capital price thresholds on the Bitcoin network. True Market Mean, Active Investor Price and Short-Term Holder Cost Basis are all concentrated around the area of 75,000 - 80,000 USD. Historically, such capital price convergence zones often act as the supply and demand balance area of the whole market, the continued maintenance above this area shows that the majority of investors are still holding assets in a profitable state, while confirming that the actual capitalization structure of the network still maintains a positive trend despite the decline of short-term momentum indicators.
Bitcoin still maintains an active on-chain platform with Realized Cap continuing to expand, realized profits remaining above the equilibrium threshold and most of the circulating supply is still in a profitable state. However, to confirm a new period of value expansion, the market needs to witness a marked improvement in spot capital flows, the rate of new participants and the recovery of institutional investment demand.
Disclaimer: The information presented in this article is the author's personal opinion in the field of cryptocurrencies. This is not financial or investment advice at all. Every investment decision should be based on careful consideration of your personal portfolio and risk tolerance. The opinion in the article does not represent the official position of the platform. We recommend that readers do their own research and consult experts before making any investment decisions.
API & Data: Glassnode
Synthesized and analyzed by HCCVenture
Join the HCCVenture organization here: https://link3.to/holdcoincventure
Explore HCCVenture group
HCCVenture © 2023. All rights reserved.


Connect with us
Popular content
Contact to us
E-mail : sp_contact@hccventure.com
Register : https://linktr.ee/holdcoincventure
Disclaimer: The information on this website is for informational purposes only and should not be considered investment advice. We are not responsible for any risks or losses arising from investment decisions based on the content here.
TERMS AND CONDITIONS • CUSTOMER PROTECTION POLICY
ANALYTICAL AND NEWS CONTENT IS COMPILED AND PROVIDED BY EXPERTS IN THE FIELD OF DIGITAL FINANCE AND BLOCKCHAIN BELONGING TO HCCVENTURE ORGANIZATION, INCLUDING OWNERSHIP OF THE CONTENT.
RESPONSIBLE FOR MANAGING ALL CONTENT AND ANALYSIS: HCCVENTURE FOUNDER - TRUONG MINH HUY
Read warnings about scams and phishing emails — REPORT A PROBLEM WITH OUR SITE.