

On-chain analysis for week 20/2026: Bitcoin declines, long-term returns stagnate
Bitcoin is undergoing a delicate transitional phase between recovery and stagnation – a technically crucial level marking equilibrium between buyers and sellers.
PHÂN TÍCH
5/23/202611 min read
On-chain analysis week 20/2026: Bitcoin declines, long-term returns stagnate
Bitcoin is undergoing a delicate transitional phase between recovery and stagnation – a technically crucial level marking equilibrium between buyers and sellers.
Analysis • 22 May, 2026


Market Summary
During Bitcoin's volatile cycles, there is usually a correction phase to regain the True Market Mean, lasting from a few weeks to a few months, during which Bitcoin can consolidate its cyclical position and thus confirm the structural shift to a more sustainable bull market. Current observations suggest that Bitcoin is attempting to retest this correction phase.
One concerning factor in a recent bull cycle fueled by expectations of a price recovery is the surge in the Realized Profit/Loss Ratio (SMA), which jumped from 0.4 to 1.8 during the most recent recovery, but remains very low compared to the historically high level of 2.0. However, it is signaling a genuine recovery as buyers gradually regain confidence.
Whenever Bitcoin recovers, long-term investors who have already made profits tend to take profits, but currently the market lacks sufficient demand to absorb the full selling pressure. This shift has resulted in a Realized Cap Net Position Change of only $2.8 billion per month, approximately 28% of what is needed for a growth cycle. The current market clearly reflects a lack of confidence from capital flows.
With its 30-day average price of $78,200, once considered the strongest support level during historical rallies, it has now become the strongest resistance zone after Bitcoin's deep correction from its ATH. The key point here is that those who bought Bitcoin in the past 30 days were positioning themselves to wait for a breakout and are now facing the risk of breaking even or only achieving very small profits, creating selling pressure when the price approaches this level again.
From another perspective, the Cumulative Volume Delta (CVD) index has remained negative in recent weeks, partly due to continued selling pressure on CEX exchanges. Activity on Coinbase shows that US institutional participation continues to lag behind despite periodic spikes in speculative demand from abroad.
Open interest in CME futures contracts continues to recover along with price, signaling increasing institutional participation in the derivatives market. Institutions are still positioning for Bitcoin, but they prefer to do so through derivatives (futures contracts, options) rather than buying directly on the spot market.
Analyzing on-chain metrics
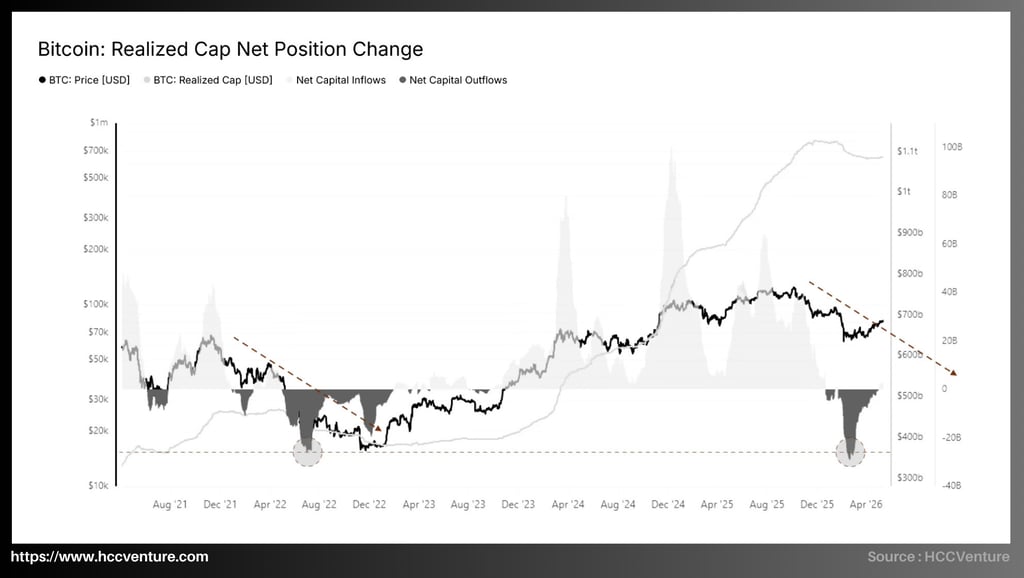
Realized Cap Net Position Change is showing a structural shift in Bitcoin's on-chain capital flows during the current period, from recovery growth to downward pressure from large investment flows. Current data is in the deep negative capital flow zone from early 2026, a significant similarity to the mid-2022 period, when the market witnessed large-scale capital outflows and a liquidity collapse across the entire financial system.
However, the major difference lies in the depth and duration of the negative capital outflows. In the 2022 cycle, net capital outflows lasted for months, pushing Bitcoin below $20,000 with a sharp contraction in Realized Cap. In contrast, this period only saw a relatively short period of capital withdrawal, and there are still no signs of a new capital inflow recovery. This is certainly the biggest concern for the market, and the fact that the structure is only just approaching the previous downturn zone is a major question mark for this market.
Recent data shows that the network-wide Realized Cap remains around $1.05–$1.1 trillion, only slightly declining after the sharp correction at the beginning of 2026. This particular signal is significant only during true bear market phases; Realized Cap typically plummets sharply as investors collectively realize losses and capital flows out of the ecosystem.
On the other hand, Net Position Change is showing that capital outflow pressure is rapidly weakening, with current negative zones narrowing but not significantly compared to historical levels, while Bitcoin's price is beginning to recover to the $75,000 to $80,000 range. Structurally, this signals that the panic-driven sell-off supply has been largely absorbed.
We are seeing a capital re-expansion phase for a more sustainable growth trend in the future, because in previous cycles, whenever the Position Change shifted from a deep outflow to stabilization while Realized Cap remained above the long-term uptrend, Bitcoin would enter a phase of forming a new price base and expanding into the next sustainable growth phase.
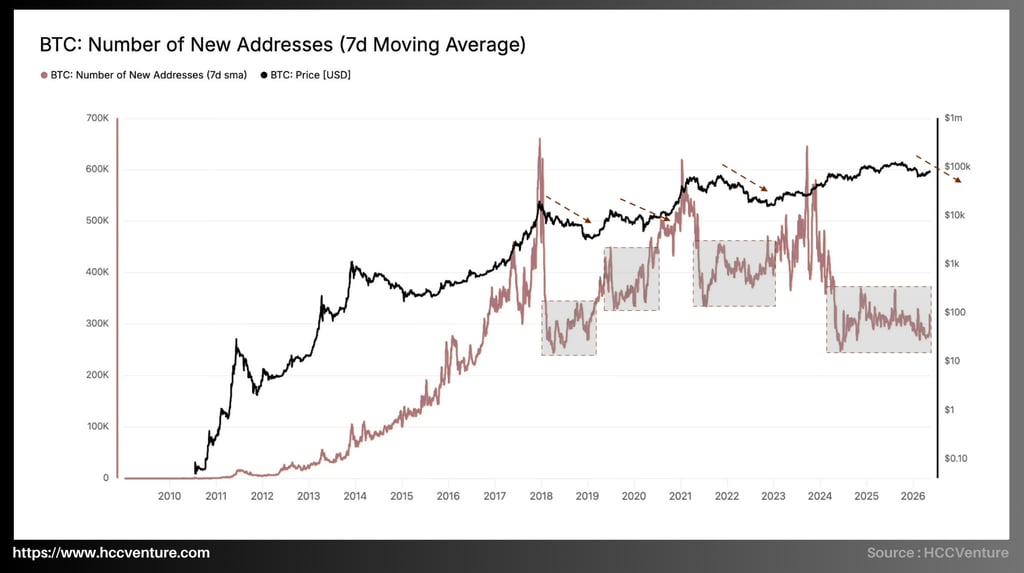
The Number of New Addresses (7d Moving Average) data shows a fluctuating number of new addresses around 280-320,000 per day, which is quite low compared to previous expansion peaks of the growth cycle. Notably, this decline is occurring while Bitcoin remains below $80,000, suggesting a false surge accompanied by relatively moderate expansion corresponding to the level of new investor participation.
Historically, the growth of new addresses has always been a crucial indicator for Bitcoin's boom periods. For example, in the 2026-2027 cycle, the number of new addresses continuously increased from under 100,000 to 500,000 addresses per day before the market entered a parabolic phase at the end of each cycle. Similarly, in the 2020-2021 period, the stable growth of new addresses in the 450,000-550,000-550,000 range caused Bitcoin's price to surge from $10,000 to $60,000. In contrast, current data shows that even though the price has returned near its historical peak, the number of new addresses remains approximately 35-45% lower than in previous periods of strong growth.
The current market is heavily reliant on institutional capital flows, spot ETFs, and the reallocation of funds by existing holders, rather than large-scale retail adoptions. A notable point is that the market has yet to exhibit the "retail frenzy" typically seen at the end of previous cycles.
Furthermore, we observe a significant trend of declining numbers of new addresses after each major growth cycle. As market capitalization increases, the exponential growth rate of new users becomes more difficult to sustain. Simultaneously, the development of custodial asset solutions, Bitcoin Spot ETFs, and institutional liquidity systems has reduced the need for individual investors to create direct on-chain wallets.
Furthermore, the divergence between price and new address growth suggests that the current rally is more of a "capital-driven rally" than a "network expansion rally." In other words, Bitcoin's price is being supported by large capital inflows with high liquidity rather than a widespread surge in new users.
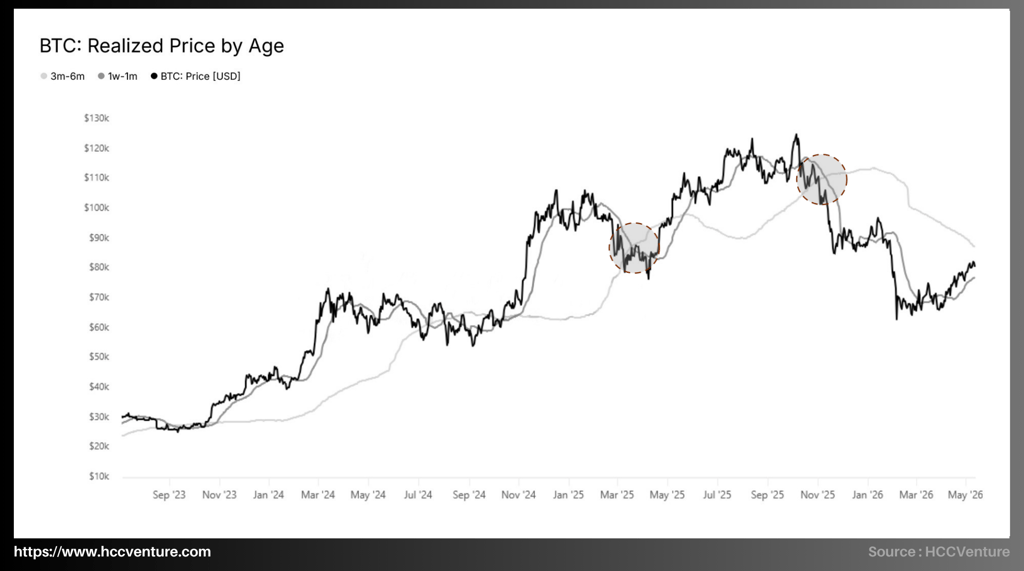
The current Realized Price by Age suggests that Bitcoin is gradually re-establishing its growth structure after a sharp correction in early 2026. At this point, the spot market price has broken back above the Realized Price range of short-term holders and begun a cycle of rebuilding a new support base around the $75,000 to $80,000 price range.
The intrinsic value of the 1-week to 1-month holding group is currently recovering strongly and approaching Bitcoin's spot price, clearly reflecting that a large portion of the new capital inflows in recent weeks has returned to a profitable state after the initial selling phase. However, historically, when the market price regains its position above the intrinsic value of the short-term holding group, the market enters a "positive rebalancing" phase, where "forced selling pressure" gradually decreases and short-term confidence is restored.
In previous cycles, whenever Bitcoin entered a recovery phase after a correction, the Realized Price of short-term holders often served as a crucial signal zone for determining the medium-term Bitcoin trend structure. If the price remains stable above this 1-week to 1-month range and continues to approach the realized value of the 3-month to 6-month range, the market will form a "profit re-expansion" phase, a period of widespread profit expansion. This mechanism has previously fueled strong rallies in the early phases of bull markets in 2019, 2020, and late 2023.
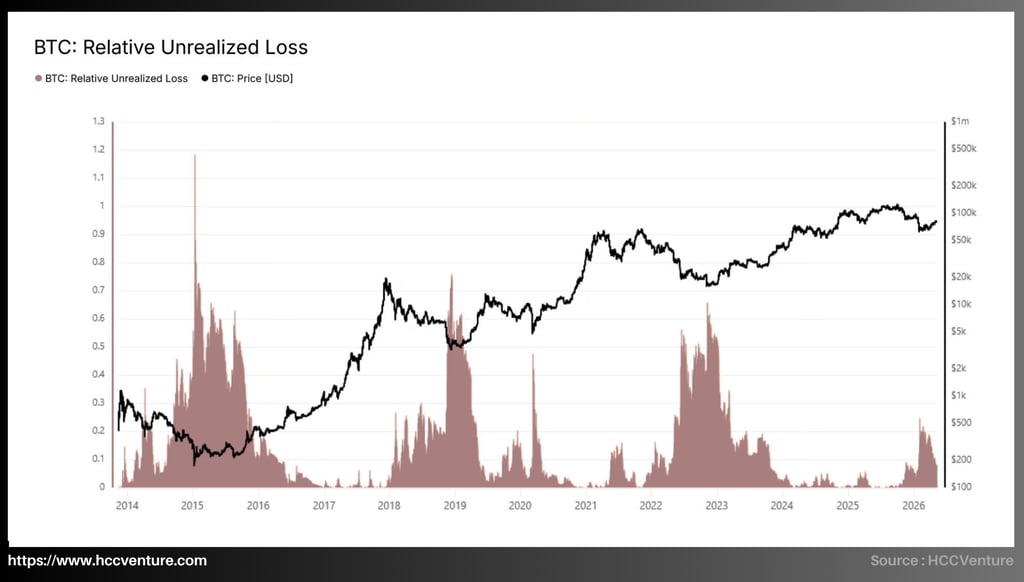
Bitcoin's Relative Unrealized Loss is fluctuating around the 0.18 to 0.22 range, a much sharper decline from its previous peak of 0.60 recorded during the early 2026 correction. Much of the unrealized loss pressure has been absorbed as the price recovered to the near-$80,000 area.
Compared to historical cycles, the current level of losses is still relatively low compared to previous bear market phases. During the 2014-2015 crash, this indicator exceeded 1.1 when much of the market experienced widespread losses after Bitcoin fell more than 80% from its peak. Similarly, the capitulation periods of 2018 and 2022 both saw Relative Unrealized Loss remain consistently in the 0.5–0.7 range before the market truly bottomed out.
On the other hand, when the upward momentum of the input indicator in early 2026 only reached about 0.6 in a relatively short period before quickly declining again, it suggests that the recent correction was more of a test of leverage structure and market positioning than a systemic collapse of the long-term growth cycle.
The rapid narrowing of the loss zone, which did not immediately materialize as Bitcoin recovered above key cost basis areas for short-term holders, confirms that a large portion of the supply is returning to break-even or slightly profitable levels, thereby significantly reducing the forced selling pressure from pessimistic investors.
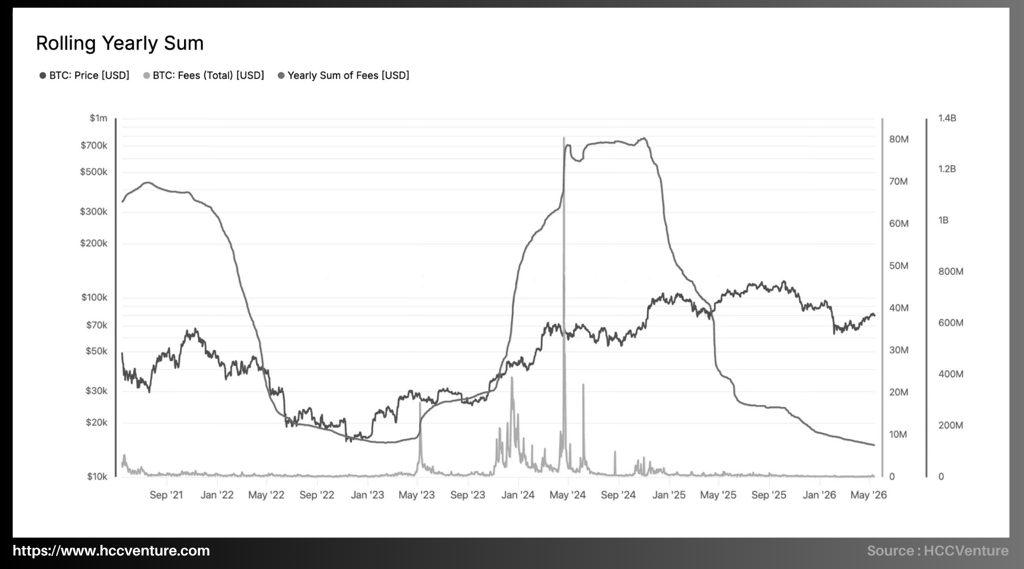
The current Rolling Yearly Sum reflects that the total cumulative transaction costs of Bitcoin over the year have sharply declined to below $200 million, significantly lower than the peak of nearly $1.3-$1.4 billion that was set during each of the Ordinals and BRC-20 activity booms in Q2/2024.
While Bitcoin is returning to the $75,000-$80,000 price range, network fee revenue has yet to show a commensurate recovery, directly reflecting that the current upward trend is primarily driven by financial capital flows and more macro-level investment demand, rather than the surge in on-chain usage seen in previous boom periods.
Daily transaction fees are currently hovering around their lowest levels since late 2023, while the large fee spikes that occurred during the Ordinals period have almost completely disappeared, indicating that much of the "meme-driven" speculation and temporary congestion on the network have significantly subsided.
With the network-wide hashrate continuing to hover around historical highs and mining difficulty remaining high, the system's security foundation shows no signs of weakening. The market factors we are observing suggest this is a repositioning of Bitcoin's role, moving it towards a globally liquid asset class.
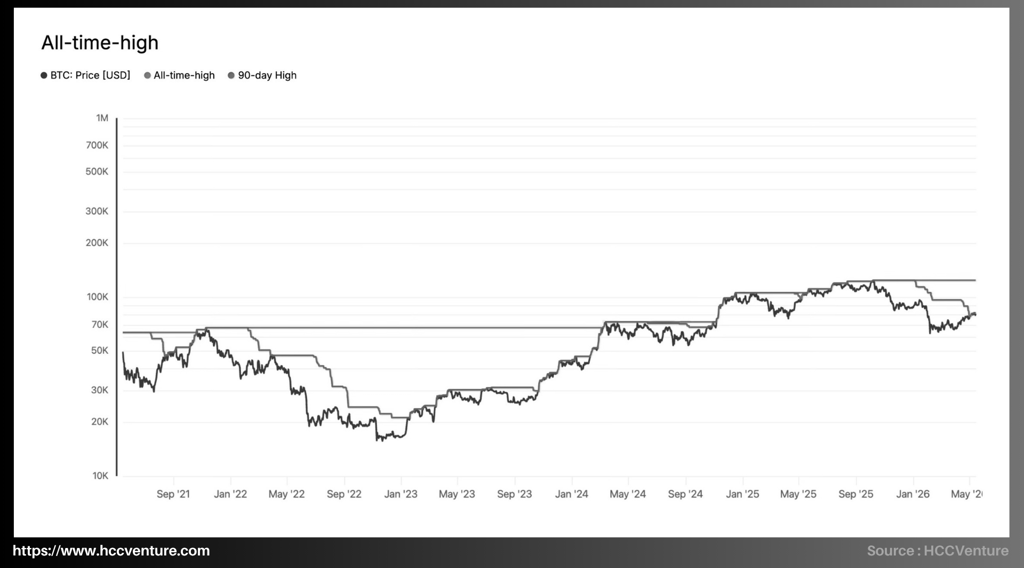
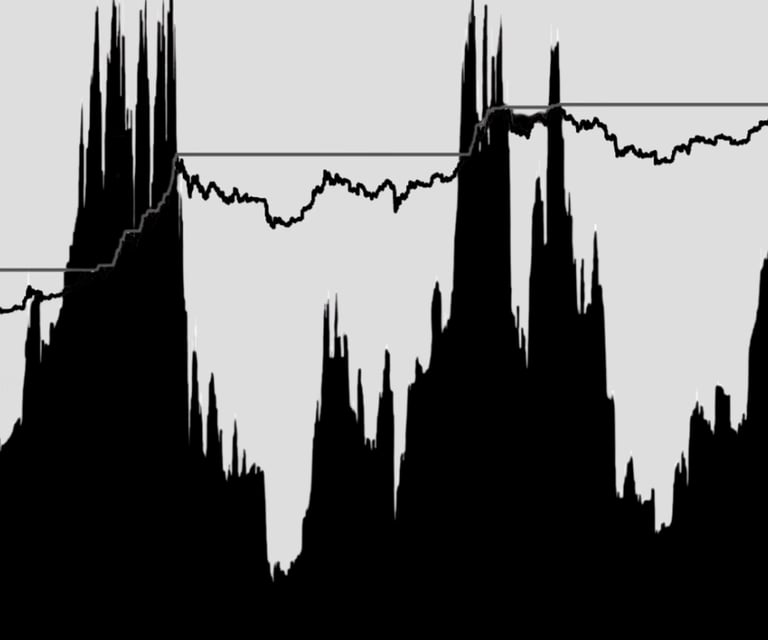
All-time-highs reflect the relationship between the current Bitcoin price and the most recent absolute historical highs (ATHs) and 90-day highs, allowing for an assessment of trend extension, supply absorption levels above, and market behavior structure as the price approaches new breakout zones.
The 90-day high is sloping downwards after months of decline, reflecting that the short-term momentum of the market has not yet returned to the full expansion phase seen during the late 2024 breakout. The most notable point on the chart is that the current market structure is completely different from the historical breakout phases in previous cycles. During Bitcoin's strong growth phases in 2017 and 2020–2021, the price often surpassed its all-time high with a very steep upward slope and consistently created new peaks in a short period.
Conversely, the current cycle shows that although the price has repeatedly approached the ATH (all-time high), it has consistently experienced sharp corrections shortly afterward. This reflects that the distribution pressure at high price levels is significantly greater than in Bitcoin's early growth cycles.
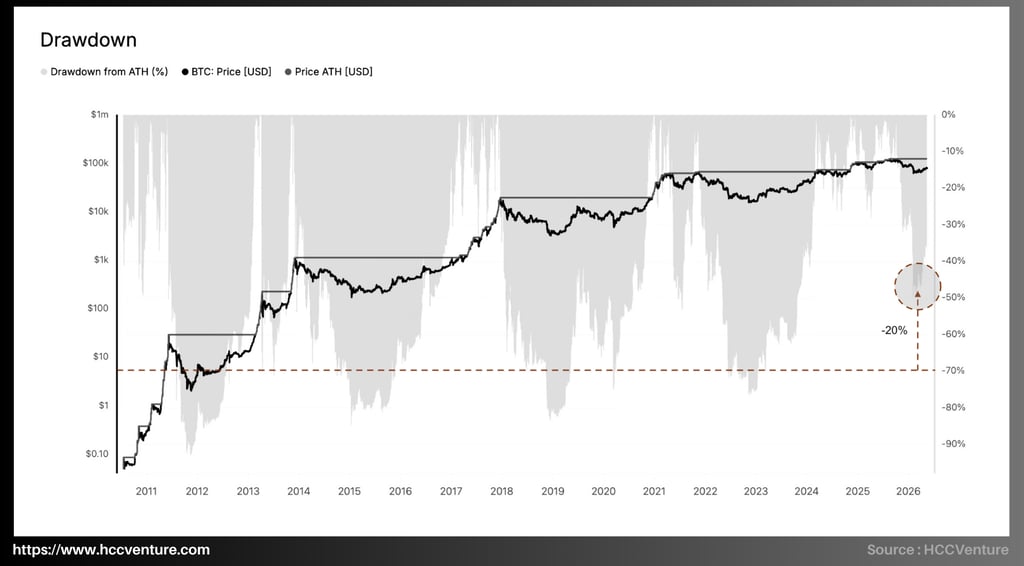
Unlike previous bear markets where prices typically plummeted 70–80% after failing to break above their all-time highs, Bitcoin is currently only correcting by about 35–40% before quickly stabilizing and recovering. This indicates that the depth of selling pressure has significantly decreased thanks to the increasing participation of institutional capital with a longer-term perspective.
Research and Analysis
Market Summary
Analyzing on-chain metrics
Realized Cap Net Position Change
Number of New Addresses (7d Moving Average)
Realized Price by Age
Relative Unrealized Loss
Rolling Yearly Sum
ll-time-high
Drawdown from ATH'
Assessment and Conclusion
Bitcoin's current all-time high (ATH) drawdown is around -20% to -25% from its most recent all-time high of $110,000–$115,000. However, this decline is significantly lower than in previous cycles, where Bitcoin frequently experienced drawdowns of -70% to -85% after each peak. Even during medium-term corrections in previous bull cycles, the common decline ranged from -50% to -60%, much higher than the current structure.
The increasingly shallow drawdown reflects that long-term demand is now strong enough to absorb most of the selling pressure during sharp corrections. The emergence of Bitcoin Spot ETFs in the US, institutional capital inflows from traditional asset funds, and large-scale accumulation from long-term wallets have completely altered the market dynamics compared to the early cycles of Bitcoin.
A particularly positive sign is that the current drawdown has recovered strongly from near -40% to around -20% in a relatively short period. Historically, Bitcoin's rapid recovery phases from deep drawdowns often occur when the market completes a leverage clearing phase and begins a supply reabsorption cycle.
Assessment and Conclusion
Bitcoin continues to maintain a positive and constructive market structure on the medium and long-term timeframes, with prices stabilizing above key cost levels for short-term investors, while keeping a safe distance from the extreme downturns seen in previous recessions. Institutional capital flows through futures contracts and spot ETFs continue to be the main driver of the current trend, helping the market move toward equilibrium even during the early 2026 correction. This reflects that Bitcoin has entered a more mature phase in terms of account structure and the quality of capital inflows into the market.
However, recent on-chain and positioning data suggest that the level of maturity is showing signs of optimal differentiation beneath the price surface. While Bitcoin has recovered strongly to return to the $80,000 price range, the actual rate of expansion of spot capital flows has not yet synchronized with the rate of price recovery. Indicators related to spot accumulation activity, the number of new addresses, capital flows, and the extent of stablecoin payment expansion all suggest that new buying demand is still recovering at a significantly slower pace, thus avoiding historically strong price surges.
Simultaneously, the derivatives market is playing an increasingly important role in short-term dynamics. Lending interest rates remain sensitive, with open interest volumes rising rapidly as prices fluctuate in the options market, reflecting increased hedging demand within the current price range. This has recently been driven by a large amount of dynamic and temporary energy from the aggressive expansion of spot protocols. In this context, the market becomes significantly more sensitive to short-term liquidity fluctuations and susceptible to sharp volatility within narrow ranges.
Another key point is the increasing number of pool owners using time-limited forced distribution mechanisms when prices return to high-profit zones. While current returns remain significantly lower than the peak distribution levels of the previous cycle, the increasing supply trend from long-term holdings suggests the market is entering a genuine absorption phase, not just a technical rebound. This creates the potential for upward expansion, but this largely depends on the quality of the new money flowing into the market.
Disclaimer: The information presented in this article is the author's personal opinion in the field of cryptocurrency. This is not financial or investment advice. All investment decisions should be based on careful consideration of your personal portfolio and risk tolerance. The views expressed in this article do not represent the official stance of the platform. We recommend that readers conduct their own research and consult with experts before making any investment decisions.
API & Data : Glassnode
Compiled and analyzed by HCCVenture
Join the HCCVenture organization here: https://link3.to/holdcoincventure
Explore HCCVenture group
HCCVENTURE QUANT JSCO
© 2026 HCCVENTURE. ALL COPYRIGHTS RESERVED.


Connect with us
Popular content
Contact to us
Address: 8th Floor, Bach Dang Complex Building, 50 Bach Dang Street, Hai Chau Ward, Da Nang City, Vietnam.
Phone: 1900 1509
Gmail : sp_contact@hccventure.com
Disclaimer: The information on this website is for informational purposes only and should not be considered investment advice. We are not responsible for any risks or losses arising from investment decisions based on the content here.
TERMS AND CONDITIONS • CUSTOMER PROTECTION POLICY
ANALYTICAL AND NEWS CONTENT IS COMPILED AND PROVIDED BY EXPERTS IN THE FIELD OF DIGITAL FINANCE AND BLOCKCHAIN BELONGING TO HCCVENTURE ORGANIZATION, INCLUDING OWNERSHIP OF THE CONTENT.
RESPONSIBLE FOR MANAGING ALL CONTENT AND ANALYSIS: HCCVENTURE FOUNDER - TRUONG MINH HUY
Read warnings about scams and phishing emails — REPORT A PROBLEM WITH OUR SITE.