On-chain analysis for week 1/2026: Bitcoin in a fragile equilibrium
Bitcoin is operating within a fragile and time-sensitive structure where price dynamics are no longer driven by cash flow, increasing loss realization levels, and weakening new demand.
1/9/20269 min read
Market Summary
Bitcoin's inability to reclaim the 0.75 quantile cost distribution level (~$95,000) suggests that the majority of market supply remains in the hands of investors with lower cost bases than the current price. Compared to previous cyclical lows, the current $81,000 level is significantly higher in absolute terms, indicating that the market is still operating within the framework of a long-term bull cycle, although short-term momentum is weakening.
The Short-Term Holder Cost Basis at around $101,500 confirms that short-term investors remain in a state of unresolved losses, thereby undermining sustainable upward momentum.
The pressure doesn't stem from excessive leverage or chain liquidation events, but primarily from the psychology of holding onto unprofitable positions for extended periods , a characteristic often seen in sideways or corrective market phases within larger bull cycles.
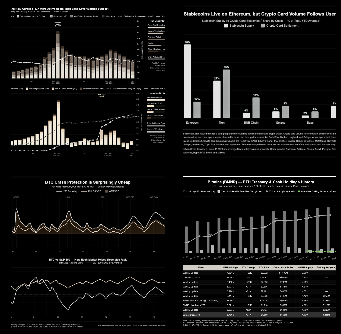
Capital flows from businesses and institutional treasuries still exist, but they are episodic – appearing in separate, isolated bursts – rather than forming a continuous pillar of support for the market.
Analyzing on-chain metrics


Halving is a core mechanism in Bitcoin's economic design, regulating the supply of new issuances over time and creating measurable cycles of scarcity. Unlike prediction- or expectation-based approaches, this analysis focuses on the actual performance of Bitcoin's price after halving , normalized over time, to assess changes in growth amplitude, revaluation rate, and cycle structure as the market matures.
Looking back at the history of Bitcoin, each halving cycle shows a high degree of similarity and structural stability in the formation of the next phase:
Epoch 1 (50 BTC/block) and Epoch 2 (25 BTC/block) recorded the most extreme price increases, with peak post-halving performance reaching hundreds of times the initial value. However, these cycles occurred in a context of thin liquidity, small market capitalization, and a lack of significant institutional capital participation, resulting in volatile and unsustainable price fluctuations.
Epoch 3 (12.5 BTC/block) and Epoch 4 (6.25 BTC/block) show a significant decrease in the maximum growth factor, but in return, a longer, less volatile, and clearer accumulation structure .
Epoch 5 (3,125 BTC/block) – the current cycle – is exhibiting the hallmarks of a mature market: price performance since the halving is lower than previous cycles in terms of percentage, but the price line maintains a stable upward trend, with few long-term structural breaks.
A common thread across all Epochs is that no halving cycle has seen Bitcoin fail to form a long-term uptrend after the supply is cut , although the speed and magnitude of the increase have varied significantly. Current post-halving price performance is characterized by a market with greater liquidity depth, where prices need more time to absorb the circulating supply, but are also less susceptible to structural collapse.
The current cycle suggests that Bitcoin is operating as a mature, scarce asset, where expected returns are lower in terms of percentage, but more structurally stable. In this context, evaluating Bitcoin after the halving should be placed within a long-term capital governance framework , rather than making mechanical comparisons to extreme bull cycles of the past.
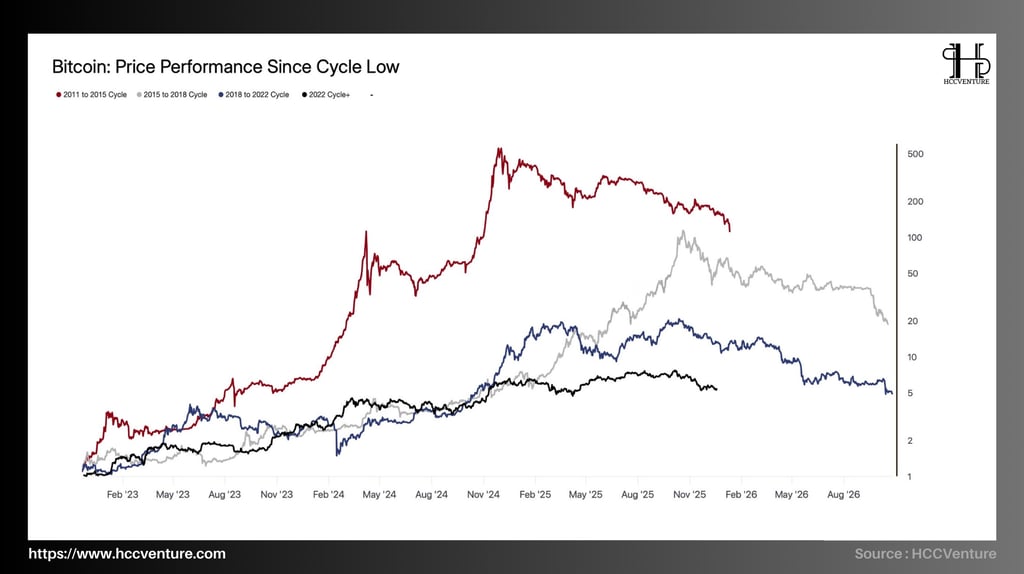

The cycle low not only represents the lowest price after a period of deep correction, but also marks the starting point of a process of re-accumulation, re-pricing, and reallocation of supply across the entire ecosystem.
Each new cycle begins from the bottom with a lower percentage increase in price performance compared to the previous cycle , but in return, it offers a more stable growth structure and is less prone to extreme speculation.
The cycle from 2022 onwards (the current cycle) is notable for its significantly lower growth performance since the bottom compared to previous cycles. However, the price trajectory shows greater stability, with fewer non-linear bursts, reflecting a mature market with deep involvement from institutional capital, ETFs, and companies holding Bitcoin on their balance sheets.
Bitcoin has maintained significant gains from its 2022 cyclical lows, while not returning to previous low valuation levels. This implies that the majority of circulating supply is held at a cost of capital lower than the market price, reducing panic selling pressure.
The current cycle reflects a mature phase for Bitcoin, where bullish performance is no longer explosive, but is supported by a solid supply-demand foundation, low capital costs for long-term investors, and increasing participation from institutional capital.
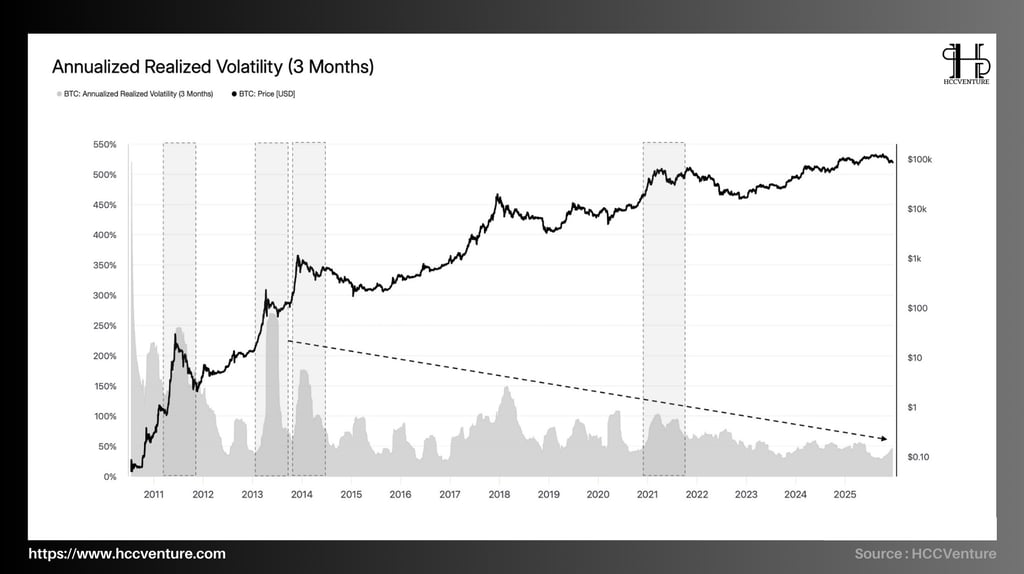
Volatility not only reflects the degree of price fluctuations, but is also a composite indicator of liquidity, market depth, investor behavior, and the stability of the supply-demand structure. The actual annual volatility of Bitcoin over more than a decade is directly related to the long-term price growth trajectory.
During the period of 2010–2013, the actual 3-month volatility of Bitcoin consistently remained extremely high, often exceeding 200%–300% , and even reaching historical peaks above 400% , a natural consequence of a very young market with a small capitalization.
However, at the present time, every supply-demand shock, every technical or psychological event can create large price fluctuations in a short period. High volatility does not reflect the intrinsic strength of Bitcoin, but mainly indicates instability in the market structure.
Bitcoin's low actual volatility while its price remains high suggests the market is in relative equilibrium, with supply becoming increasingly less sensitive to short-term fluctuations. Bitcoin has never ended a long-term bull cycle in a state of prolonged compressed volatility ; it typically requires a volatility breakout to re-establish a new price level.
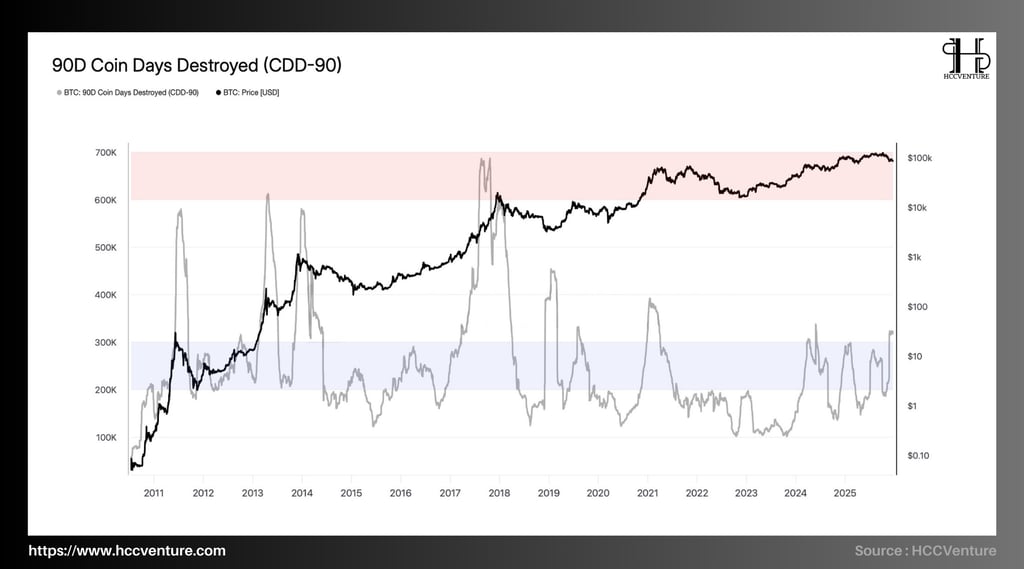
The CDD-90 doesn't measure typical selling pressure, but rather reflects the point at which long-term holders decide to distribute their assets , often associated with key transition phases in the Bitcoin market cycle.
Observing historical data from 2010 to the present, the CDD-90 shows a very clear recurring characteristic: the peaks of the CDD-90 almost exclusively appear in the late stages of a bull cycle , when the price of Bitcoin has risen sharply and entered a high revaluation zone.
The CDD-90 has rebounded from its 2022–2023 cycle lows, reflecting the beginning of a circulation of mid-age coins. However, this increase remains clearly below the historical peak distribution zone .
More importantly, the recent short-term spikes in the CDD-90 have been sporadic and unsustainable, in contrast to the sustained bursts of the past when the market truly entered a late-cycle euphoria.
The supply of "old" coins remains highly stagnant . The majority of coins accumulated during previous low-price periods have not been reintroduced to the market, indicating that long-term investor confidence remains strong. Current selling pressure primarily comes from medium- and short-term holders , rather than the decisive long-term capital flows.


While weekly performance reflects short-term momentum and speculative behavior , monthly and quarterly performance represents medium- and long-term capital flows , tied to liquidity cycles, macroeconomic revaluation, and asset allocation behavior of large investor groups.
In early cycles, weekly performance frequently recorded gains/losses exceeding ±20–30% , reflecting a thin, illiquid market heavily dominated by speculative capital flows. Monthly and quarterly performance saw periods of extreme surges, with many quarters recording gains of over 100–200% , particularly during the 2017–2021 period.
Weekly performance most clearly reveals the shift in market nature. In the early stages, consecutive weeks of sharp increases or decreases reflected alternating periods of euphoria and panic . Most weeks traded around the 0% mark , with significantly narrower ranges than in the past. Strong weekly rallies no longer occurred consecutively, but were interrupted by small, technical corrections.
Bitcoin tends to move in an accumulation-expansion pattern , rather than short-term vertical surges. This means that returns in the coming period are more likely to be formed through holding time and cycle management , rather than expecting non-linear spikes like in the past.


The Compound Annual Growth Rate (CAGR) serves as a core indicator for assessing the actual growth rate , eliminating short-term volatility noise. Since the 2022 correction cycle:
The 4-year CAGR continued to contract sharply, at times falling to low double-digit rates (around 10–20%) , a level rarely seen in history.
This is not a sign of structural weakness, but rather a natural consequence of Bitcoin reaching a market capitalization of trillions of USD , making it impossible to maintain the growth rate seen in the early stages.
The 4-year CAGR remains near its historical lows post-2015 , significantly lower than the CAGR peaks of previous cycles. Historically, each time the 4-year CAGR reached extreme lows, it coincided with the end of a bear market phase or the beginning of a recovery cycle .
Bitcoin's returns no longer come from short-term, dramatic surges, but are instead built through cyclical, cumulative growth , linked to institutional capital flows, ETFs, and long-term holding strategies. This aligns with Bitcoin's increasingly prominent presence in strategic investment portfolios , rather than simply as a short-term speculative tool.
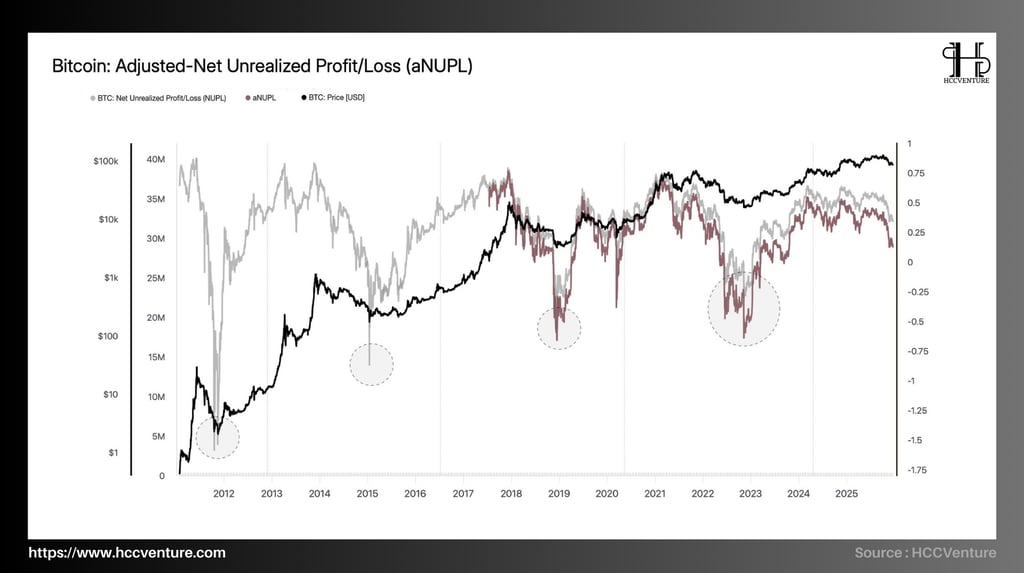
NUPL reflects the collective market sentiment through the difference between the current market price and the average cost of capital across the entire network. aNUPL has completed its recovery from the deep capitulation zone , confirming the cyclical bottom was established in the 2022–2023 period. The current state reflects average unrealized profits , not yet reaching historical euphoria levels.
Deep negative territory (below -0.25 to -0.5) : reflects widespread unrealized losses, typically only appearing in the later stages of a bear market .
Neutral zone (0 to 0.25) : represents the re-accumulation phase, when the market gradually balances supply and demand.
High-profit zone (0.5 and above) : reflects a euphoric state where the majority of supply is in high profit, accompanied by increased distribution risk.
In the current cycle, aNUPL has completely exited the negative zone , confirming the end of the capitulation phase; however, it is still fluctuating within the average positive profit range (around 0.25–0.4) , significantly lower than previous cycle peaks (typically exceeding 0.6–0.75).
The changing amplitude of aNUPL's volatility across cycles reflects increasingly shorter negative phases, while high-yield phases become increasingly "compressed," no longer expanding excessively as in its early stages. Bitcoin has shifted from an asset with extreme emotional cycles to one with a more stable yield structure , aligning with institutional capital flows and long-term holding strategies.

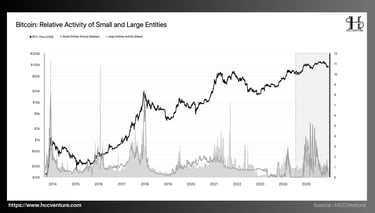
The relative level of activity between small entities and large entities allows for a deeper assessment of who is leading the market at each point in the cycle.
The activity of large entities, acting as the "backbone" of the cycle, often intensifies particularly at key phase transitions of the cycle, such as the bottoming phase after a bear market, or local distribution phases when prices approach the cycle's peak.
Meanwhile, the activity of smaller entities tends to explode later, after price trends have been established, and surges sharply during euphoric phases, where short-term profit expectations prevail.
The current phase shows:
Activity by large entities has increased significantly compared to the low point of 2022–2023.
The activity of small entities also increased, but at a lower level and with less sustainability, indicating late-cycle participation.
Activity by large entities is now significantly higher, reflecting the continued dominance of institutions and whales in on-chain flows. This contrasts with previous peak phases of the cycle, where activity by small entities was often more dominant and explosive.
When large entities maintain high activity levels while small entities only increase moderately, the market is typically in a controlled revaluation phase . Systemic selling pressure is lower, as the majority of supply is held by entities that are better able to withstand volatility.
Assessment and Conclusion
Entering the first week of the year (early January) , the Bitcoin market structure remains true to the characteristics described by the on-chain indicators above: a fragile, time-sensitive sideways movement , with resistance coming from dense overhead supply and support from patient demand around the network's "fair value" zone.
From a structural price-holding cost perspective, the market remains "locked" within the accumulated supply corridor at the high end. The price rejection around ~$93,000 and subsequent decline to ~$85,600 is a direct consequence of the peak buying supply in the $ 93,000–$120,000 range , which continuously exerted pressure on price rebounds.
In this context, the two "necessary conditions" for restoring the upward momentum remain unchanged: (i) recapturing the 0.75 quantile (~$95,000) to reduce the intensity of nearby supply, and more importantly, (ii) recapturing the Short-Term Holder Cost Basis (~$101,500) to bring the majority of short-term investors back into a profitable state based on on-chain costs, thereby restoring the resilience of demand. Until these two conditions are met, any rebound will essentially remain a technical rebound within a sideways range , not a trend extension.
Disclaimer: The information presented in this article is the author's personal opinion in the field of cryptocurrency. This is not financial or investment advice. All investment decisions should be based on careful consideration of your personal portfolio and risk tolerance. The views expressed in this article do not represent the official stance of the platform. We recommend that readers conduct their own research and consult with experts before making any investment decisions.
API & Data : Glassnode
Compiled and analyzed by WHAT Exchange and HCCVenture
Join the HCCVenture organization here: https://link3.to/holdcoincventure
Explore HCCVenture group
HCCVenture © 2023. All rights reserved.


Connect with us
Popular content
Contact to us
E-mail : sp_contact@hccventure.com
Register : https://linktr.ee/holdcoincventure
Disclaimer: The information on this website is for informational purposes only and should not be considered investment advice. We are not responsible for any risks or losses arising from investment decisions based on the content here.
TERMS AND CONDITIONS • CUSTOMER PROTECTION POLICY
ANALYTICAL AND NEWS CONTENT IS COMPILED AND PROVIDED BY EXPERTS IN THE FIELD OF DIGITAL FINANCE AND BLOCKCHAIN BELONGING TO HCCVENTURE ORGANIZATION, INCLUDING OWNERSHIP OF THE CONTENT.
RESPONSIBLE FOR MANAGING ALL CONTENT AND ANALYSIS: HCCVENTURE FOUNDER - TRUONG MINH HUY
Read warnings about scams and phishing emails — REPORT A PROBLEM WITH OUR SITE.