

Delayed cash flow - Bitcoin still hasn't peaked, a cycle that's more unpredictable than before.
Since Bitcoin's inception in 2009, its price fluctuations have consistently shown a clear cyclical pattern. The inflow of ETFs and traditional financial institutions is causing historically delayed capital flows in the market, resulting in multi-directional fluctuations.
INSIGHTS
7/16/202623 min read


Delayed cash flow - Bitcoin still hasn't peaked, a cycle that's more unpredictable than before
Since Bitcoin's inception in 2009, its price fluctuations have consistently shown a clear cyclical pattern. The inflow of ETFs and traditional financial institutions is causing historically delayed capital flows in the market, resulting in multi-directional fluctuations.
Analysis • 16 July, 2026


Report Summary
Unlike the exponential growth seen in the 2013 or 2017 cycles, Bitcoin's price increase before peaking was significantly lower, and on-chain indicators did not show the extreme speculation seen in previous periods. If the cycle peak was "softer," the probability of the next cycle bottom forming with a smaller decline is a statistically sound hypothesis. In the three previous complete cycles, Bitcoin recorded very deep price drops after reaching its peak: the 2011–2015 cycle saw a correction of approximately -93% , bringing the price from nearly $1,160 to around $152; the 2017–2018 cycle saw a drop of approximately -84% , from nearly $19,800 to $3,120; During the 2021–2022 cycle, the decline continued to narrow to approximately -77% , as Bitcoin fell from $69,000 to nearly $15,500.
The October 2025 peak continues this trend, with the increase from the 2022 low to the new peak being significantly lower than in previous cycles. Simultaneously, annualized volatility has decreased to its lowest level since Bitcoin's inception. The market is gradually expanding in market capitalization, increasing liquidity, and attracting stronger participation from institutional capital, thus eliminating extreme fluctuations. Statistically, if the trend of amplitude compression continues, the likelihood of Bitcoin repeating drops of over 75-80% is quite low. Instead, a correction fluctuating around 55-65 % from the cycle peak would be more consistent with historical developments observed over the past several years.
The market has not yet reached a state of complete capitulation, and one of the hallmarks of every Bitcoin cycle bottom is the simultaneous appearance of capitulation across multiple investor groups. In previous cycles, a large proportion of long-term investors were forced to sell below their cost, SOPR plummeted below 1 for an extended period, Realized Loss reached record highs, and MVRV Z-Score fell into low valuation zones. However, current data does not yet fully reflect these conditions.
Although the MVRV Ratio has fallen sharply from its high valuation range after the 2025 peak, it remains significantly higher than the historical lows of 2015, 2018, and 2022. Simultaneously, the Realized Price continues to rise steadily thanks to large accumulated capital from spot ETFs and long-term institutional investors. The gap between the market price and the Realized Price is still much larger than in previous bottoming phases, indicating that valuation pressure has not been fully absorbed. In particular, the Long-Term Holder Supply index remains near its historical peak. Until this supply is transferred to a new group of investors at lower prices, the probability of a cyclical bottom forming remains relatively limited.
From a statistical and on-chain analysis perspective, the most likely scenario remains that Bitcoin will continue its revaluation process in the remaining quarters of 2026 before entering the next growth cycle. Assuming the cycle continues to compress as in historical trends, the $49,000 - $57,000 range remains a reasonable valuation point likely to attract long-term demand and act as a base bottom formation area for the current cycle. This is not an absolute forecast but rather an inference based on historical data and quantitative on-chain models, in the context of the absence of signals confirming that the bottoming process has been completed.
Overview of Bitcoin's 4-Year Cycle
Throughout its more than 17-year history, Bitcoin has repeatedly demonstrated that its price fluctuations are not random but follow a relatively stable cyclical structure. Each cycle typically begins at the bottom of a previous bear market, continues to accumulate in the period before the Halving, enters a strong growth phase after the supply of new issuances is reduced, and finally ends with a prolonged correction period before forming a new bottom. Although the participation of financial institutions, spot ETFs, and macro capital flows has significantly altered the market structure, historical data shows that the four-year cycle model remains effective in describing Bitcoin's behavior.
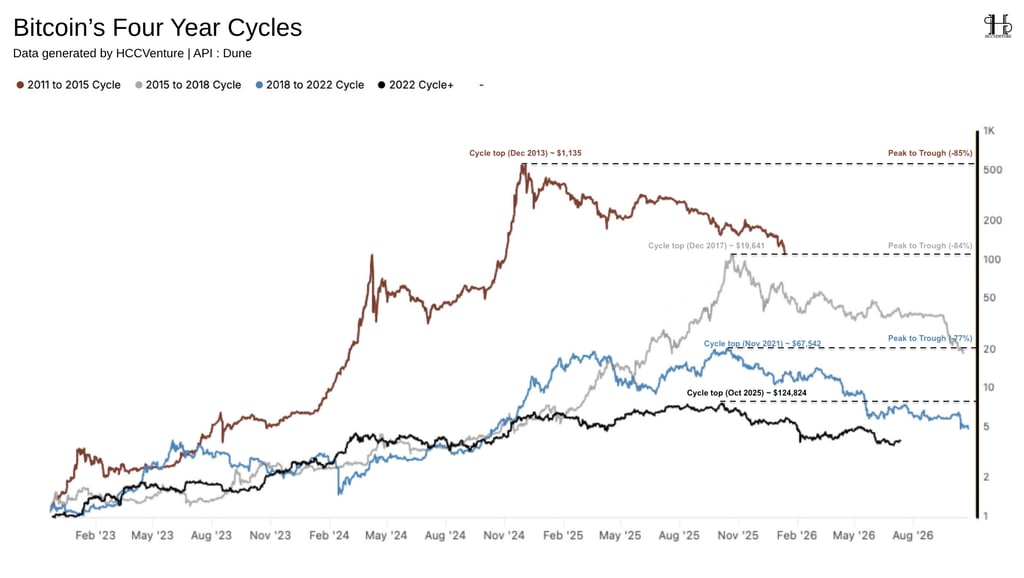
While early cycles often saw a sharp surge immediately following the Halving, the current cycle suggests the market needs more time to absorb supply and form a sustainable uptrend. This is especially true now that Bitcoin's market capitalization has surpassed trillions of USD, meaning the amount of capital required to generate the same significant price increase is far greater than before.
Historical data also shows that the profitability of each cycle is decreasing according to the law of marginal return, with the 2011–2015 cycle yielding the highest return. The current cycle continues this trend, with significantly lower post-Halving price increases despite the network's fundamentals never being as strong as they are now. This is a sign that Bitcoin is gradually transitioning from an exponentially growing asset to a macro asset with increasingly stable volatility.
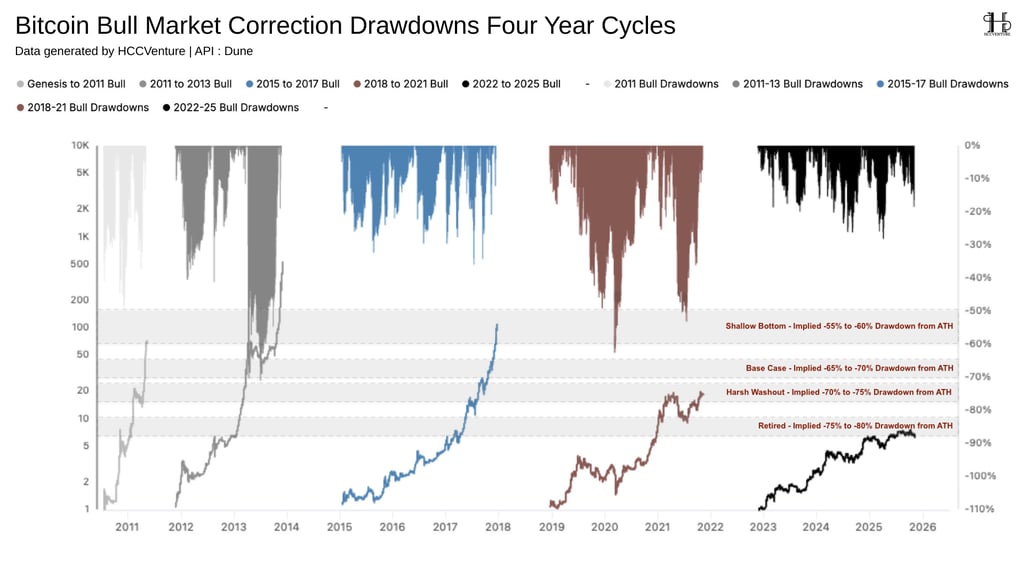
Historical data shows that although Bitcoin consistently sets higher highs after each Halving cycle, the scale of corrections and the time it takes to form bottoms tend to narrow as the market matures. This is seen as a direct consequence of improved liquidity, expanding market capitalization, and a growing proportion of institutional capital flows, significantly reducing the extreme volatility seen in the early cycles.
Observing the entire market history reveals that the decline from peak to trough in each cycle gradually decreases over time. For the current cycle, as of June 9, 2026 , Bitcoin has only been around for about 8 months since reaching its peak in October 2025. This period is still significantly shorter than previous cycles, where market bottoms typically appeared 12-13 months after the peak. Considering the time factor, the current cycle is still in a medium-term correction phase and has not yet reached a point with a high statistical probability of completing the bottoming process.
Instead of prolonged sell-offs of over 40-50% like in the 2018-2021 period, most current corrections only fluctuate around 10-25% before money quickly flows back into the market. The demand structure has become more stable thanks to the participation of Bitcoin Spot ETFs, institutional investment funds, and long-term investors. If the trend of price compression continues, the current cycle is unlikely to repeat the 77-85% declines of previous cycles.
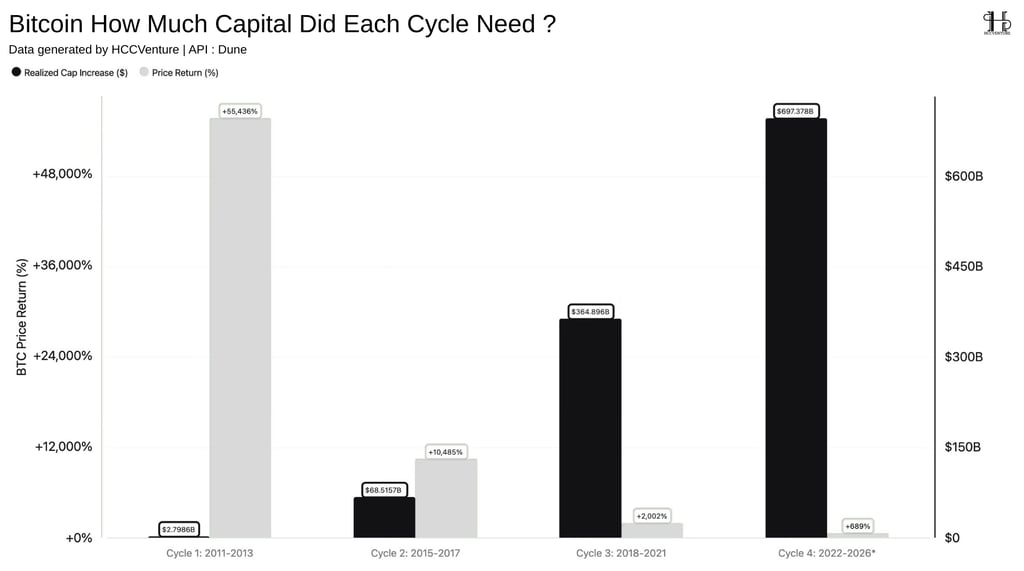
The market now requires significantly more capital to generate lower price increases, reflecting the maturation of the liquidity structure and the expansion of the network's capitalization. One of the most significant changes in the Bitcoin market structure is the relationship between realized capital and price returns . While early cycles were primarily driven by small capital flows and limited liquidity, recent cycles show that Bitcoin requires increasingly larger amounts of capital to generate increasingly lower price returns. As the amount of realized capital injected into the network increases exponentially with each cycle, Bitcoin's rate of return has declined sharply; the efficiency of generating returns per unit of new capital is diminishing as the market size expands and liquidity deepens.
In the current cycle ( 2022-2026) , the accumulated net capital has reached approximately $697.38 billion , the highest level in Bitcoin history and nearly double that of the 2018-2021 cycle. However, the price increase from the 2022 low to the October 2025 peak is only about 689% , further confirming the declining trend in profit margins over time. A direct comparison between the two metrics shows that the conversion efficiency from capital flow to price growth has decreased significantly with each cycle.
From an economic perspective, this is a natural consequence of the law of diminishing marginal returns . As the network size and market capitalization expand, each new unit of capital will have a smaller impact on the price. Therefore, the fact that Bitcoin has maintained its ability to increase by nearly 700% in the current cycle despite absorbing nearly $700 billion in new capital inflows signals that the demand for long-term investment remains very high.
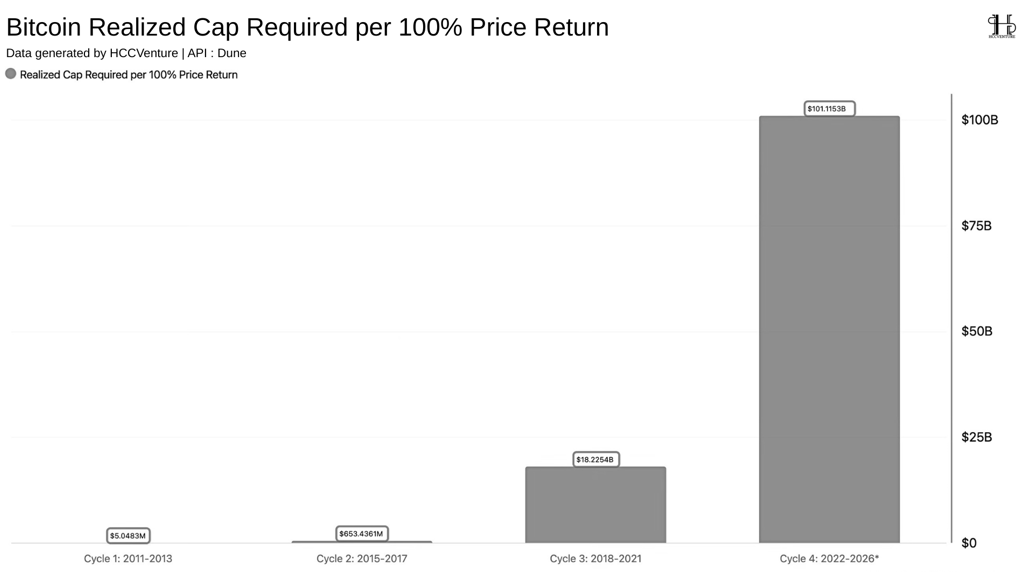
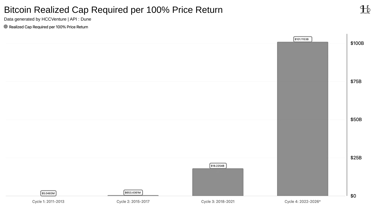
The growth of Bitcoin is not only reflected through price increases, but also measured by the actual amount of capital flowing into the network, with the most important quantitative metric being the Realized Capital Required per 100% Price Return – the amount of Realized Capital needed to generate every 100% increase in Bitcoin's price over each cycle. We observe that Bitcoin increasingly requires more capital to generate the same price increase , reflecting the law of diminishing marginal returns as the network's capitalization continues to expand.
In the current cycle of 2022–2026 , the required capital continues to increase sharply to approximately $101.12 billion for every 100% price increase, more than 5.5 times higher than the previous cycle and nearly 20,000 times higher than the 2011–2013 cycle, the highest level in the history of the Bitcoin network. This exponential increase in Realized Cap Required directly reflects the Diminishing Marginal Returns principle in economics.
When Bitcoin was still in its small market capitalization, each unit of new capital could generate a very large price increase due to low liquidity and limited circulating supply. However, once the market capitalization exceeded trillions of USD, the same amount of capital would have a significantly smaller impact on the price. Deeper liquidity structures, the participation of Bitcoin Spot ETFs, traditional financial institutions, and long-term investors have helped reduce price volatility, while requiring larger amounts of capital to sustain the upward trend.
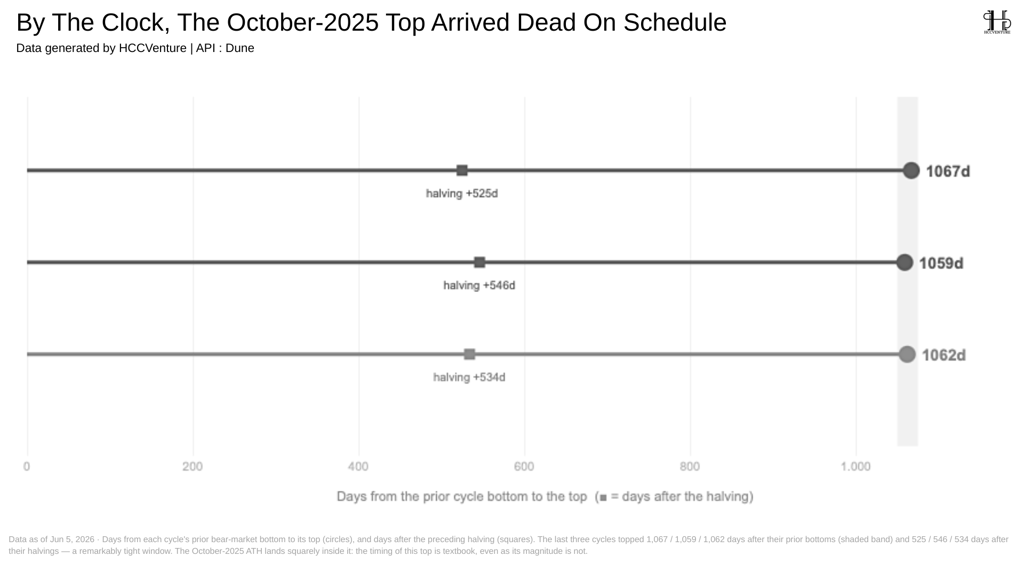
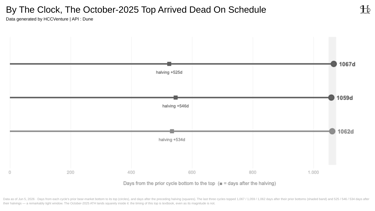
Since the first cycle, market peaks have consistently appeared after a relatively stable period following the previous cycle's bottom and after the Halving event. Historical data shows that the time between the bear market bottom and the peak of the three most recent cycles is almost identical.
The 2015-2017 cycle peaked approximately 1,067 days after the 2015 low.
The 2018-2021 cycle peaked approximately 1,059 days after the December 2018 low.
The 2022-2025 cycle peaked in October 2025, approximately 1,062 days after the November 2022 low.
The fluctuation of just 8 days between the three cycles, equivalent to a deviation of less than 1% , reflects the very high stability of the time structure. Although Bitcoin's market capitalization has increased from tens of billions of USD to trillions of USD during the same period, the time required to complete the growth phase has remained virtually unchanged. On average over three cycles, Bitcoin needed approximately 535 days after the Halving to complete the main growth phase of the bull market. The error between cycles fluctuated by only about ±11 days , reflecting one of the most stable patterns in Bitcoin's entire history.
Bitcoin continues to move in the same time rhythm; however, the scale of growth in each cycle gradually decreases as the amount of capital required to move the price increases. In other words, the duration of the cycle is almost uniform, while the profit margin continuously narrows . This is considered a characteristic sign of an asset transitioning from its early growth phase to a mature phase, where large market capitalization slows down the rate of price increase but does not alter the cyclical structure.
A more multidimensional cyclical perspective
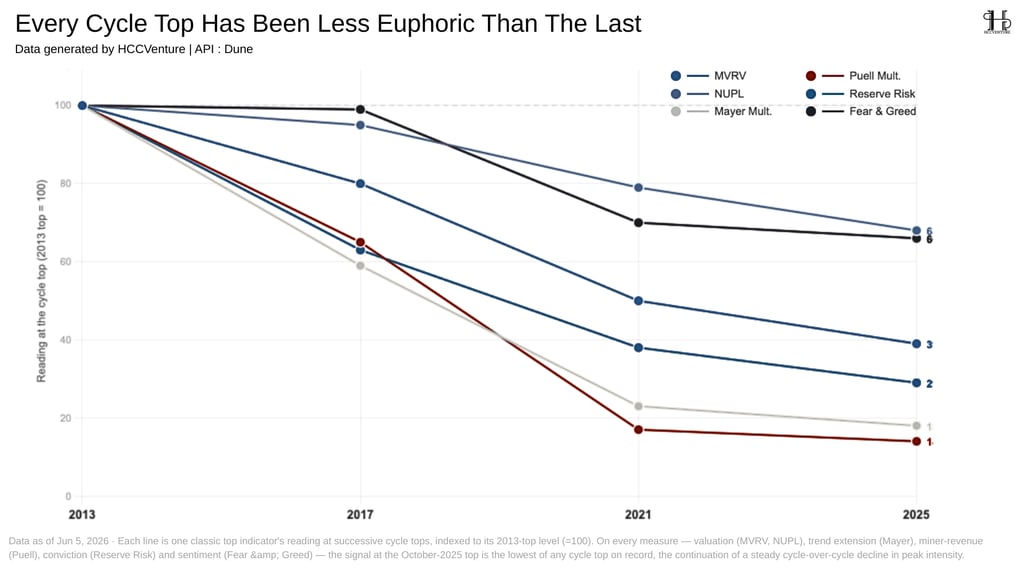
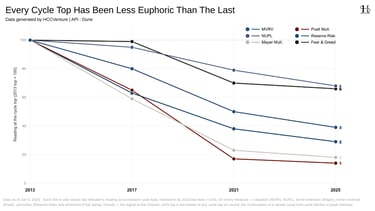
Each Bitcoin cycle peak is less euphoric than the previous one, and one of the most significant changes in Bitcoin over the past decade has been the marked decline in euphoria at cycle peaks. While the 2013 and 2017 cycles were characterized by strong speculative flows, valuations far exceeding intrinsic value, and widespread FOMO, the 2022–2025 cycle presents a completely different structure. Although Bitcoin is still set to reach new record highs in October 2025, most valuation indicators, investor behavior, and on-chain data suggest the lowest level of market overheating in history.
In the three previous cycles, MVRV consistently reached very high peaks, fluctuating between 2.93 and 5.91 , reflecting market prices trading many times higher than the average cost basis of the entire network. However, at its peak in October 2025 , MVRV only reached approximately 2.29 , significantly lower than even the lowest point of the 2021 cycle.
The 2013 and 2017 cycles both saw extremely large unrealized returns, with the majority of investors holding very high returns. However, by the 2025 cycle, NUPL is only about 68% of the normalized level of 2013, significantly lower than the 2017 and 2021 cycles.
More notably, the Puell Multiple , an indicator that measures miner revenue against its historical average, is only about 14% of its normalized 2013 level. This is the lowest level in Bitcoin history and reflects significantly reduced profit-taking pressure from the mining group thanks to a more stable revenue structure as well as the development of derivative markets and hedging instruments.
Meanwhile, the Fear & Greed Index also only reached around 66% , significantly lower than the peaks of the 2013 and 2017 cycles. Although Bitcoin set a new all-time high, market sentiment no longer showed the extreme euphoria or large-scale FOMO flows seen in the past.
Most valuation indicators, investor sentiment, and behavior are showing the lowest intensity since 2013, confirming that cycle compression is clearly underway. The October 2025 peak is therefore considered a mature market top , formed primarily by institutional capital flows and long-term accumulation, rather than a speculative, explosive peak.
Research and Analysis
Report Summary
Overview of Bitcoin's 4-Year Cycle
Bitcoin's Four Year Cycles
Bitcoin Bull Market Correction Drawdowns
How much Capital Did each cycle need ?
BTC Realized Cap Required per 100% Return
By the clock, Top Arrived dead on Schedule
A more multidimensional cyclical perspective
Every Cycle Top has been less Euphoric
The Slide has Slipped Below Cycle
The cycle is compressing From Both Ends
The milder the peak, the higher the valuation.
A Muted top raises the Floor
BTC bear-bottom price relative
The floor is a moving target
The basis for further analysis of the argument
Bitcoin price and cycle Tops / Bottoms
Bitcoin price kept climping
Bitcoin Pi cycle top indicator
Identifying the bottom of a downtrend is always the most difficult task in Bitcoin analysis. Unlike the peak of the cycle, which is usually accompanied by extreme euphoria and consensus pricing signals, the bottom is only confirmed when the majority of investors have completed their capitulation, supply is redistributed, and on-chain indicators collectively shift to an accumulation phase.
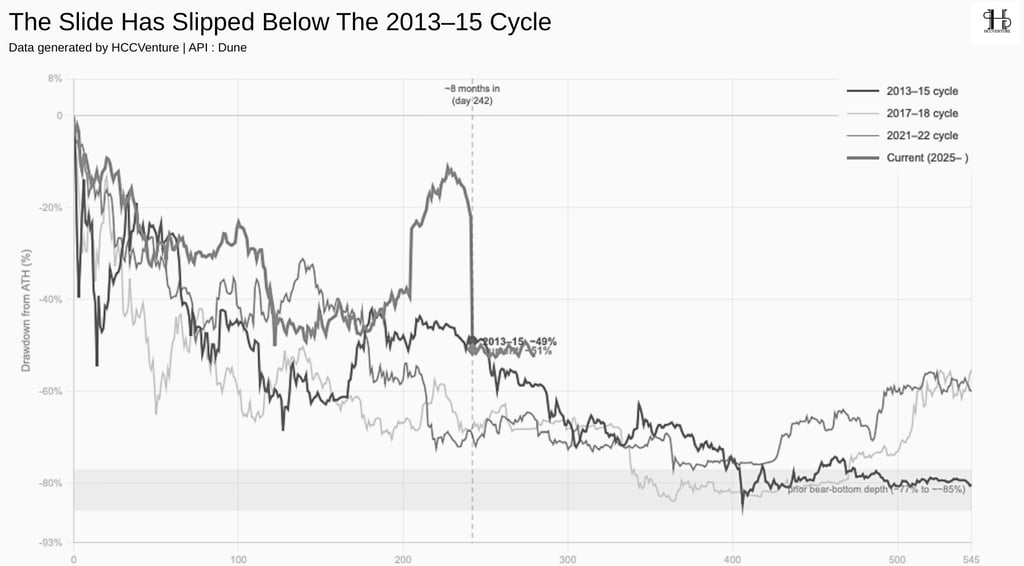
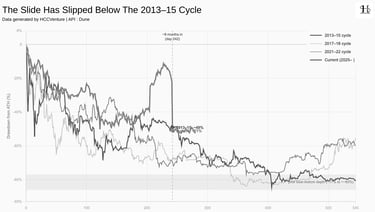
As of early June 2026, Bitcoin had fallen approximately 51% from its all-time high set in October 2025, a sharper correction than the same period in the 2013-2015 cycle , when Bitcoin had only fallen about 48-49% and was in a technical rebound. However, compared to more severe downturns, the current correction is still significantly lower. Around 242 days after their peaks, the 2017-2018 and 2021-2022 cycles both saw declines of approximately 68% , while the final bottoms of historical bear markets were in the -77% to -85% range .
Besides the magnitude of the price drop, time remains a crucial variable. Previous cycles have shown that Bitcoin typically needs about 12-13 months from its peak to complete the bottoming process. Meanwhile, the current cycle has only been underway for about 8 months since its October 2025 peak. If the four-year cycle continues, the window with the highest probability of a bottom appearing will likely fall in late 2026 , rather than the current period. A fourth important signal appearing in early June 2026 is the Hash Ribbons Recovery Cross , when the 30-day moving average of the Hash Rate crosses back above the 60-day moving average after the miners capitulate. Historically, this signal often appears near the bottom of downward cycles and reflects that mining activity has begun to stabilize again.
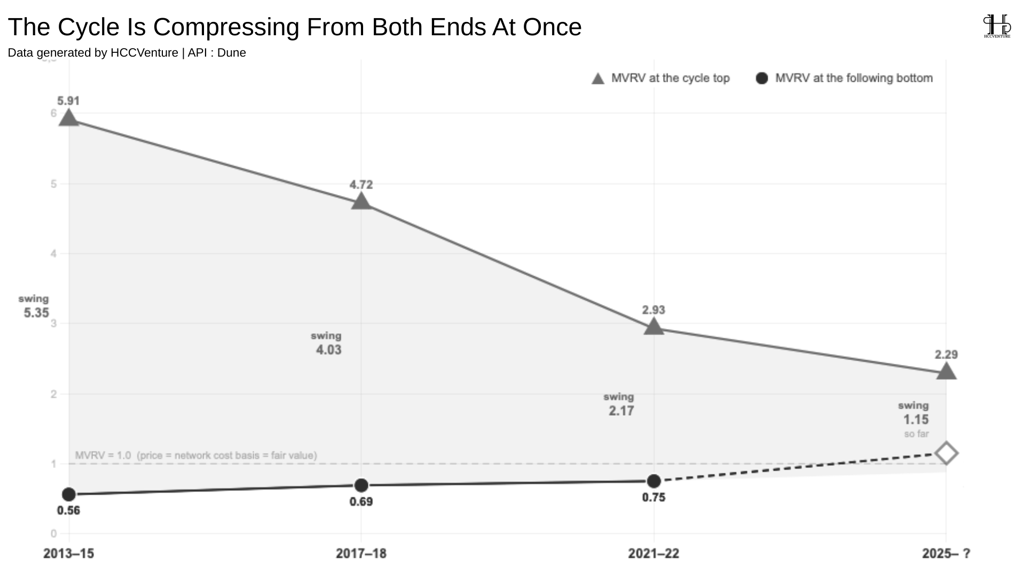
The Bitcoin cycle is narrowing from both ends with “ lower peaks, higher troughs .” One of the most striking features of Bitcoin over the past decade has been the constant shift in the amplitude of its market cycle. While early cycles were characterized by extreme valuations at both peaks and troughs, current on-chain data shows the gap between these two points narrowing significantly. In other words, cycle peaks are becoming less euphoric, while cycle troughs are increasingly being formed at higher valuations , reflecting the network's maturation and a shift in capital flow structure.
The chart uses the MVRV Ratio (Market Value / Realized Value) , an indicator measuring the difference between the market price and the average cost basis of the entire network, to compare the peaks and troughs of four consecutive cycles. The results show that the MVRV range has continuously narrowed, and the price adjustments have also gradually decreased from one cycle to the next. The peak in October 2025 recorded an MVRV of only about 2.29 , the lowest in the history of Bitcoin's growth cycles. Compared to 2013, this indicator has decreased by more than 61% , indicating that the market is no longer experiencing the extreme valuations of the past, even though Bitcoin still sets all-time high prices.
For the current cycle, the lowest point recorded up to the beginning of June 2026 was only about 1.15 (temporary value), meaning the market price is still about 15% higher than the average cost . Bitcoin has not yet entered the undervalued zone like the lows of previous cycles, and the correction process is likely not yet complete. This trend reflects the Cycle Compression occurring simultaneously at both ends of the cycle. The peaks are increasingly less overvalued, while the bottoms are no longer falling into the deep discount zones as before. As a result, the MVRV range is continuously narrowing over time.
The gradual decrease in the correction range indicates that the cyclical compression pattern is not only occurring in terms of pricing but is also reflected in actual price behavior. However, the current -51% level is still only a temporary figure , as the cycle is not yet complete and there are not enough signals to confirm a long-term bottom. In all three complete cycles, the bottom was formed when the MVRV fell below 1 , meaning the market price traded lower than the average cost basis of the entire network. This is a sign that the majority of investors are incurring unrealized losses and the market is entering a full-blown capitulation phase.
The milder the peak, the higher the valuation
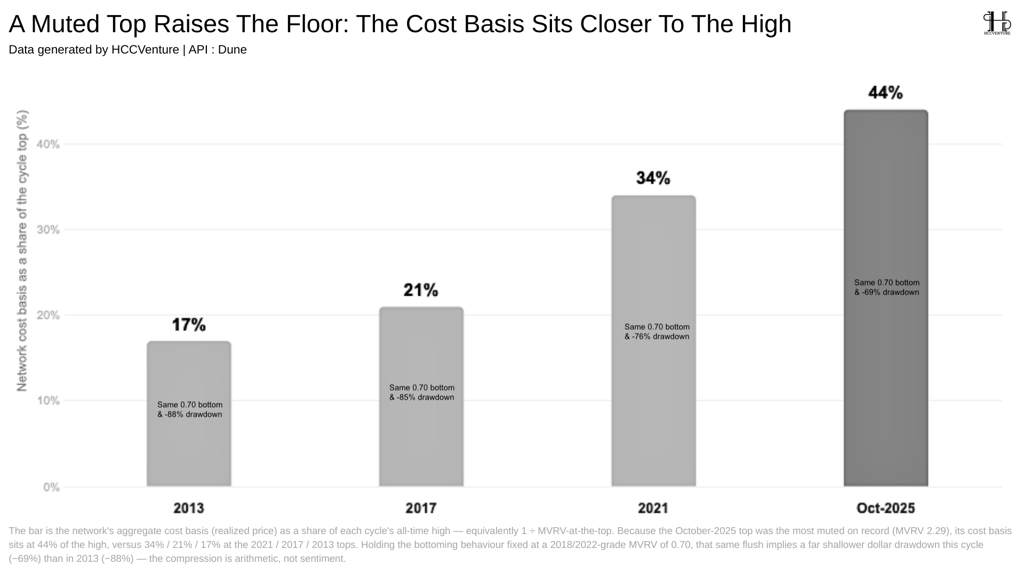
One of the most significant consequences of cycle compression is the continuous shift of the network's Realized Price closer to the cycle peak. Mathematically, Realized Price = Cycle Peak Price / MVRV at Peak (meaning that as the MVRV at peak decreases over each cycle, the network's cost of capital will move closer to its highest price).
The chart shows that the Realized Price-to-ATH ratio has steadily increased from 16.9% in the 2013 cycle to nearly 44% at the October 2025 peak. This indicates that although Bitcoin's growth is slowing down, the network's valuation foundation is becoming increasingly solid. In just three cycles, the average cost of the entire network has increased nearly 2.6 times compared to the rate at the 2013 peak. This is clear evidence that Bitcoin's price increase is no longer primarily driven by speculation, but is increasingly supported by the actual capital flowing into the network.
Since the Realized Price is equal to ATH divided by MVRV , the gradual decrease in MVRV significantly narrows the gap between the market price and the cost basis. In other words, the more "moderate" the cycle peak, the more real capital is accumulated at higher price levels. This helps raise the cost basis of the entire network and creates a more solid support base for subsequent cycles. This is the result of sustained accumulation from Bitcoin Spot ETFs, institutional investment funds, and long-term investor groups during 2024–2025, rather than a surge of short-term speculative capital.
A key aspect of this model is its ability to separate the influence of cyclical peaks from bottoming behavior . Quantitatively speaking:
The 2013 cycle will correspond to a correction of approximately -88% .
The 2017 cycle recorded a decline of approximately -84% .
The 2021 cycle corresponds to approximately -77% .
The 2025 cycle , with Realized Price accounting for nearly 44% of ATH , will only correspond to approximately -69% .
Assuming all cycles end at the same MVRV of around 0.70 , equivalent to the common bottom range in the 2018 and 2022 cycles, the higher Realized Price alone automatically narrows the price decline of each cycle. This suggests that smaller corrections don't necessarily stem from less investor selling , but are a mathematical consequence of significantly increased network-wide capital costs. In other words, the same bottoming behavior, but originating from a higher cost base, will always result in a smaller price decline.
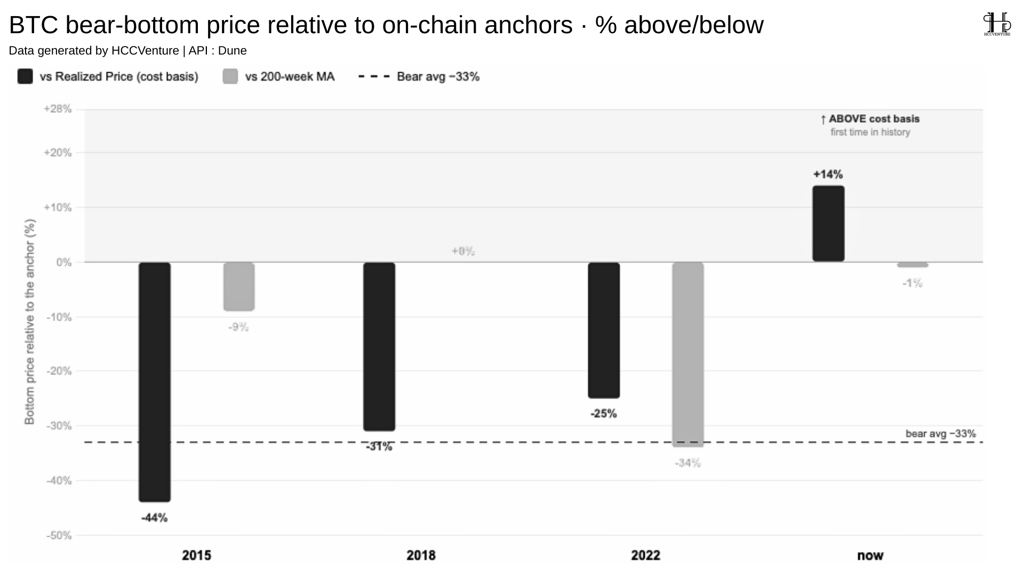
In on-chain analysis, identifying the market bottom should not be based on absolute correction ratios such as a 70% or 80% drop from the peak, because Bitcoin's volatility has consistently narrowed with each cycle. Instead, modern quantitative models use the Realized Price (the cost basis of the entire network) and the 200-Week Moving Average (200W MA) as two long-term valuation benchmarks to assess the extent of the market discount.
History shows that every Bitcoin bear market bottom has formed when the price traded significantly below both of these points. However, the data from the current cycle reflects a completely different structure: although Bitcoin has corrected about 51% since its October 2025 peak, the price remains above the Realized Price and has only just approached the 200-week moving average. Considering the valuations that have confirmed all historical bottoms, the market has not yet entered the discount zone characteristic of a complete cyclical bottom.
Realized Price represents the average cost of capital for the entire circulating supply of Bitcoin , reflecting the actual amount of capital injected into the network rather than just market price fluctuations. This data shows that the gap between the market price and the cost price has continuously narrowed over time, reflecting cycle compression . However, a common feature of all three cycles is that the price traded below the network's cost price , creating widespread unrealized losses, a characteristic condition of the capitulation phase. Conversely, as of early June 2026, the price of Bitcoin was still about 14% higher than the Realized Price . This is the first time in Bitcoin's cycle history that, after a correction of more than 50%, the price has not yet fallen below the network's cost price.
If we apply the discount margins of previous cycles to the current valuation levels, both methods yield fairly similar results. With Realized Price, assuming Bitcoin bottoms out in the 25-44% range below cost, as in previous cycles, this would correspond to a price range of approximately $30,000-$40,000 . Meanwhile, if we use the average distance from the 200W MA , the reasonable valuation range would be between $41,000-$62,000 , depending on the discount level of each historical cycle.
Although the two methods yield different ranges, both suggest that the potential bottom remains lower than the current price , but is simultaneously significantly higher than the 75-85% drop scenarios seen in Bitcoin's early cycles.
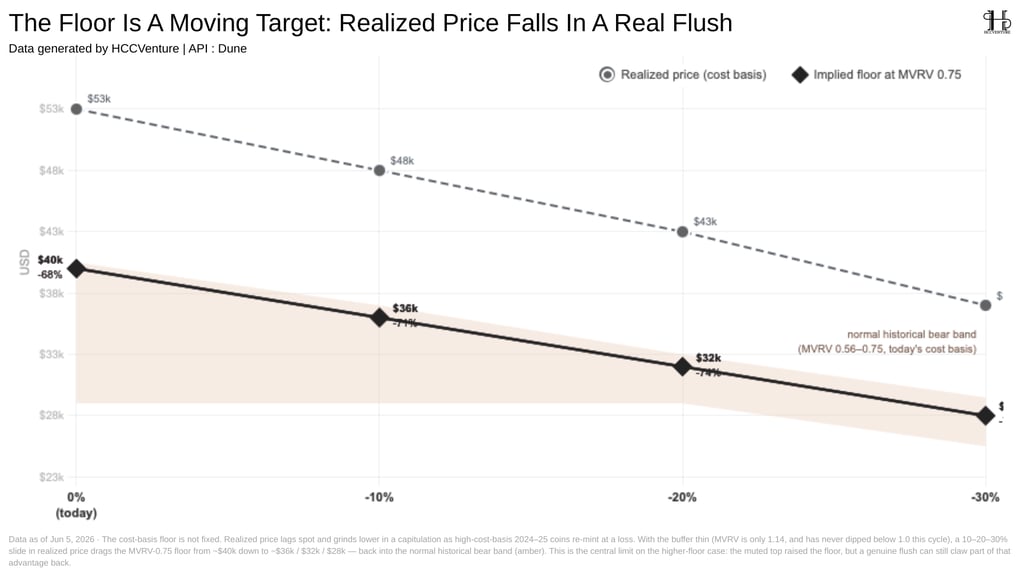
One of the most important arguments supporting the scenario that Bitcoin will form a higher bottom in the current cycle is that the Realized Price (the cost basis of the entire network) has risen to an all-time high thanks to the large capital inflows accumulated during the 2024–2025 period. However, the Realized Price is not an immutable support level. This is the most important limit of the " higher bottom " argument. A less euphoric cyclical peak helps to raise the initial price base, but if the market enters a large-scale capitulation phase, this base will also be corrected downwards. Therefore, determining the cyclical bottom cannot be based solely on the current Realized Price but must take into account the possibility that this indicator will continue to shift during the market's revaluation process.
When investors sell Bitcoin at a price lower than they bought it for, those coins are recorded at a new, lower price, causing the Realized Price to gradually decrease over time , especially during capitulation periods when stop-loss orders surge. Therefore, the Realized Price is not a "fixed price floor ," but rather a valuation benchmark that constantly moves according to market behavior. In previous sharp declines, the Realized Price consistently fell significantly during the bottoming process.
If the Realized Price remains unchanged , the theoretical bottom would be around $40,000 , representing a correction of approximately -68% from the October 2025 peak. If the Realized Price falls by 10% , the bottom would shift to around $36,000 , representing a decrease of approximately -71% .
In a scenario where the Realized Price falls by 20% , the bottom would continue to drop to around $32,000 , representing a correction of approximately -74% . If a severe capitulation occurs causing the Realized Price to fall by 30% , the theoretical bottom would retreat to around $28,000 , representing a drop of approximately -77% , closely coinciding with the bottom of the 2021–2022 cycle.
These scenarios suggest that even if the current cycle has a higher base price, a real sell-off could still pull the valuation range back to historically established levels.
During bull runs, these investor groups contributed to raising the Realized Price through large-scale accumulation. However, institutional capital flows typically follow trends rather than aggressively investing during sharp declines. Furthermore, data from 2026 shows several periods where ETF Spots experienced net outflows , indicating that institutional money doesn't always absorb selling pressure. In the event of increased selling pressure or investors withdrawing from ETFs, the process of returning fund units could increase the amount of Bitcoin reintroduced into the market, thereby amplifying short-term volatility.
A less euphoric peak allows more Bitcoin to accumulate at higher price levels, thereby raising the average cost of capital for the entire network. However, if a capitulation actually occurs, the Bitcoin purchased at these higher prices will be traded again at lower prices, driving down the Realized Price. In other words, a higher price base and the possibility of a lower price base during capitulation are two manifestations of the same pricing mechanism .
The basis for further analysis of the argument
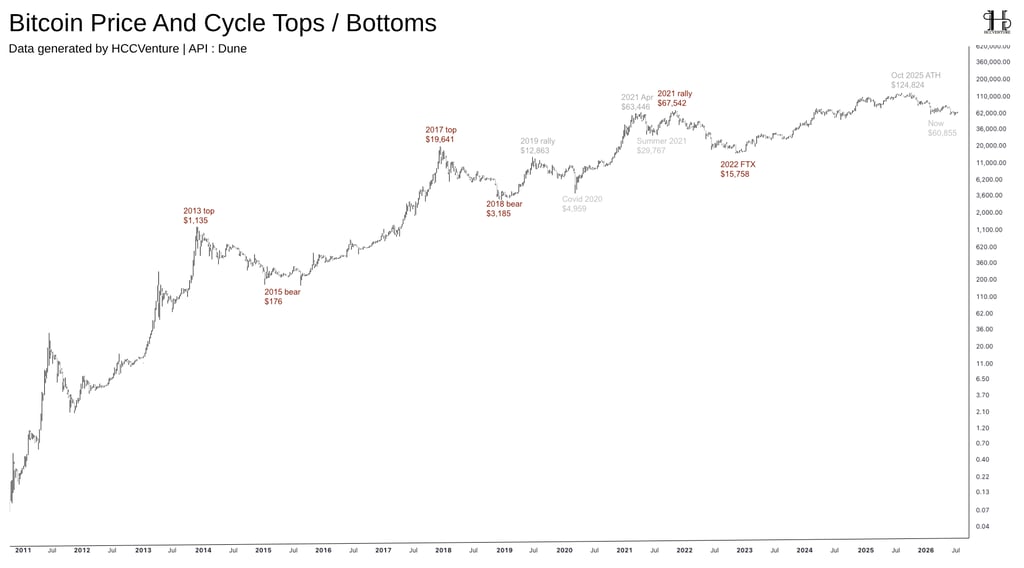
The chart summarizing the entire Bitcoin price history from 2011 to mid-2026 forms the basis for the entire analytical methodology in this report. Instead of simply observing price movements, the study uses on-chain data to identify recurring patterns in each cycle, from bottoming out, halving, trend extension, peak formation, and return to a bear market.
Observations on a logarithmic price scale show that Bitcoin has maintained a long-term growth structure throughout its more than 15 years of operation; however, the amplitude of fluctuations in each cycle has narrowed significantly . Early cycles recorded extremely large growth and corrections due to the small market capitalization and limited liquidity. As the network capitalization expanded and more financial institutions participated, the exponential growth gradually decreased, and corrections became less extreme.
The following charts in the appendix are divided into two main groups. The first group focuses on characterizing the four-year cycles, including the timing of peak and trough formation, correction levels, changes in Realized Cap , Realized Price , MVRV , and valuation characteristics across each cycle. The second group details each indicator that identifies market bottoms. For each indicator, the colored area on the chart represents the range of values that the indicator reached at the three confirmed bear market bottoms in 2015 , 2018, and 2022 , while the orange marker indicates the current value of the ongoing cycle.
This method allows for the assessment of the current cycle by direct comparison with historical benchmarks rather than relying on sentiment or price forecasts. If an indicator has not yet entered a zone that has appeared at every historical bottom, it indicates that the conditions for confirming a bottom have not yet been met. Conversely, when multiple indicators simultaneously converge in a historical zone, the probability of the market completing a bottoming process increases significantly.
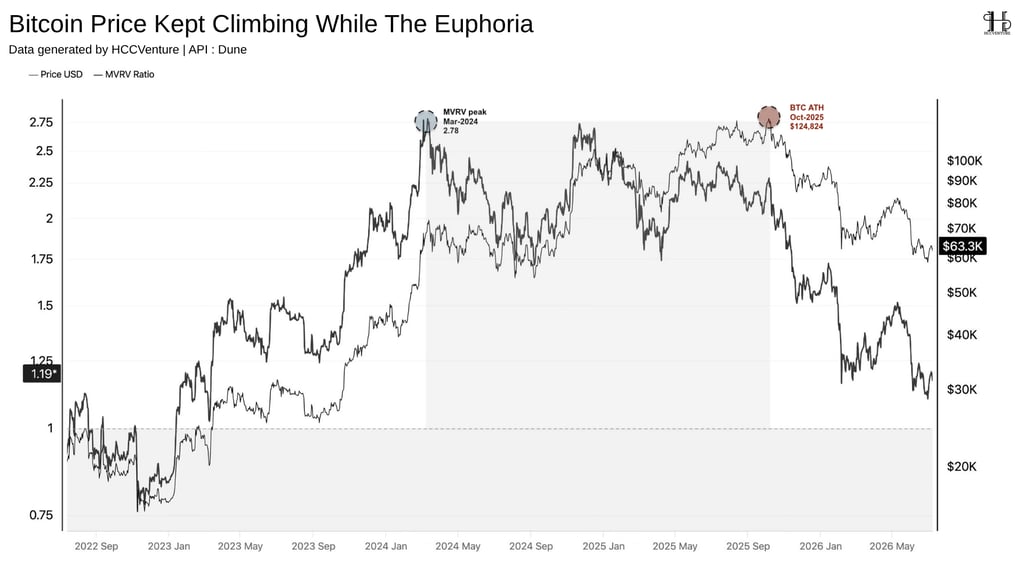
One of the most striking features of the 2022–2026 Bitcoin cycle is that price and market sentiment are no longer aligned as in previous cycles . Historically, Bitcoin's price peaks were often accompanied by extreme euphoria, evidenced by on-chain valuation indicators like the MVRV Ratio continuously expanding and setting new highs. However, the current cycle shows a completely different structure: although Bitcoin continues to rise and set a new all-time high (ATH) at $124,824 in October 2025 , market valuation peaked very early and has been steadily declining throughout the upward price movement.
The divergence between market price and the MVRV Ratio reflects a significant shift in capital flow structure. The upward momentum of the cycle is no longer driven primarily by speculative capital flows from individual investors, but is increasingly influenced by accumulation by financial institutions, Bitcoin Spot ETFs, and businesses holding Bitcoin on their balance sheets.
After March 2024, although Bitcoin continued to rise in price for the next 18 months, MVRV no longer set new highs but instead fluctuated in a downward trend. This reflects that the rate of increase of the Realized Price was nearly equivalent to the rate of increase of the market price, causing the gap between the two to narrow.
The new high price wasn't formed by an overvalued market, but primarily stemmed from a significant increase in the network's average cost of capital (Realized Price) during the same period. In other words, Bitcoin reached a higher price, but the network simultaneously absorbed a sufficiently large amount of new capital to raise the average cost of capital for all investors. This is why MVRV didn't expand despite the continued price increase.
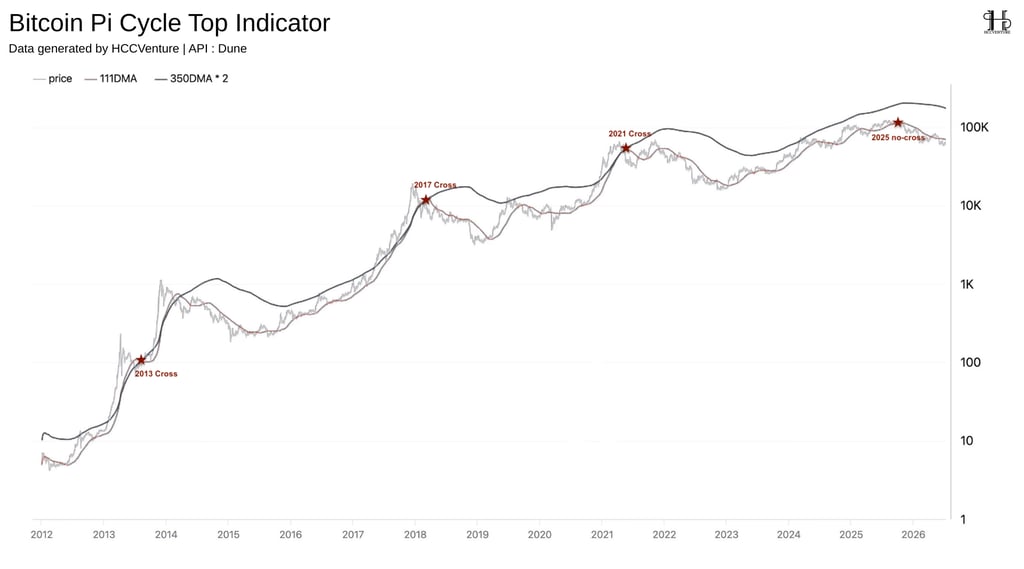
Among the indicators used to identify Bitcoin's cycle peaks, the Pi Cycle Top Indicator is considered one of the most historically reliable models. This indicator is based on the relationship between the 111-day moving average (111DMA) and the 350-day moving average doubled (2 × 350DMA) . In the three previous bull cycles, the crossover signals between the two moving averages appeared very close to the time Bitcoin established its long-term peak, making the Pi Cycle Top one of the most widely followed timing indicators in the market.
However, the 2022–2026 cycle exhibited a completely different phenomenon. Although Bitcoin reached its all-time high of approximately $124,824 in October 2025 , the two moving averages did not intersect . This was the first time since Bitcoin began forming four-year cycles that the Pi Cycle Top did not signal a market peak. This reflects a significant shift in the current cycle's movement structure and reinforces the view that market euphoria is considerably lower than in previous cycles.
The Pi Cycle Top doesn't measure absolute price but reflects the rate of expansion of an uptrend . In previous cycles, the massive influx of speculative capital caused Bitcoin's price to increase exponentially in the later stages, pushing the 111DMA up very quickly and surpassing 2 × 350DMA . Conversely, the current cycle records a slower and more stable price increase. The main capital flow comes from Bitcoin Spot ETFs , asset management institutions, and businesses holding Bitcoin, causing the uptrend to last longer but without creating the " blow-off top " acceleration seen in history. Therefore, the Pi Cycle Top's failure to signal is not due to the model becoming invalid, but because the characteristics of the current cycle differ significantly in terms of momentum structure .
Although the Pi Cycle Top has performed very well in the past, it remains a timing indicator , not a model that fully reflects the state of the entire network. The absence of a crossover signal does not mean Bitcoin has definitely not peaked or will set a new peak. In fact, previous analyses in this report have indicated that the peak of the cycle still occurs according to the four-year cycle , approximately 1,062 days after the 2022 bottom and approximately 534 days after the 2024 Halving event , almost coinciding with previous cycles.
Disclaimer : This report is produced by HCCVenture Research for informational and research purposes. All information, opinions, analysis, and assessments in this report are based on publicly available data, on-chain data, market observations, and internal research methodologies at the time of publication. The content of this report does not constitute investment advice, financial advice, legal advice, tax advice, accounting advice, or a recommendation to buy, sell, or hold any digital asset or financial instrument. HCCVenture makes reasonable efforts to ensure the accuracy and reliability of the information presented in this report. However, HCCVenture makes no representations or warranties, express or implied, regarding the completeness, accuracy, timeliness, or suitability of the information provided. The digital asset market is always highly volatile, while macroeconomic conditions, liquidity, regulations, and market developments may change after the report is published. Therefore, the information in this report may become outdated over time, and HCCVenture is under no obligation to update or revise the content after publication.
This report includes analyses based on blockchain data, market data, technical indicators, valuation models, on-chain data, and historical observations to provide a research perspective on the market. These analyses are not definitive predictions of future price movements or investment outcomes. Past performance, market cycles, and on-chain patterns are not guaranteed to repeat in the future. All assessments of market trends, scenarios, or prospects are based on reasonable assumptions at the time of research and may change significantly as market conditions change. Digital assets, including Bitcoin, Ethereum, and other cryptocurrencies, are highly volatile and inherently risky. Investors may suffer significant losses or lose their entire investment. Before making any investment decisions, readers should conduct their own independent research (DYOR – Do Your Own Research) and consult with appropriate financial, legal, tax, or investment professionals. Any investment decisions made based on the information in this report are the sole responsibility of the reader.
HCCVenture, its affiliates, research team, employees, or related parties may hold, invest in, provide advisory services to, or maintain commercial relationships with the digital assets, blockchain protocols, investment funds, exchanges, infrastructure providers, or organizations mentioned in this report. These relationships may create actual or potential conflicts of interest. HCCVenture employs internal processes to maintain objectivity and independence in its research; however, readers should consider these factors when evaluating the content of this report. Some of the data used in this report is collected from third-party data providers, including but not limited to blockchain analytics platforms, exchanges, market data providers, public APIs, and other publicly available information sources. While HCCVenture considers these data sources to be reliable, it does not independently verify all data and is not responsible for errors, omissions, or inaccuracies arising from third-party sources.
Nothing in this report is construed as an offer, solicitation, or recommendation to buy or sell securities, derivatives, investment products, or any regulated financial instruments under the regulation of any country or territory. This report may not be distributed or used in areas where such distribution would violate applicable laws. Unless otherwise stated, all views and opinions expressed in this report reflect HCCVenture Research's perspective at the time of publication and may change without prior notice. HCCVenture's subsequent publication of research reports does not imply that the views or conclusions will remain consistent over time. The entire content of this report is protected by applicable intellectual property and copyright laws. No individual or organization is permitted to copy, modify, republish, distribute, transmit, or use all or part of the report for commercial purposes in any form without the written consent of HCCVenture. Accessing, using, or referring to this report signifies that the reader understands, accepts, and agrees to all the contents of this disclaimer, and assumes full responsibility for any decisions or actions arising from the use of the information provided in this report.
Explore HCCVenture group
HCCVENTURE QUANT JSCO
© 2026 HCCVENTURE. ALL COPYRIGHTS RESERVED.


Connect with us
Popular content
Contact to us
Address: 8th Floor, Bach Dang Complex Building, 50 Bach Dang Street, Hai Chau Ward, Da Nang City, Vietnam.
Phone: 1900 1509
Gmail : sp_contact@hccventure.com
Disclaimer: The information on this website is for informational purposes only and should not be considered investment advice. We are not responsible for any risks or losses arising from investment decisions based on the content here.
TERMS AND CONDITIONS • CUSTOMER PROTECTION POLICY
ANALYTICAL AND NEWS CONTENT IS COMPILED AND PROVIDED BY EXPERTS IN THE FIELD OF DIGITAL FINANCE AND BLOCKCHAIN BELONGING TO HCCVENTURE ORGANIZATION, INCLUDING OWNERSHIP OF THE CONTENT.
RESPONSIBLE FOR MANAGING ALL CONTENT AND ANALYSIS: HCCVENTURE FOUNDER - TRUONG MINH HUY
Read warnings about scams and phishing emails — REPORT A PROBLEM WITH OUR SITE.