


Bitcoin : onchain - week 32 / 2024
Bitcoin being the "king of cryptocurrency," is not immune to this storm. The leading digital currency has experienced the most significant decline in the current cycle, causing a strong shock to short-term investors. Many of them have been forced to "throw in the towel," selling their assets at low prices. This reaction reflects the volatility of the cryptocurrency market and underscores the challenges that investors face during turbulent periods. As fear and uncertainty grip the market, the selling pressure often intensifies, leading to further price drops and a challenging environment for recovery.
8/7/20249 min read
August has witnessed a series of intense fluctuations across both the stock market and digital assets. Triggered by the phenomenon of "perfect correlation" (correlation-1), a massive wave of sell-offs swept through the entire financial market.
Bitcoin, despite being the "king of cryptocurrency," was not spared from this storm. The leading digital currency recorded the largest decline in the current cycle, creating a significant shock for short-term investors. Many of them were forced to "throw in the towel," liquidating their assets at low prices.
This situation not only reflects the increasingly close relationship between the cryptocurrency market and traditional financial markets but also highlights the high volatility of Bitcoin. This correction serves as a major test of trust and patience for the crypto community, particularly for newcomers entering the market. The current climate underscores the importance of risk management and the need for investors to remain vigilant amidst ongoing market turbulence.
Overview of the Situation
The phenomenon of "perfect correlation" has caused significant declines across various asset classes and major stocks. Bitcoin is no exception, recording its deepest drop in the current cycle.
The price contraction has pushed the spot price of Bitcoin down to the Active Investor Price level, at around $51,400. This is an important threshold that strongly influences investor sentiment.
A substantial liquidation of leverage has also occurred, with the total futures open interest falling by 11% in just one day. This development may increase the significance of on-chain data in the coming period, as market participants seek insights into price movements and investor behavior amid heightened volatility. Such data could provide a clearer understanding of market dynamics and help guide decision-making for both traders and investors.
On-chain metrics
Global Market Conditions
Widespread periods of decline in global markets are not frequent occurrences. They typically emerge during times of acute global pressure, a process of deleveraging, and increasing geopolitical risks.
On Monday, August 5, both the stock market and digital assets experienced a significant sell-off. The primary catalyst for this was the unwinding of carry trades involving the yen, leading to a reduction in leverage across markets, alongside rising U.S. Treasury yields amid recession fears.
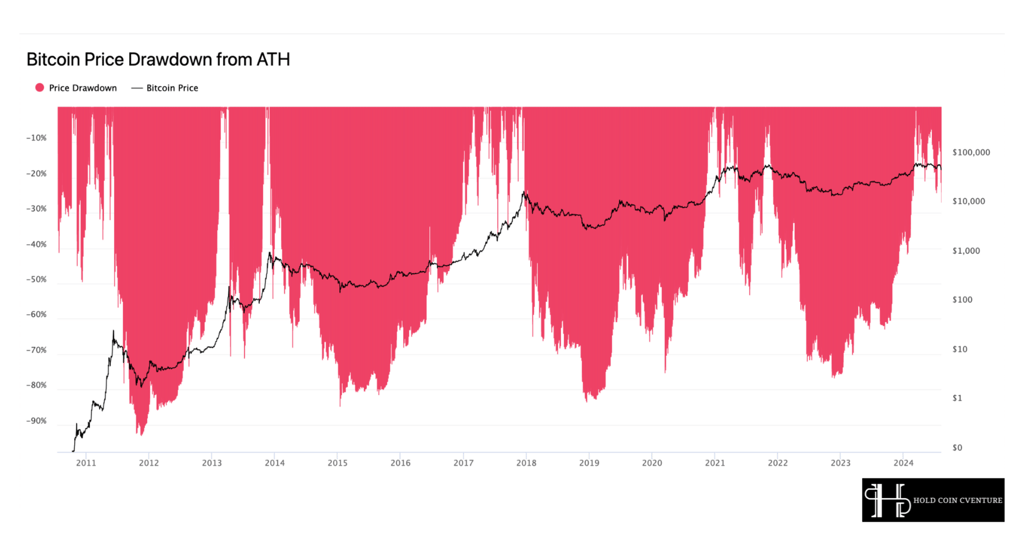
Bitcoin recorded a 32% decline from its all-time high (ATH), marking the most severe drop in the current cycle.
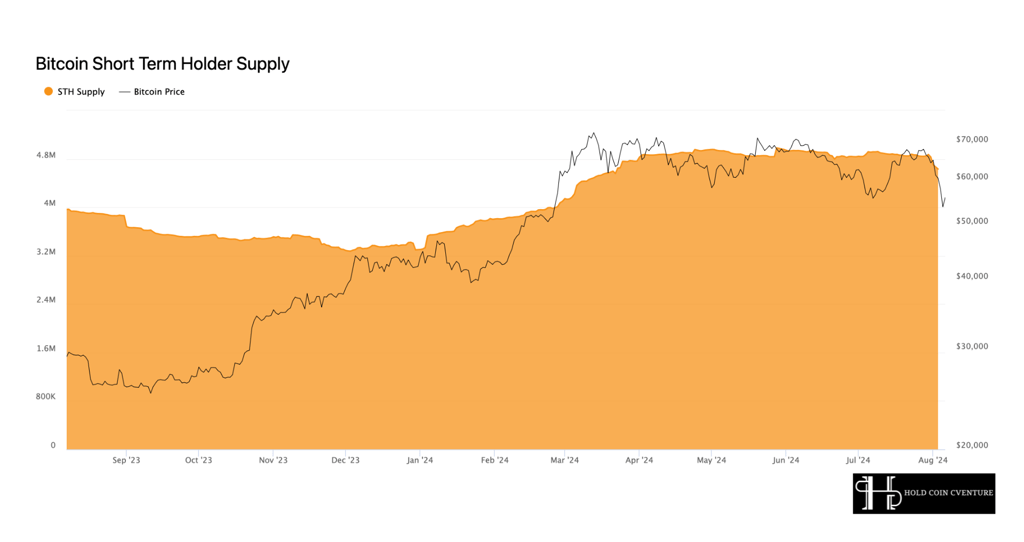
Short-Term Holder Supply
When assessing the percentage of Short-Term Holder Supply that is in profit, we find that only 7% of their holdings are currently profitable. This condition mirrors the sell-off seen in August 2023.
This figure also falls more than one standard deviation below the long-term average of this metric, indicating significant financial stress among recent buyers.
Analysis
Profitability Situation: With only 7% of short-term supply in profit, this reflects a negative market environment.
Historical Comparison: The similarity to the sell-off in August 2023 suggests a level of severity that may be comparable.
Statistical Insights: The number falling more than one standard deviation below the long-term average signals an "oversold" condition.
Financial Pressure: Recent buyers are experiencing considerable financial stress.
Outlook
This environment may lead to continued selling pressure or present buying opportunities for long-term investors. The current market dynamics highlight the need for investors to remain cautious while assessing their strategies in light of these challenging conditions. Those with a longer investment horizon may find favorable conditions to accumulate assets, whereas short-term holders may need to navigate through volatility carefully.
Currently, the Mayer Multiple is at 0.88, marking the lowest level since the collapse of the FTX exchange in late 2022.
In summary, the market is undergoing a significant correction, with Bitcoin being notably impacted. The severity of this downturn is reflected in the Mayer Multiple, indicating that the market is in an "oversold" region compared to the long-term trend. This suggests that there may be potential for recovery in the future, but investors should remain cautious and vigilant as they navigate through this volatile period.
Key On-Chain Price Levels
Shifting to the analysis of on-chain data, we can assess the severity of the sell-off by utilizing the Cost Basis of Short-Term Holders, along with bands indicating a one standard deviation decrease below this level. This method helps us evaluate the change in profitability for new investors amid significant price volatility.
Cost Basis of Short-Term Holders: $64,300
Cost Basis of Short-Term Holders - 1 Standard Deviation: $49,600
This indicates that the current market price of Bitcoin is significantly below the cost basis for short-term holders, suggesting a considerable number of investors are currently at a loss. The identification of these price levels can provide insights into potential support areas and the overall sentiment of the market, as the $49,600 level may represent a critical threshold where buying interest could increase should prices approach this range. Investors should monitor these indicators closely as they navigate the ongoing market dynamics.
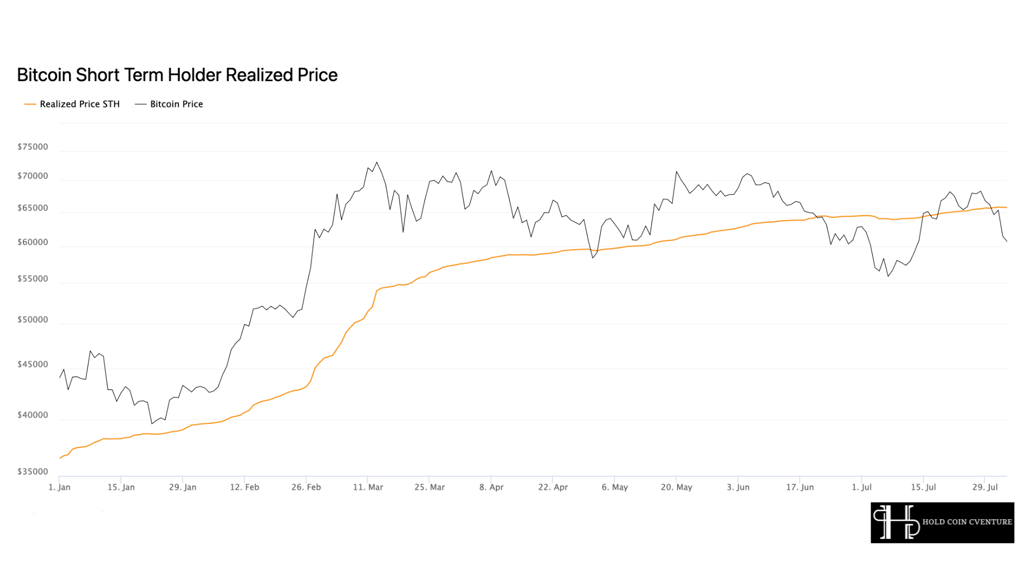
The spot price has experienced a sharp decline, nearing the one standard deviation lower band. Only 364 out of a total of 5,139 trading days (7.1%) have recorded a deviation below this price level. This underscores the rapid pace of the market's downturn.
This analysis suggests:
The current decline is quite severe, bringing prices close to historically rare lows.
Most short-term investors are facing significant losses.
The market is in an "oversold" condition according to statistical indicators.
This situation may lead to two potential scenarios: a quick recovery if strong buying pressure emerges, or an extended accumulation phase if market sentiment remains cautious. Investors should remain alert to these possibilities as they navigate the current market environment, as key buying opportunities could arise if prices stabilize, while further declines could extend the duration of losses for existing holders.
When analyzing the percentage of supply held by Short-Term Holders that are in profit, we find that only 7% of their coins are currently profitable. This situation resembles the sell-off that occurred in August 2023.
This figure also falls more than one standard deviation below the long-term average of this metric. This indicates:
There is significant financial stress among recent buyers.
There may still be substantial selling pressure from this group of investors.
The market is in an "oversold" state according to this indicator.
These insights suggest that the current market environment is challenging for short-term holders, with a potential for continued selling activity if prices do not stabilize or recover. This oversold condition may attract long-term investors looking for buying opportunities; however, the ongoing financial stress among short-term holders could complicate the near-term outlook for price recovery. Monitoring these indicators will be crucial for assessing market sentiment and potential future movements.
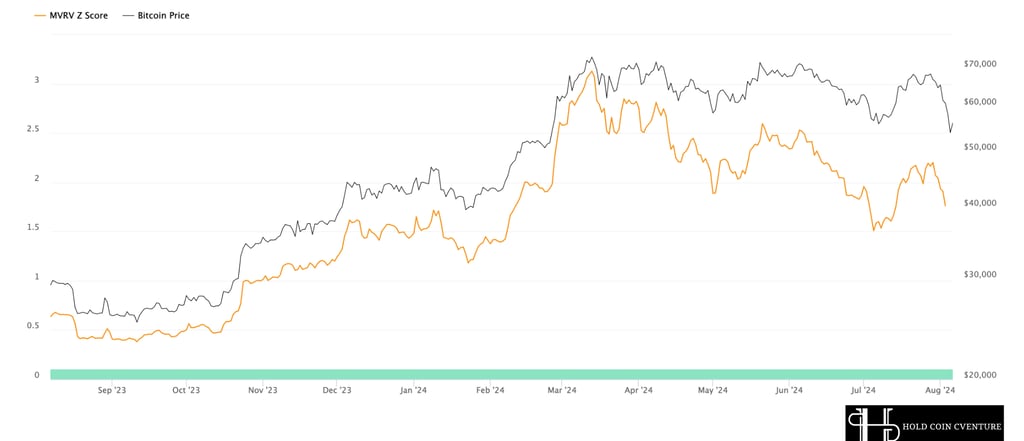
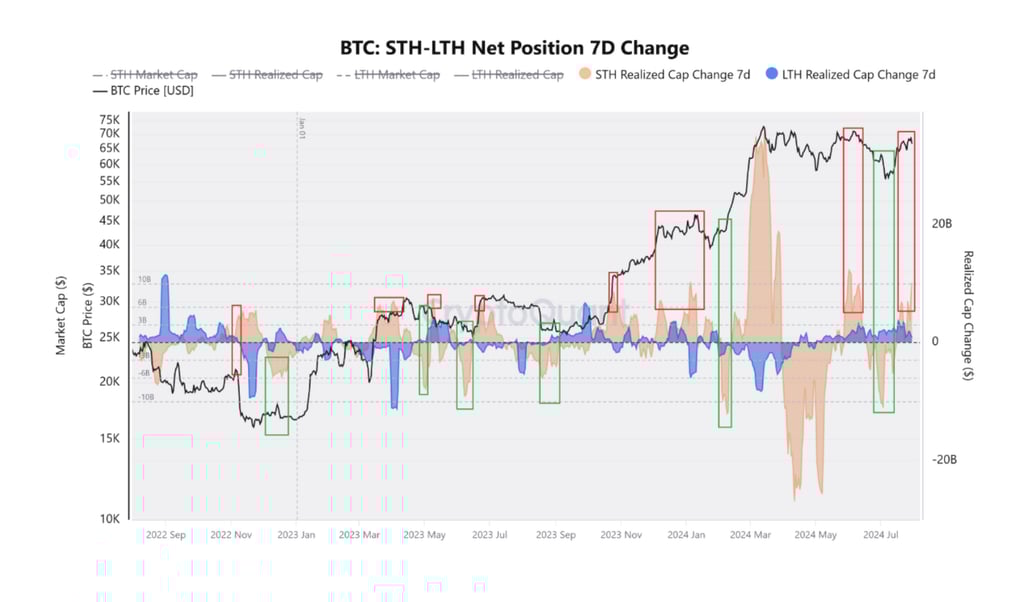
MVRV Ratio
We can also evaluate market dynamics through the Market Value to Realized Value (MVRV) ratio of Short-Term Holders. This metric measures the unrealized profit or loss for newly entered investors.
Currently, the Short-Term Holder group is experiencing the largest unrealized loss since the collapse of the FTX exchange. This further underscores the significant level of stress that investors are facing under the current market conditions.
The MVRV ratio serves as a critical indicator of investor sentiment, and the pronounced losses among short-term holders suggest a potential for continued selling pressure, which may hinder market recovery. If the market remains under stress, these unrealized losses can contribute to a cautious sentiment, leading to a prolonged period of consolidation or further declines in price until a more favorable trading environment is established. Monitoring the MVRV ratio will be essential for understanding the ongoing health of the market and assessing potential future movements.
Significant unrealized losses indicate a sharp decline in the price of Bitcoin compared to the average purchase price of this investor group.
This situation may lead to pessimism and fear among short-term investors, posing a risk of continued sell-offs.
Historically, periods when the MVRV of short-term holders drops to low levels often signal market bottoms and can lead to recovery.
However, it is important to note that there’s no guarantee this is the ultimate bottom. The market could continue to decline if additional negative factors come into play.
In summary, the MVRV ratio of Short-Term Holders is currently at a significantly low level, reflecting high stress in the market. While this could signal investment opportunities, it also necessitates caution and close monitoring of market developments in the near future. Investors should remain vigilant to potential changes in sentiment and market conditions that could impact the price of Bitcoin.
Bitcoin : Mayer Multiple
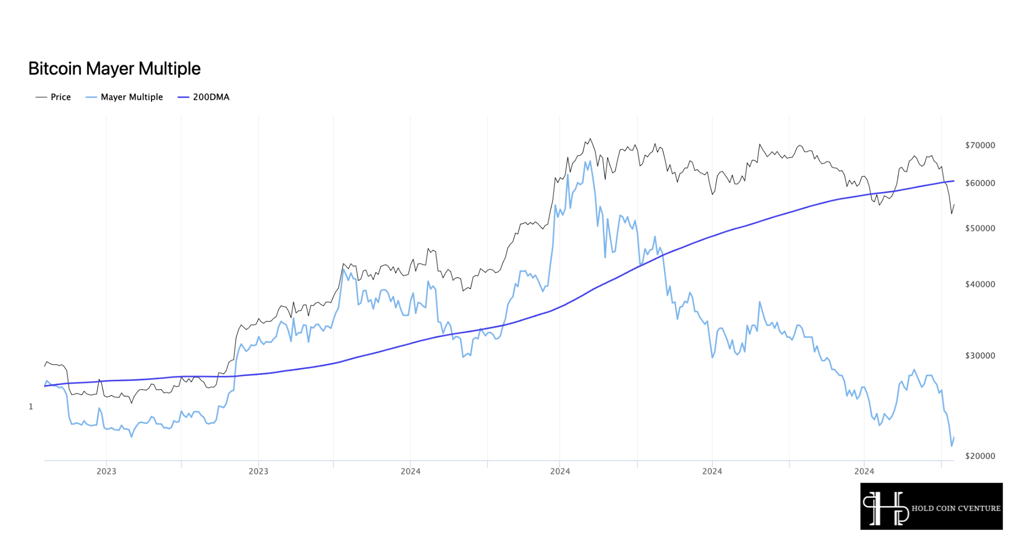
To assess the severity of the current price decline, we can utilize the Mayer Multiple, a widely recognized analytical tool. This index is the ratio of the current price to the 200-day moving average (200DMA).
The 200DMA is commonly regarded by traders and investors as a boundary that separates bullish market conditions from bearish ones. Currently, the Mayer Multiple stands at 0.88, which is the lowest level since the collapse of the FTX exchange in late 2022.
Mayer Multiple:
When > 1: Price is above the 200DMA, indicating a bullish market trend.
When < 1: Price is below the 200DMA, indicating a bearish market trend.
The current level of 0.88 suggests that the market is in a strong "oversold" condition. This information highlights the significant downward pressure on prices, and it may also signify potential recovery opportunities if market sentiment shifts positively. Investors should monitor these indicators closely to gauge future price movements and overall market dynamics.
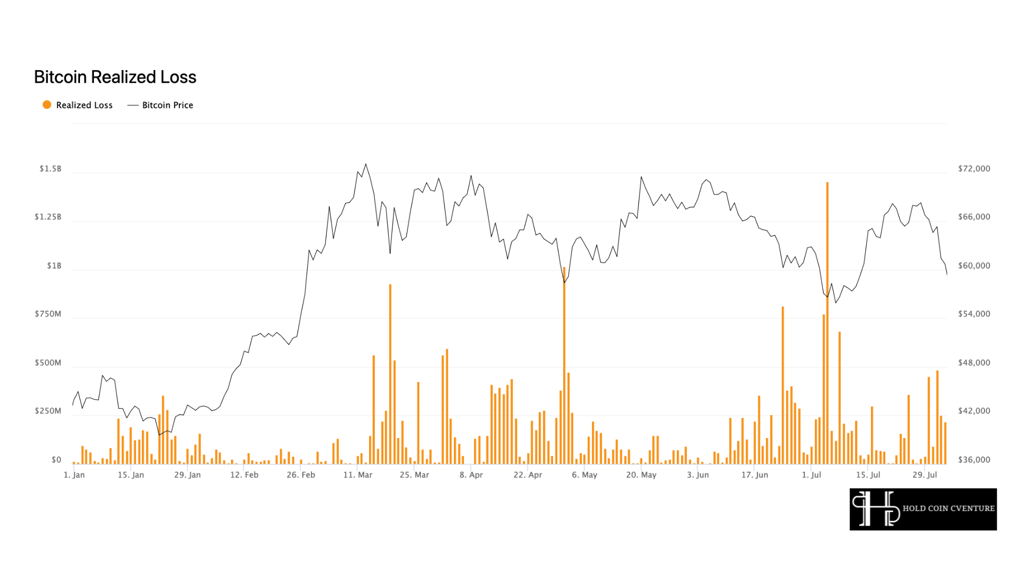
Surge in Realized Losses
In the previous section, we assessed the market's position relative to levels at which investors may experience significant financial pressure. The next step is to evaluate investor reactions by analyzing the extent of realized losses recorded during this event.
The sell-off triggered a wave of panic among investors, resulting in approximately $1.38 billion in realized losses by market participants. In absolute terms, this marks the 13th largest event in history when measured in USD.
In-Depth Analysis:
Severity Level: The $1.38 billion in realized losses ranks as the 13th largest event in history, indicating a high level of panic among investors.
Market Sentiment: Many investors are cutting their losses, which may lead to a short-term pessimistic outlook.
Cycle Implications: This event could potentially mark near the end of the current downturn.
Opportunities and Risks: This situation presents potential opportunities for long-term investors looking to enter the market at lower prices.
Structural Impact: The event may facilitate a transfer of assets from "weak hands" (those forced to sell due to losses) to "strong hands" (long-term holders who can withstand price fluctuations).
Analysis:
Uneven Impact: Short-Term Holders bear the greatest burden from the current market downturn.
Investor Behavior: Long-Term Holders are less likely to sell during periods of market fluctuations.
Market Sentiment: The prevailing sentiment reflects a panic largely coming from new and short-term investors.
Implications for Analysis: It is essential to focus on the movements and actions of the Short-Term Holder group to predict market trends.
Outlook: The stability of the Long-Term Holder group can serve as a foundation for future recovery in the market.
To better understand the impact of the recent sell-off, we can categorize the realized losses between Short-Term Holders and Long-Term Holders to determine which group has been most affected.
Notably, 97% of the total losses can be attributed to Short-Term Holders, while the Long-Term Holder group remains relatively insulated from the impact.
Given this significant disparity, we will focus on the Short-Term Holder group as the central point for analyzing losses moving forward.
Conclusion:
Market Volatility: August witnessed significant fluctuations across both the stock market and digital assets, with the "correlation-1" event triggering strong sell-offs.
Sharp Decline in Bitcoin: Bitcoin recorded its largest drop (-32%) from its cycle peak, leading to considerable capitulation among Short-Term Holders.
Impact from Derivatives Market: Liquidations of futures contracts amounting to over $365 million resulted in a significant reduction in open interest.
Deleveraging: This event has led to a substantial decrease in leverage across the market.
Analytical Outlook: On-chain data and spot market trends will become increasingly important for assessing the potential for recovery in the coming weeks.
Note: This report does not constitute investment advice. The data presented is for informational and educational purposes only. Readers are fully responsible for their investment decisions.
Join the HCCVenture community to get the latest market information. Once again, we give our opinion on potential projects in the crypto market. This is not investment advice, consider your portfolio. Disclaimer: The views expressed in this article are solely those of the author and do not represent the platform in any way. This article is not intended to be a guide to making investment decisions.
API & Data : Glassnode
Compiled and analyzed by HCCVenture
Join our telegram community: HCCVenture
Explore HCCVenture group
HCCVenture © 2023. All rights reserved.


Connect with us
Popular content
Contact to us
E-mail : sp_contact@hccventure.com
Register : https://linktr.ee/holdcoincventure
Disclaimer: The information on this website is for informational purposes only and should not be considered investment advice. We are not responsible for any risks or losses arising from investment decisions based on the content here.
TERMS AND CONDITIONS • CUSTOMER PROTECTION POLICY
ANALYTICAL AND NEWS CONTENT IS COMPILED AND PROVIDED BY EXPERTS IN THE FIELD OF DIGITAL FINANCE AND BLOCKCHAIN BELONGING TO HCCVENTURE ORGANIZATION, INCLUDING OWNERSHIP OF THE CONTENT.
RESPONSIBLE FOR MANAGING ALL CONTENT AND ANALYSIS: HCCVENTURE FOUNDER - TRUONG MINH HUY
Read warnings about scams and phishing emails — REPORT A PROBLEM WITH OUR SITE.