


Analysis of the Bittensor Network (TAO) after the first Halving
Bittensor is operating in a state of controlled growth, characterized by the convergence of capital and resources into high-performing entities.
INSIGHTS
3/23/202616 min read
The context after Bittensor's Halving
Bittensor is in sync with major developments in the AI and blockchain market. The explosion of the “AI x Crypto” narrative in the 2024–2026 period has attracted significant capital into decentralized AI infrastructure projects, with Bittensor playing a leading role as one of the pioneering protocols.
Updates such as the Dynamic TAO (dTAO) upgrade , the expansion of the subnet system, and the increase in the number of validators and developers have strengthened the network's technological foundation. Simultaneously, the participation of large institutions and entities (including exchanges and infrastructure providers) has enhanced the liquidity and reliability of the ecosystem.
The amount of TAO locked through staking and recycling is increasing, while the free-circulating supply is relatively decreasing. This is a core factor creating low supply pressure – a necessary condition for long-term price growth. On the other hand, subnet activity, validator participation, and the recycle mechanism show that the demand for network usage is genuine, not simulated. Bittensor is not just a financial asset but also an infrastructure with clear utility in the AI field.
The simultaneous emergence of retail (via new accounts) and smart money (via large staking wallets and validator dominance) creates a balanced cash flow structure, where large capital flows play a leading role, while retail provides supplementary liquidity. However, the ecosystem is also facing a crucial characteristic: a high degree of concentration . Staking power, subnet activity, and capital flows are all concentrated in a few large entities. While this optimizes performance, it simultaneously reduces decentralization – a core element of blockchain.
Is the network token still blue-chip AI ?
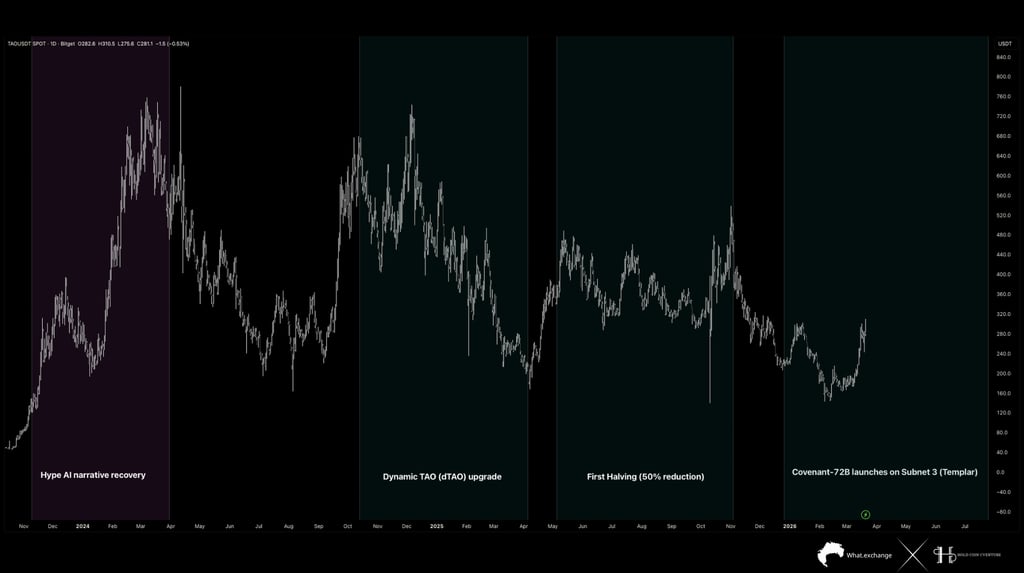
In the initial phase, from late 2023 to Q1 2024, the price of TAO experienced a strong surge, taking the asset from below $100 to a peak of nearly $700–750, equivalent to an increase of more than seven times. This surge coincided with the "AI narrative recovery" wave, as speculative capital and technological expectations focused heavily on projects related to artificial intelligence.
In the initial phase, from late 2023 to Q1 2024, the price of TAO experienced a strong surge, taking the asset from below $100 to a peak of nearly $700–750, equivalent to an increase of more than seven times. This surge coincided with the "AI narrative recovery" wave, as speculative capital and technological expectations focused heavily on projects related to artificial intelligence.
Notably, the Bitcoin halving event (reducing the block reward by 50%) in 2024–2025, which was generally expected to be a positive catalyst, did not create a sustainable upward trend for TAO. Instead, the price continued to weaken and formed a lower high – lower low structure, indicating a misalignment between the individual narrative and the overall liquidity cycle.
When placing TAO within the broader on-chain context of the crypto market, it can be seen that the asset is moving in sync with a “post-bubble compression” structure – the post-bubble phase where previously strong narratives undergo deep corrections and require time to accumulate again. This is similar to the current state of Bitcoin, where the SOPR of short-term investors remains below 1, volatility is decreasing, and the market is entering an accumulation phase.
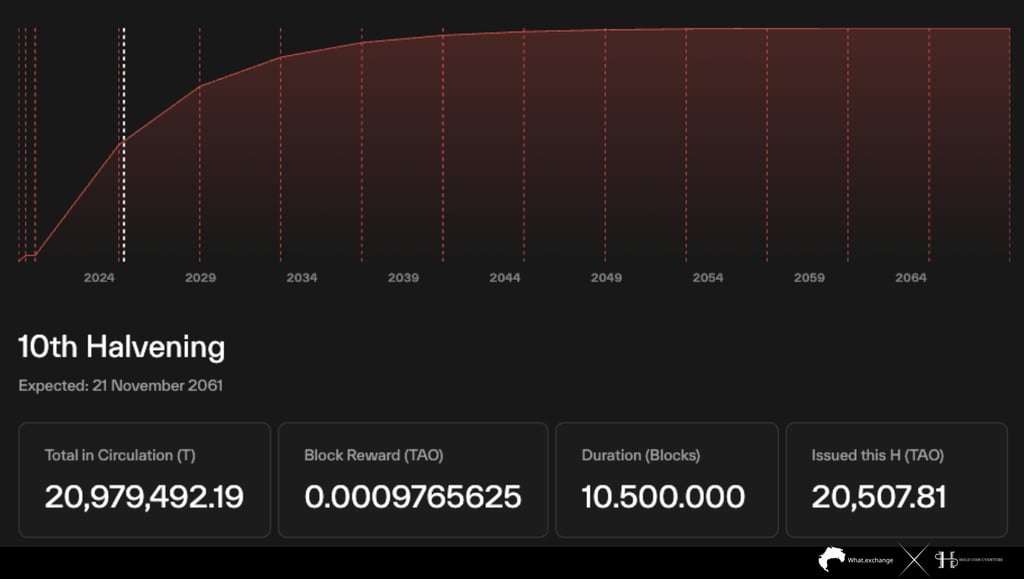
With the current circulating supply at approximately 20.98 million TAO , the system is very close to supply saturation, with the majority of tokens already issued to the market. The current block reward has decreased to ~0.000976 TAO/block , reflecting that the rate of new issuance has entered a sharp decline, in line with the cyclical deflationary design.
This structure suggests that TAO is shifting from an inflationary phase asset to a near- disinflationary state , similar to the post-deep halving phases of Bitcoin. Compared to the early phase when block rewards were high, the current rate of supply increase has slowed to near zero over time, significantly reducing selling pressure from miners or validators.
Compared to Bitcoin, where the total maximum supply is 21 million BTC, TAO is in a similar position after multiple halvings, with over 90% of the supply already released. In this context, price dynamics no longer depend on strong "supply shocks" like in the early stages, but instead rely primarily on market demand and the actual usage of the network .
One notable point is that the amount of tokens issued in each halving cycle is currently only around 20,500 TAO , a very small number compared to the total supply of nearly 21 million. This means that selling pressure from the new supply is no longer a dominant factor influencing the price. In previous crypto cycles, when the new issuance fell below a certain threshold, price fluctuations often became more sensitive to external capital flows rather than internal supply factors.
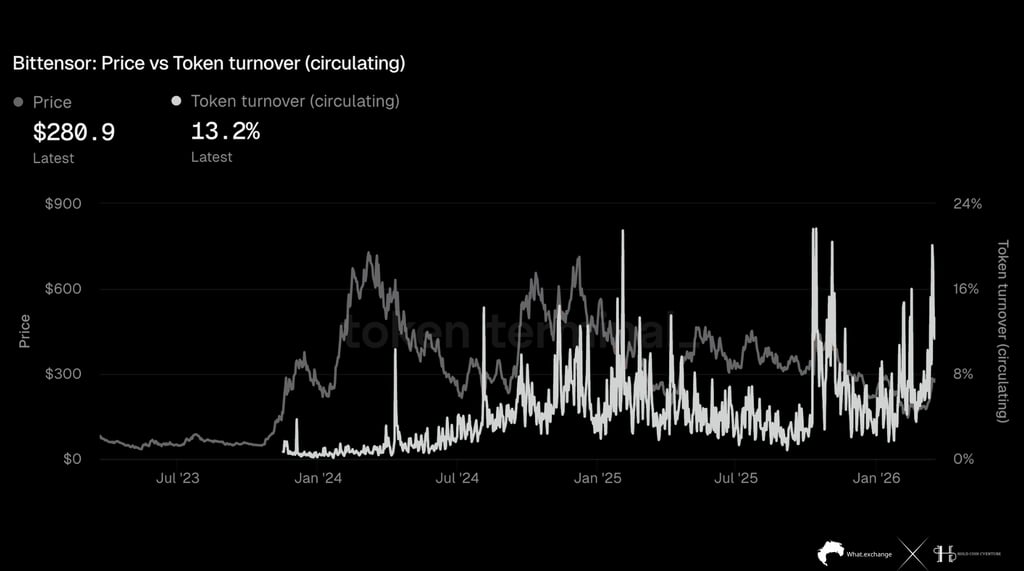
Token turnover (circulating) measures the percentage of supply traded within a given timeframe. A high turnover indicates increased trading activity and liquidity, often accompanied by periods of significant price volatility. Conversely, a decrease in turnover suggests the market is entering an accumulation phase, where supply is held by long-term investors.
During the strong growth phase in early 2024, when the price of TAO rose from below $100 to a peak of around $700, token turnover remained low to medium, reflecting a state of accumulation and holding, where the supply was not constantly being rotated. This is typical of sustainable growth phases, where demand exceeds supply and investors tend to hold the asset rather than trade it.
Conversely, at local peaks and distribution phases, token turnover spikes, often exceeding 15–20% , coinciding with price peaks or corrections. This reflects a sharp increase in profit-taking and distribution activity, as supply is released back into the market at a rapid pace.
In its current state, the turnover rate of approximately 13.2% indicates that the market is in an intermediate zone between accumulation and distribution. Compared to the lowest point during the previous accumulation phase (<5%), the current turnover is significantly higher, suggesting that liquidity has returned and trading activity is increasing. However, compared to the distribution peaks (>20%), the current level has not yet reached an extreme threshold, reflecting that selling pressure is not yet systemic.
Comparing the peak turnover (~20%+) with the current level (~13%), it's clear the market still has considerable room to go before entering an extreme distribution phase. At the same time, compared to the lowest point (~2–3%), the current turnover is significantly higher, confirming that the market has moved out of a passive accumulation phase and into a more active state.
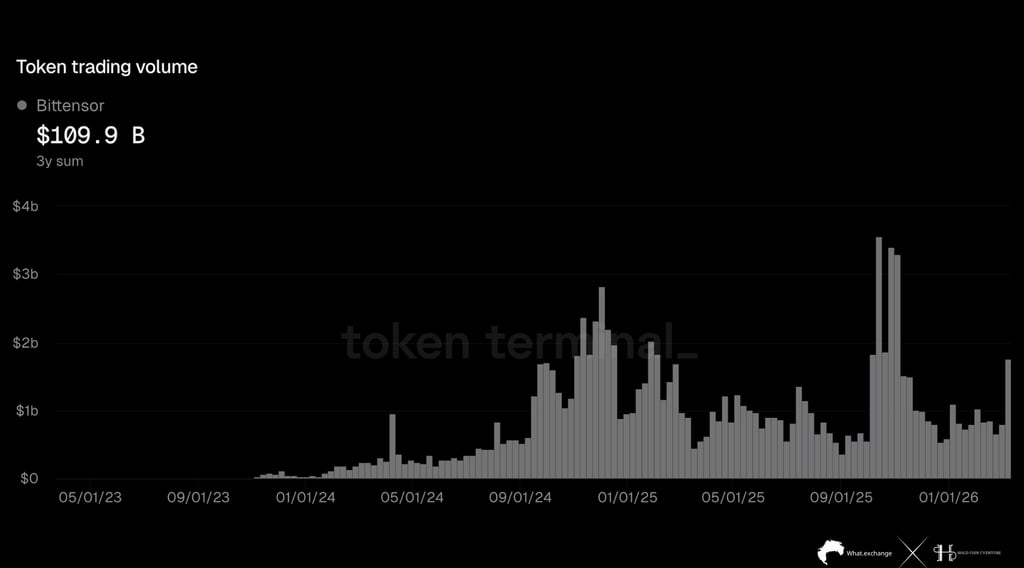
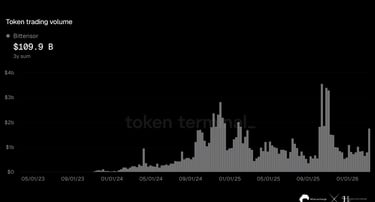
Time series analysis reveals a clear upward trend in trading volume since the beginning of 2024, as TAO's market structure shifted from a low-liquidity phase to a strong expansion phase. In the initial phase (2023), trading volume remained very low, almost negligible, reflecting an inefficient market with limited participation. This is typical of new assets, where prices are easily manipulated by large orders due to a lack of liquidity depth.
Currently, trading volume remains at a historically high average level, although lower than previous peaks. Compared to past lows (<100 million USD), current liquidity is significantly higher, confirming that the market has moved out of a "thin market" and into a structure capable of absorbing larger capital flows. At the same time, compared to historical peaks (>3 billion USD), the current volume indicates that the market has not yet entered a period of extreme euphoria, but is in a state of equilibrium.
A crucial quantitative point is the relationship between volume and price trends. During sustained growth phases, volume tends to increase steadily, reflecting new money entering the market. Conversely, in distribution phases, volume often spikes but cannot sustain, accompanied by price weakness. Current data suggests that volume remains stable rather than experiencing extreme spikes, implying that the market is in a re-accumulation phase with supportive liquidity , rather than a large-scale distribution phase.
A crucial quantitative point is the relationship between volume and price trends. During sustained growth phases, volume tends to increase steadily, reflecting new money entering the market. Conversely, in distribution phases, volume often spikes but cannot sustain, accompanied by price weakness. Current data suggests that volume remains stable rather than experiencing extreme spikes, implying that the market is in a re-accumulation phase with supportive liquidity , rather than a large-scale distribution phase.
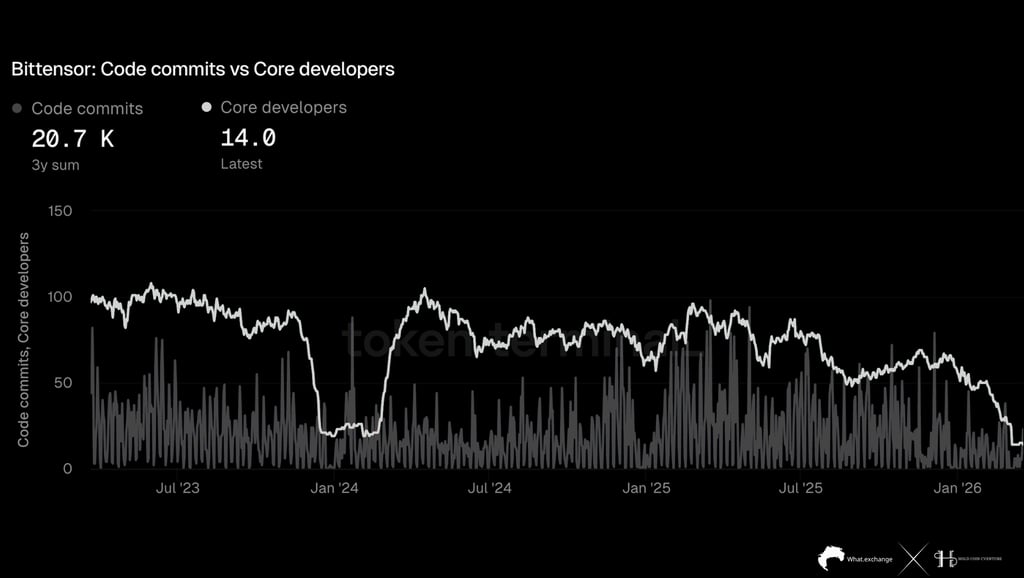
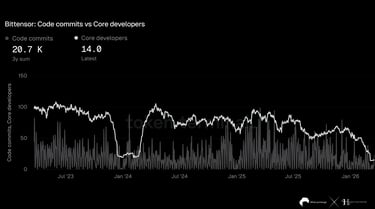
The number of commits reflects the intensity of development activity, while the number of core developers represents the capacity to maintain and scale the system. A sustainable ecosystem typically requires stability or growth in both of these variables, because commits can fluctuate cyclically, but the developer workforce is the decisive factor in maintaining technological innovation.
Notably, after the decline in 2023, the number of developers recovered to around 80–100 in the first half of 2024, coinciding with TAO entering a strong price growth phase. This demonstrates a positive correlation between development activity and market expectations, as the return of capital and attention led to an increase in technical resources.
Compared to past peaks (~100 developers), the current level (~14) represents a decline of over 85% in the core development workforce. This is a significant quantitative change, because in crypto valuation models based on fundamentals, the number of developers is often seen as a proxy for the project's "intellectual capital." A sharp decline in this variable is often associated with the risk of slowing innovation and limiting the ecosystem's scalability.
However, it's worth noting that commit activity hasn't dropped to extremely low levels, but remains consistent, indicating that the rest of the team is still developing the product. This implies that the project hasn't entered a state of "development stagnation," but is transitioning to a leaner structure. In some cases, a reduction in the number of developers may reflect organizational optimization, where ineffective contributors are eliminated, rather than a general decline.
However, it's worth noting that commit activity hasn't dropped to extremely low levels, but remains consistent, indicating that the rest of the team is still developing the product. This implies that the project hasn't entered a state of " development stagnation ," but is transitioning to a leaner structure. In some cases, a reduction in the number of developers may reflect organizational optimization, where ineffective contributors are eliminated, rather than a general decline.
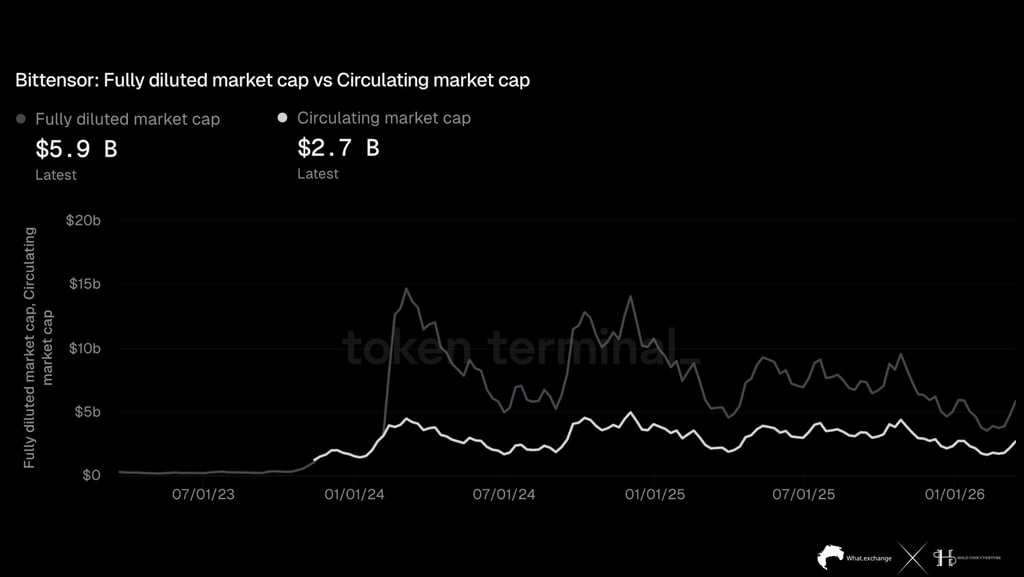
When TAO entered a strong growth phase, FDV surged to a peak of around $14–15 billion , while outstanding capital reached approximately $4–5 billion . The large gap between these two lines during that period reflected extremely high market expectations, where future valuations were pushed up faster than the actual value of outstanding supply. This is typical of speculative growth phases, where narrative (AI, decentralized computing) plays a dominant role.
In its current state, the FDV/Circulating ratio of approximately 2.2x reflects a more balanced valuation compared to the peak. Compared to past lows, when both indicators were nearly equal (low liquidity period), the current structure suggests the market has developed sufficiently to form long-term expectations, but is no longer in an extreme "overpricing" state. Simultaneously, compared to the peak (~3–4x during the peak period), the current level is significantly lower, confirming that most of the dilution risk has been absorbed by the market.
Compared to previous cycles, the current structure is similar to the post-correction phase, where assets have undergone "price discovery" and eliminated much of the irrational valuation. In this context, FDV no longer serves as a risk warning indicator, but rather reflects long-term growth potential if the ecosystem continues to expand.
Subnets are operating at maximum capacity
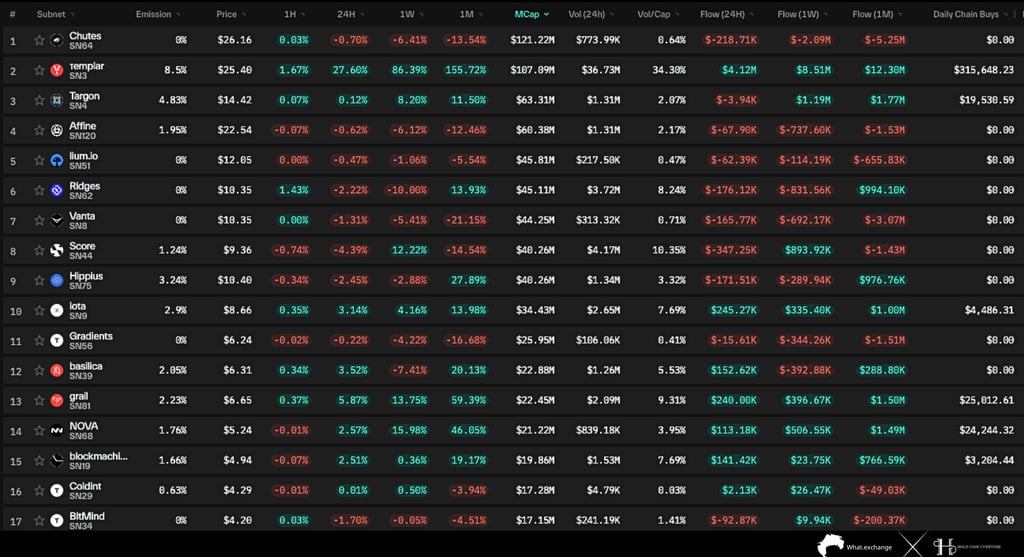
Currently, the market structure shows a clear divergence between leading subnets and the rest. Subnets like Chutes (SN64) and Templar (SN3) account for the largest share of market capitalization, with market caps of approximately $121 million and $107 million respectively . However, the notable difference lies in the cash flow. While Chutes recorded negative net cash flow in the 24-hour (-$218,000), 7-day (-$2.09 million), and 1-month (-$5.25 million) timeframes, Templar attracted strong capital inflows of +$4.12 million (24h), +$8.51 million (1W), and +$12.3 million (1M) . This reflects a structural shift in cash flow, where capital rotation is occurring from "older" subnets to those with higher narrative or performance.
At the middle level, subnets like Targon, Score, Hippius, and Iota show a more balanced state, with inflows and outflows not exhibiting extreme patterns. However, even within this group, divergence exists, with some subnets recording positive short-term but negative medium-term inflows, indicating short-term speculative capital flows rather than sustainable accumulation.
Compared to the previous phase, the current structure shows the maturity of the Bittensor ecosystem, where capital flows are no longer evenly distributed but are becoming selective based on performance and narrative. This is a significant shift from "broad speculation" to "selective capital allocation," similar to DeFi or Layer-1 ecosystems in previous cycles.
Notably, the overall flow of funds across subnets does not show a complete decline, but rather reflects an internal reallocation process . Funds withdrawn from some subnets are being reinvested in others, rather than leaving the ecosystem entirely. This implies that confidence in Bittensor remains, but the market is becoming more efficient in valuation and capital allocation.
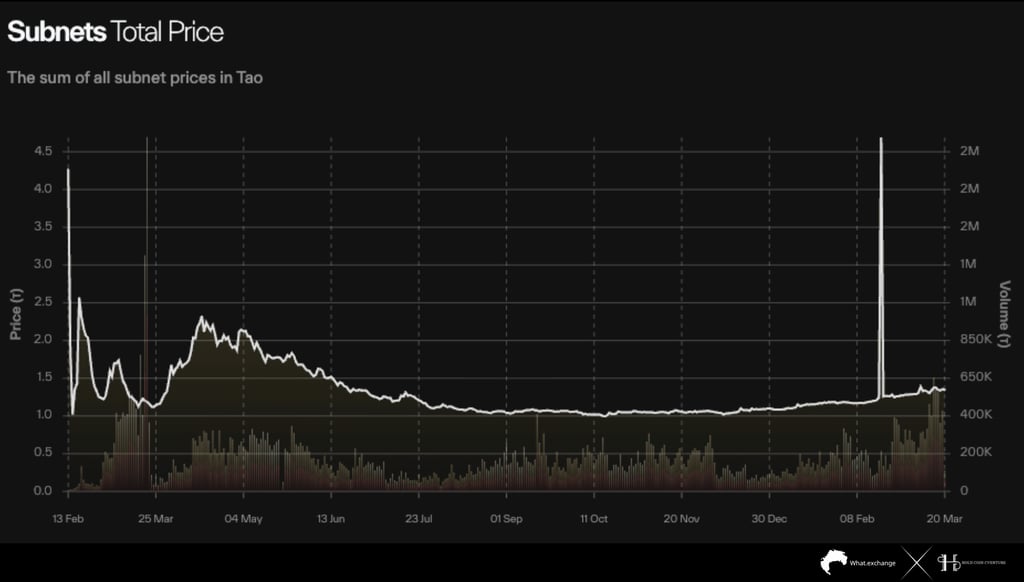
Observations of the data show that in the initial phase (February–March), the total subnet price fluctuated sharply with large amplitudes, peaking at approximately 4.5 TAO before quickly correcting to the 1.0–1.2 TAO range . This is typical of the initial market formation phase, when liquidity is low and prices are easily influenced by large capital flows. Compared to the lowest level after the correction (~1.0 TAO), the initial peak was more than four times higher , reflecting the degree of overextension in the early stages of the cycle.
Entering the mid-year period (Q2–Q3), the total subnet price formed a prolonged downward trend, gradually descending from around 2.0 TAO to a low of around 1.0 TAO. This period represents a "mean reversion" – where the market adjusts from a highly valued state to a more balanced level. Notably, trading volume gradually decreased during this period, indicating a weakening of speculative capital flows and a withdrawal of short-term liquidity.
However, since the end of last year, the market structure has begun to change. The total subnet price has remained stable around ~1.0–1.2 TAO , then gradually formed a slight upward trend to ~1.3–1.4 TAO . The important thing is not the absolute increase, but the stability of the price base – a signal that the market has completed its correction and entered an accumulation phase.
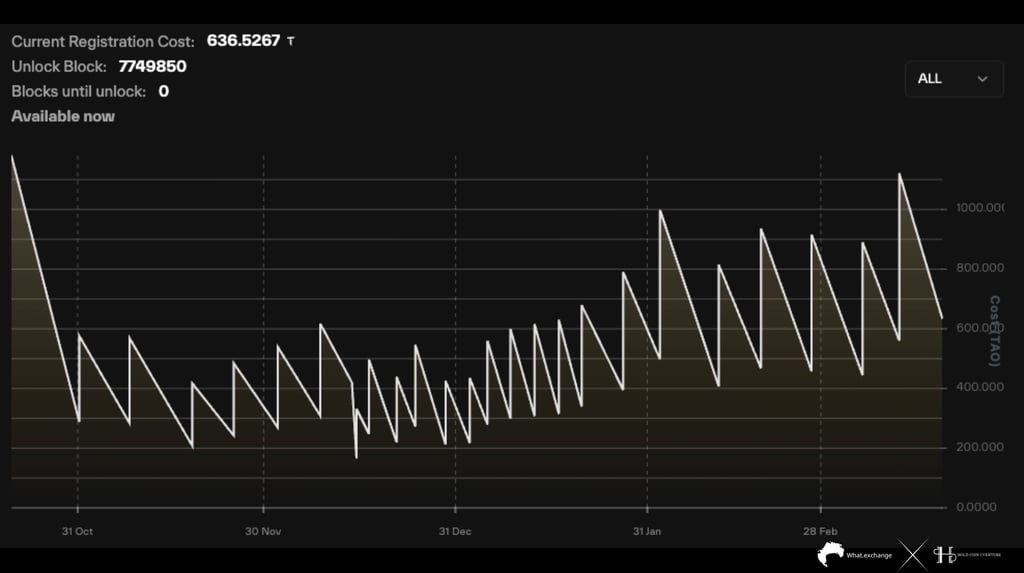
Currently, the subscription cost is around ~636.5 TAO , which is in the upper end of the recent price range and reflects increased competition for network membership. Structurally, the graph shows a "sawtooth" oscillation pattern, where the cost gradually increases over time before resetting to a lower level, then continuing a new upward cycle. This is not random fluctuation, but rather a consequence of a dynamic pricing mechanism, where the subscription cost reacts directly to subnet participation demand. When demand increases, the cost is pushed up; when demand is absorbed or decreases, the cost adjusts downward before entering a new cycle.
Historical data analysis shows that in the latter part of last year, registration costs mainly fluctuated in the range of ~200–500 TAO , with local peaks rarely exceeding 600 TAO. This was a period of moderate demand, reflecting an ecosystem in its formative stages. However, in recent times, cost peaks have consistently expanded, repeatedly exceeding 800–1000 TAO , indicating a significant increase in demand for network membership.
One notable point is that the range of price fluctuations is widening over time. While previously each fluctuation cycle lasted only a narrow range, now the upward cycles are longer and reach higher peaks. This reflects that demand pressure is not only increasing in scale but also sustaining for longer periods, indicating the sustainability of demand rather than short-term spikes.
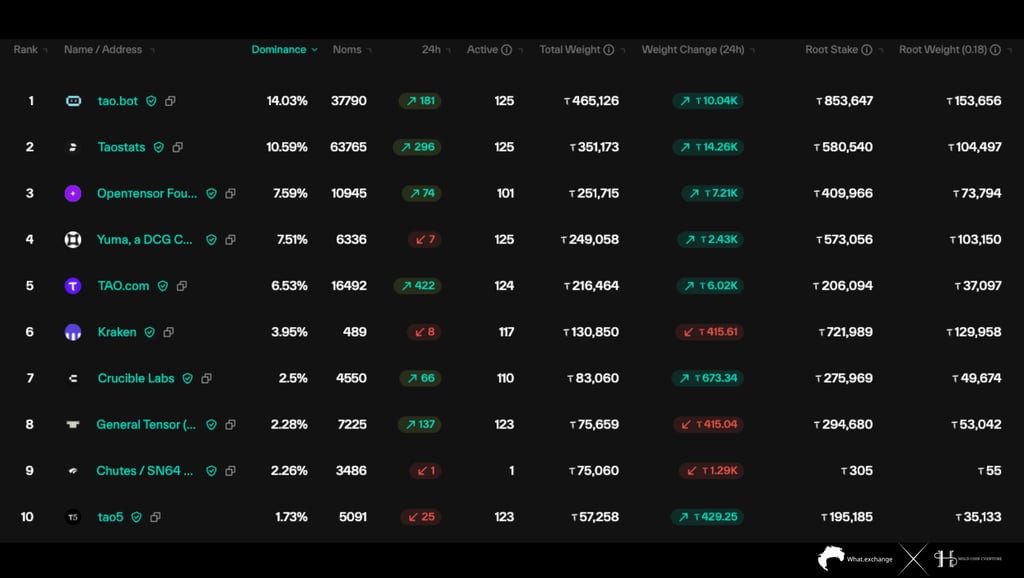
Based on the current data, it is clear that the ecosystem is operating in a relatively highly concentrated state, with a small group of entities controlling the majority of the network weight. Specifically, the leading validator is tao.bot , accounting for approximately 14.03% dominance , equivalent to over 465,000 TAO total weight , followed by Taostats (10.59%) , Opentensor Foundation (~7.59%) , and Yuma (~7.51%) .
The four largest entities alone control over ~40% of the total network weight , while the top 10 validators account for the majority of the staking liquidity. This is a significant level of concentration compared to mature decentralized networks, where power is typically more evenly distributed.
From a quantitative perspective, this concentration is reinforced by the net staking weight change over the past 24 hours. Most large validators recorded an increase in weight, with significant gains seen in Taostats (+14.26K TAO) , tao.bot (+10.04K TAO) , and TAO.com (+6.02K TAO) . This indicates that new capital is continuing to flow into established entities, rather than being allocated to smaller validators. This is typical of the "rich-get-richer" phenomenon in staking systems, where performance and historical prestige attract additional capital.
Notably, the number of "Noms" (delegators) of major validators is also high (e.g., Taostats ~63,765, tao.bot ~37,790), indicating that community trust is concentrated in a few entities. This further reinforces the centralized structure, as capital flows not only from institutions but also from retail.
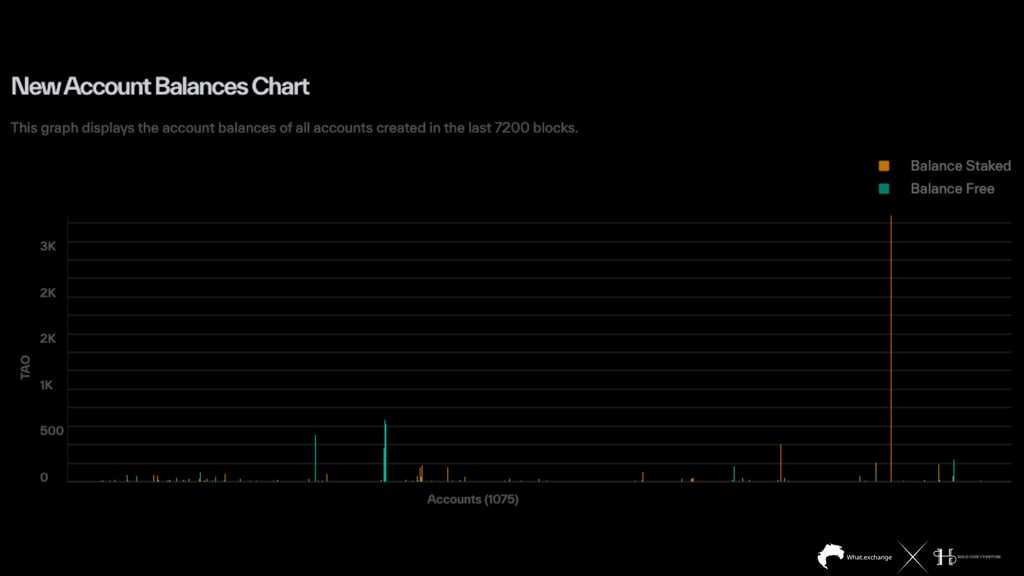
Direct observation from data distribution reveals a total of approximately 1,075 new accounts , with the majority having very small capital sizes, ranging from under 50–100 TAO . However, the notable point is the emergence of large-scale outliers, particularly some accounts with staked balances exceeding ~3,000 TAO , along with many groups of accounts in the 300–600 TAO range . This indicates that the new capital inflow is not purely from small retail investors, but shows clear participation from large-scale entities at the time of entry.
Considering the distribution structure between staked balance (blue) and free balance (red) , a clear dominance of staking is evident from the outset. The majority of accounts tend to directly transfer assets into staked status rather than keeping them as free balance. This is a significant indicator, reflecting long-term investment behavior and a focus on participating in the consensus mechanism and exploiting the network's yield, rather than short-term speculation.
Compared to the early stages of the ecosystem (when most new accounts tended to have a higher free balance), the current structure shows a clear maturation of the cash flow. New investors not only participate but also understand the staking mechanism and its role in optimizing returns. This aligns with the general trend of proof-of-stake networks entering a stable growth phase.
Notably, the appearance of accounts with large stakes at the time of wallet creation suggests that this is likely not entirely new capital, but rather a reallocation of funds from existing wallets or from larger entities becoming more deeply involved in the network. This further reinforces the argument that smart money is increasing its commitment to Bittensor.
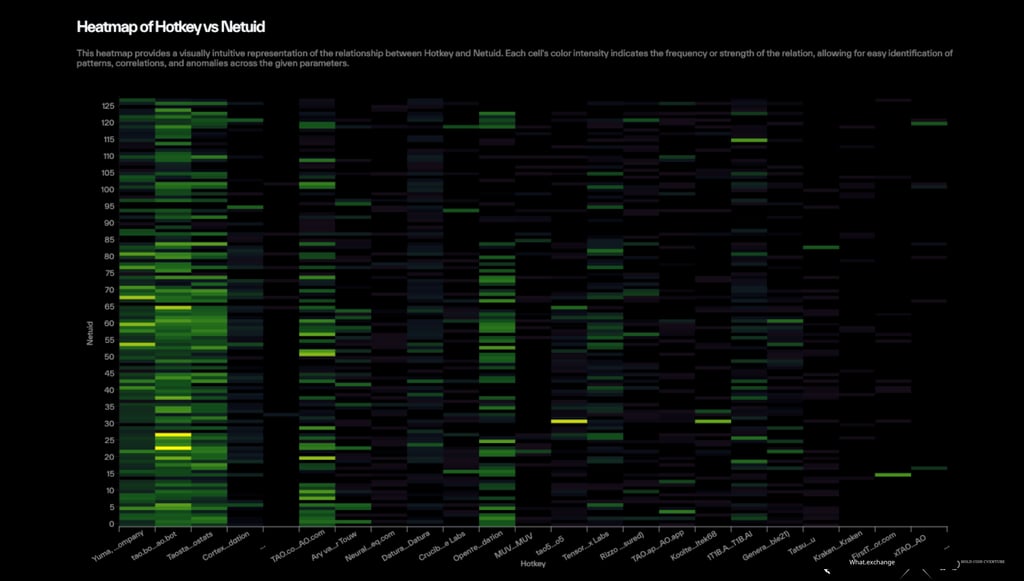
Overall, the heatmap shows a strong concentration of color around several major hotkeys such as Yuma, tao.bot, Taostats, and Opentensor Foundation , spanning across multiple netuid. The high color intensity (especially in the deep purple and deep blue regions) reflects the high frequency or level of interaction between these validators and multiple subnets, suggesting they act as "liquidity hubs" and "processing centers" within the network. This aligns with previous staking data, which also showed these entities to be the most dominant validators.
Conversely, the majority of the remaining hotkeys exhibit a lighter color density and a more dispersed distribution, indicating limited and uneven participation across subnets. This reflects a distinctly hierarchical network structure: a small group of validators operate across multiple subnets with high intensity, while the rest focus on only a few subnets or operate on a smaller scale.
Looking at the network hierarchy (netuid), subnets with medium IDs (around 20–80) show higher activity levels, with the simultaneous participation of many large hotkeys. This indicates that these subnets are playing a central role in the ecosystem, possibly related to key use cases or highly applicable AI/ML models. Conversely, subnets at the edge (low or very high IDs) have lower activity densities, reflecting an early stage of development or limited access to capital and resources.
Quantitatively, when compared with the analyzed staking and dominance data, a strong correlation can be seen between market share (stake) and activity share (heatmap intensity) . Validators holding more stakes are also the entities with the highest activity levels across multiple subnets. This is a self-reinforcing system, where larger stakes lead to more opportunities for activity, thereby attracting even more stakes.
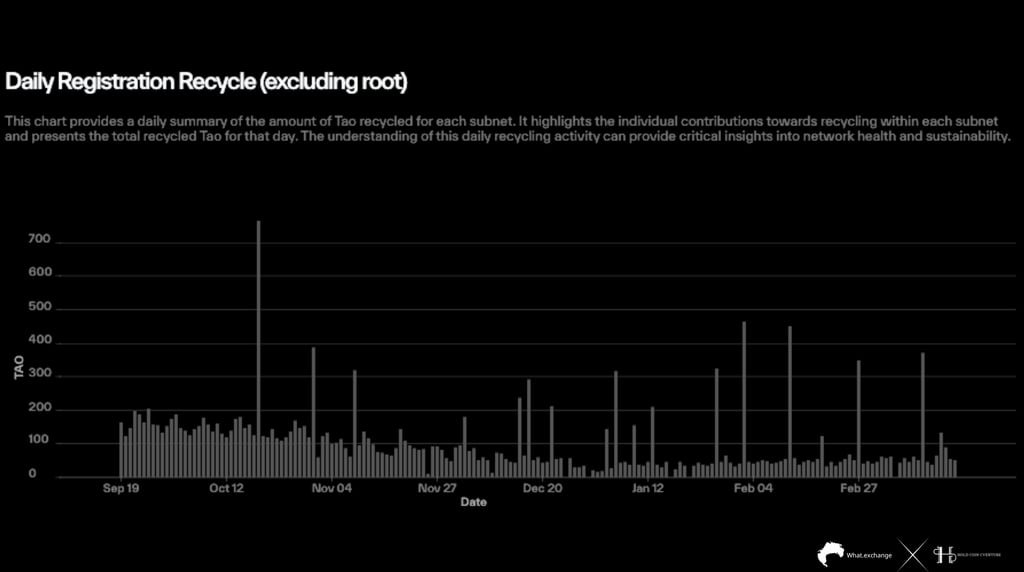
The period from September to early November saw relatively high and stable recycling levels, with average values fluctuating between 120–180 TAO/day , and several large peaks exceeding 700 TAO in mid-October. This was the highest level in the entire observation period, reflecting a period of strong network expansion as demand for subnet registration and participation surged. Compared to the lowest point in late December, when recycling dropped to around 20–40 TAO/day , the fluctuation range was over 15–20 times , indicating a clear cyclical nature of internal economic activity.
The recycle mechanism acts as an endogenous liquidity pull, as TAO is reallocated back into the system instead of circulating freely in the secondary market. Increased recycle activity means more TAO is "locked" into network operations, thereby reducing the actual circulating supply. When combined with the previously analyzed staking data and validator growth, it can be concluded that downward pressure on supply is being reinforced by both mechanisms: staking and recycle.
Current recycle levels have increased by approximately 5–7 times , indicating a strong recovery in network usage. Simultaneously, the frequency of peaks has also increased, reflecting a rise in activity intensity rather than just average levels. This is a characteristic sign of an ecosystem entering a new expansion phase after a period of accumulation.
Assessment and Conclusion
Bittensor is currently in a crucial transition phase: from a rapidly growing network to a mature ecosystem with a clear and sustainable economic structure. On-chain data shows a dominant trend of accumulation, supply locking, and increased real activity , laying a solid foundation for long-term growth.
TAO is currently operating within a controlled supply recirculation phase , where liquidity is increasing but has not yet led to structural selling pressure. The current price-turnover relationship reflects an active accumulation phase, rather than distribution or extreme speculation.
TAO's liquidity is stable and deep enough to support the revaluation process , but has not yet reached the explosive levels characteristic of parabolic growth phases. This reinforces the argument that the market is in a transitional phase from correction to accumulation, where the liquidity base is strengthened before a clearer trend is established.
TAO has shifted from narrative-driven valuation to a more pragmatic, foundation-based valuation. In this context, the next price trend will depend on the ecosystem's ability to translate expectations into actual growth, while dilution is no longer a major drag on valuation.
Bittensor's current structure represents a balance leaning towards operational efficiency rather than absolute decentralization. With large validators maintaining high levels of activity across multiple subnets and resource flows converging on key areas, the ecosystem is forming a robust and stable operational foundation. However, this centralized trend also necessitates long-term rebalancing of activity distribution to maintain the network's sustainability and decentralization.
Disclaimer: The information presented in this article is the author's personal opinion in the field of cryptocurrency. This is not financial or investment advice. All investment decisions should be based on careful consideration of your personal portfolio and risk tolerance. The views expressed in this article do not represent the official stance of the platform. We recommend that readers conduct their own research and consult with experts before making any investment decisions.
API & Dữ liệu: Dune, Atermis, Galaxy Digital, Tokenterminal, Arbiscan
Compiled and analyzed by HCCVenture and WHAT Exchange
Join the HCCVenture organization here: https://link3.to/holdcoincventure
Explore HCCVenture group
HCCVenture © 2023. All rights reserved.


Connect with us
Popular content
Contact to us
E-mail : sp_contact@hccventure.com
Register : https://linktr.ee/holdcoincventure
Disclaimer: The information on this website is for informational purposes only and should not be considered investment advice. We are not responsible for any risks or losses arising from investment decisions based on the content here.
TERMS AND CONDITIONS • CUSTOMER PROTECTION POLICY
ANALYTICAL AND NEWS CONTENT IS COMPILED AND PROVIDED BY EXPERTS IN THE FIELD OF DIGITAL FINANCE AND BLOCKCHAIN BELONGING TO HCCVENTURE ORGANIZATION, INCLUDING OWNERSHIP OF THE CONTENT.
RESPONSIBLE FOR MANAGING ALL CONTENT AND ANALYSIS: HCCVENTURE FOUNDER - TRUONG MINH HUY
Read warnings about scams and phishing emails — REPORT A PROBLEM WITH OUR SITE.