


Analysis of Crypto ETFs and ETPs in Week 1/2026: Restructuring of Internal Capital Flows
In the first week of 2026, US Spot Bitcoin ETFs recorded significantly stronger net inflows compared to the end of 2025, with positive line net flows, indicating that money is once again flowing into Spot ETF products after a period of slight decline.
1/19/202613 min read


Overview of the market context
The Bitcoin Spot ETF has recorded significant net BTC accumulation over several sessions. The Ethereum Spot ETF has also shifted to attracting capital, albeit on a smaller scale than Bitcoin. The outflow of capital is no longer widespread as it was at the end of December 2025, reflecting the expected recovery. Investors are gradually buying back in at more stable price levels, instead of withdrawing capital en masse.
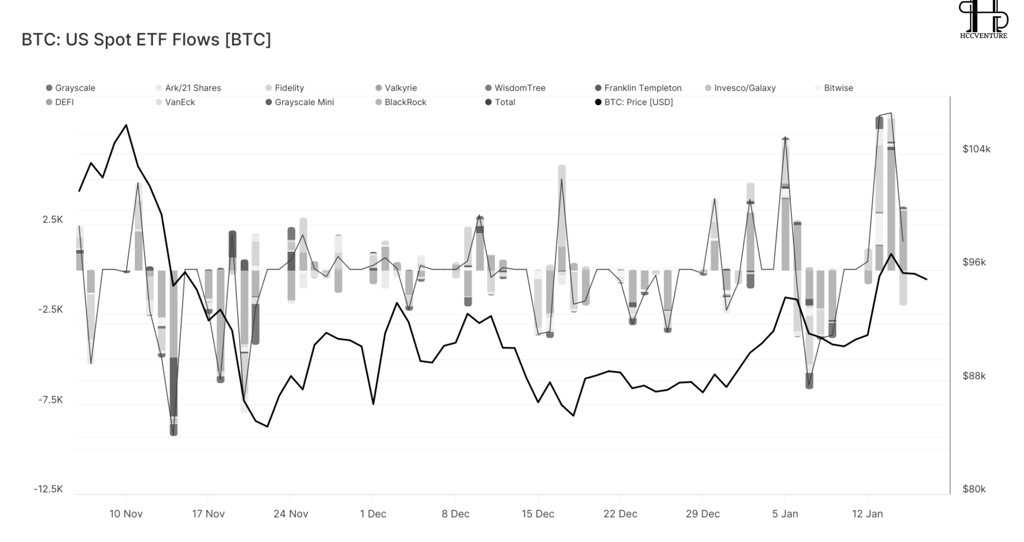
Not only is the overall capital flow positive, but the chart showing the distribution of capital flow by issuer (BlackRock, Fidelity, Grayscale, Valkyrie, Bitwise...) indicates that BlackRock and Fidelity are the two leading issuers absorbing new capital. Other funds like ARK/21Shares and Bitwise also had inflow sessions, but the distribution was uneven across days. Grayscale is no longer the overwhelming source of outflow as in previous weeks — the pressure to withdraw capital has decreased.
In previous weeks, each outflow from an ETF was usually accompanied by a significant price drop . But in the first week of 2026, even with outflows, the price of BTC did not fall sharply , and then recovered when inflows appeared. Institutional investors seem to view Bitcoin ETFs as an initial strategic investment tool at the beginning of the new year. Price fluctuations do not reflect selling pressure from ETFs as before. This indicates a stable and accumulating flow of capital , rather than a panic selling.
Overview of ETF vs ETP Crypto Cash Flows
This heatmap provides a very clear picture of how major financial institutions are positioning crypto within their global ETF portfolios . The most striking point is that crypto is no longer a "separate branch," but has been directly integrated into the core ETF ecosystems of leading issuers.
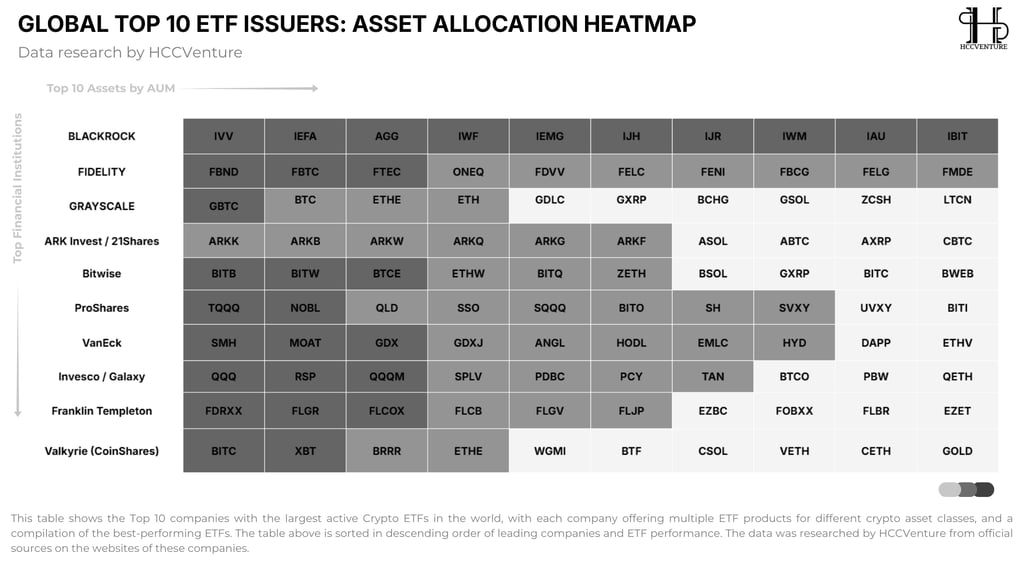
BlackRock demonstrates a very clear strategy in its top portfolios, with the Bitcoin ETF (IBIT) positioned alongside flagship ETFs like IVV, IEMG, and IAU. The allocation pattern suggests Bitcoin is being positioned as a long-term strategic allocation asset , rather than a satellite product. BlackRock's Bitcoin ETF is acting as the "default gateway" for institutional investors to access crypto, thereby creating a stable, large-scale, and less volatile capital inflow.
With Fidelity , the allocation structure shows that crypto is closely tied to technology and growth ETFs. FBTC appears in the core product group, reflecting a strategy of viewing Bitcoin as a complementary asset to a long-term growth portfolio , especially as investors seek currency hedging tools and diversification away from traditional assets.
Conversely, Grayscale exhibits a purely crypto allocation structure, with products ranging from Bitcoin and Ethereum to baskets and altcoins. However, the fact that these products are no longer at the center of the heatmap suggests that Grayscale's role in new capital flows has diminished , giving way to issuers with traditional, lower-cost, and more liquid ETF structures.
This heatmap shows that the capital flowing into the crypto market is "organized ," passing through the world's largest ETF issuers and being integrated into standard asset allocation portfolios. Bitcoin ETFs act as a pillar absorbing capital, while other crypto ETFs only expand horizontally once the platform has stabilized. There are no signs of hot speculative capital flows; instead, it's a long-term portfolio restructuring .
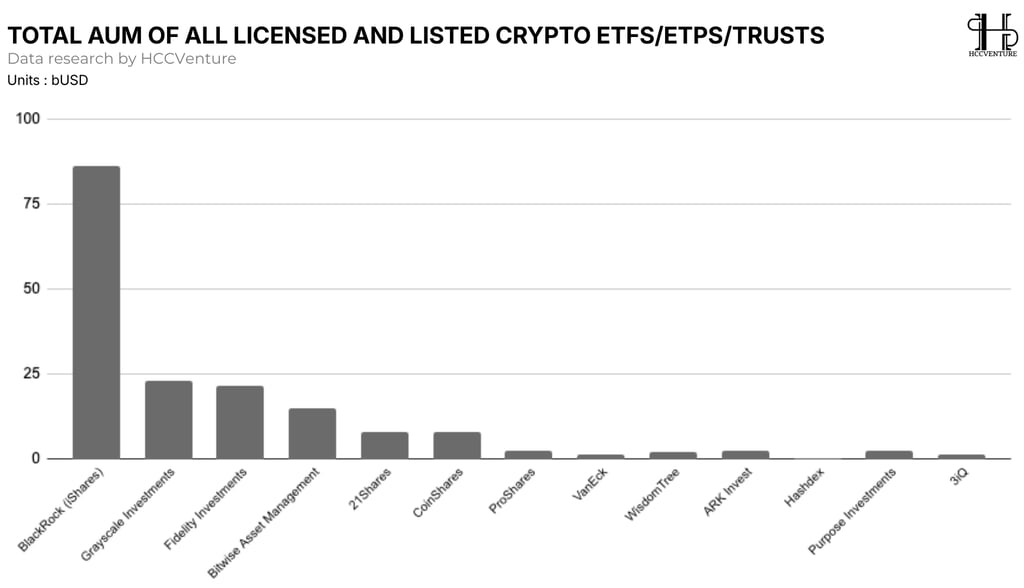
The AUM (Average Capital Assets) of all licensed and listed Crypto ETFs/ETPs/Trusts clearly demonstrates the intense concentration of institutional capital in the crypto market , with Bitcoin ETFs serving as the central channel. Bitcoin ETFs play a pivotal role in this process, and the high concentration of AUM indicates the deep integration of the crypto market into the global financial system.
With its superior AUM (Amount in Assets), BlackRock (iShares) holds the majority of crypto assets through its ETF products, far surpassing all other institutions. This reflects the confidence of institutional investors in reputable traditional asset managers and demonstrates that crypto – especially Bitcoin – has been "standardized" as a mainstream investment asset class within the global financial ecosystem.
Grayscale Investments and Fidelity Investments , despite having significantly lower AUM sizes, still maintain their pivotal positions. The presence of these two institutions suggests that the market is not just a single "absolute winner," but is forming a core group of large asset managers , where institutional capital is allocated based on brand, fee structure, and level of integration with the traditional financial ecosystem. Notably, the gap between BlackRock and the rest is enormous, reflecting the "winner-takes-most" effect in the early stages of the crypto ETF cycle.
From a macroeconomic perspective, the AUM structure in this chart reflects that current capital flows into crypto are long-term and strategic , rather than short-term speculative. ETFs not only attract new money but also lock up crypto supply into less volatile investment structures, thereby reducing the amount of freely circulating assets in the market.
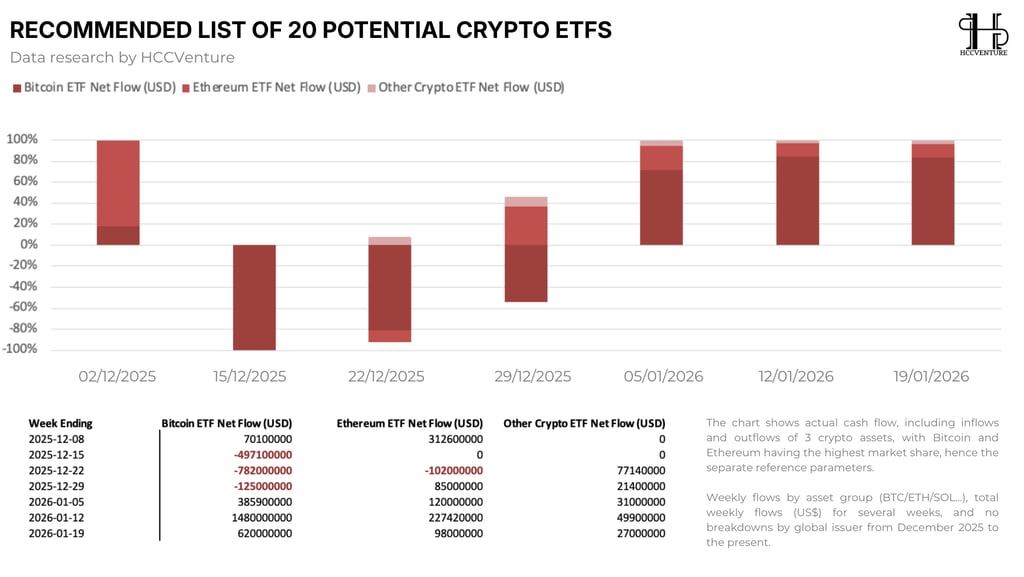
Crypto ETF capital flows are currently showing a clear but uneven recovery , with Bitcoin ETFs playing an absolute leading role. After a period of significant volatility in December, capital flows reversed positively from the beginning of January 2026 and maintained continuous inflows for the past three weeks. In the week ending January 19, 2026 alone , Bitcoin ETFs recorded net inflows of over $620 million , confirming that Bitcoin continues to be a "safe haven" for institutional capital in the crypto ecosystem.
The Ethereum ETF shows a similar trajectory but with smaller amplitude and a clear lag . Despite experiencing weeks of negative or neutral inflows in December, the ETH ETF shifted to a stable inflow from the end of the month and reached nearly $100 million in the most recent week.
The Other Crypto ETFs group (including ETFs/ETPs linked to Solana and other altcoins), although much smaller in scale, has begun to see consistent inflows in the first weeks of 2026. The fact that altcoin ETF inflows have turned positive, albeit in limited absolute value, indicates a selective expansion of risk appetite , particularly from investors outside the US and those listed in Europe.
Overall, the current capital flow structure reflects a sequential capital allocation cycle . Bitcoin ETFs were the first and largest recipients of capital, Ethereum ETFs benefited in the next phase as market confidence strengthened, while altcoin ETFs only began attracting capital when the risk environment became more favorable.
Evaluate potential portfolios.
Current crypto ETF flows remain centered around Bitcoin , with US-based Bitcoin spot ETFs dominating in terms of monthly net flow, AUM growth (MoM), and one-month performance . Funds like BlackRock's IBIT and Fidelity's FBTC are leading in net inflow size, reaching approximately $3.8 billion and $2.1 billion per month , respectively, clearly reflecting institutional investors' preference for products with high legal compliance, deep liquidity, and low management fees. Fees around 0.25% are becoming the "new standard" for Bitcoin ETFs, creating significant competitive pressure on established products.
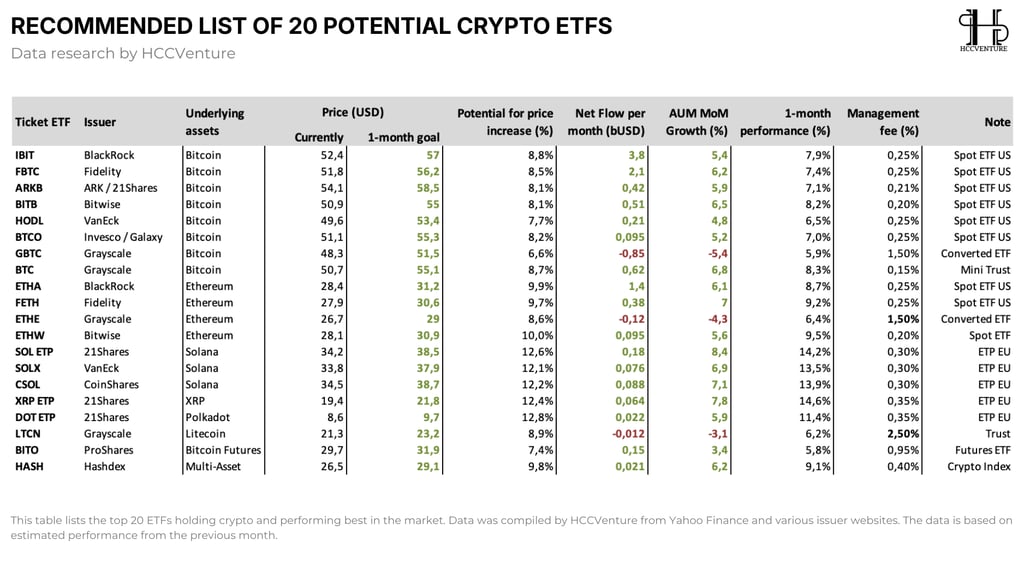
Within the Bitcoin ETF segment, differentiation is also quite evident. Funds like ARKB (ARK/21Shares) , BITB (Bitwise) , and HODL (VanEck) recorded positive inflows and stable AUM growth, indicating that capital is not solely concentrated in the two major players but is also spreading to funds with clear strategies and competitive costs. Conversely, Grayscale's GBTC continues to record net outflows and declining AUM , despite positive price performance. This reflects a very consistent trend in the current market: investors are willing to maintain exposure to Bitcoin, but are unwilling to accept high fee structures or suboptimal products .
For Ethereum ETFs , the picture shows ETH being viewed as a tier-two strategic asset , with potential price growth around 9–10% and positive net inflows in spot ETFs issued by BlackRock, Fidelity, and Bitwise . However, the scale of inflows remains significantly lower than Bitcoin ETFs, suggesting that ETH currently plays a complementary role in portfolio allocation , rather than being the central allocation.
Most notably, the ETFs linked to Solana, XRP, and Polkadot in the European market have shown outstanding AUM MoM growth and 1-month performance (over 12–14%). While the absolute size of the inflows is still small, these products demonstrate a return to selective risk appetite , particularly among investors outside the US. However, the inflow into altcoin ETFs remains exploratory and not yet large enough to significantly alter the overall structure of the crypto ETF market, which remains heavily skewed towards Bitcoin.
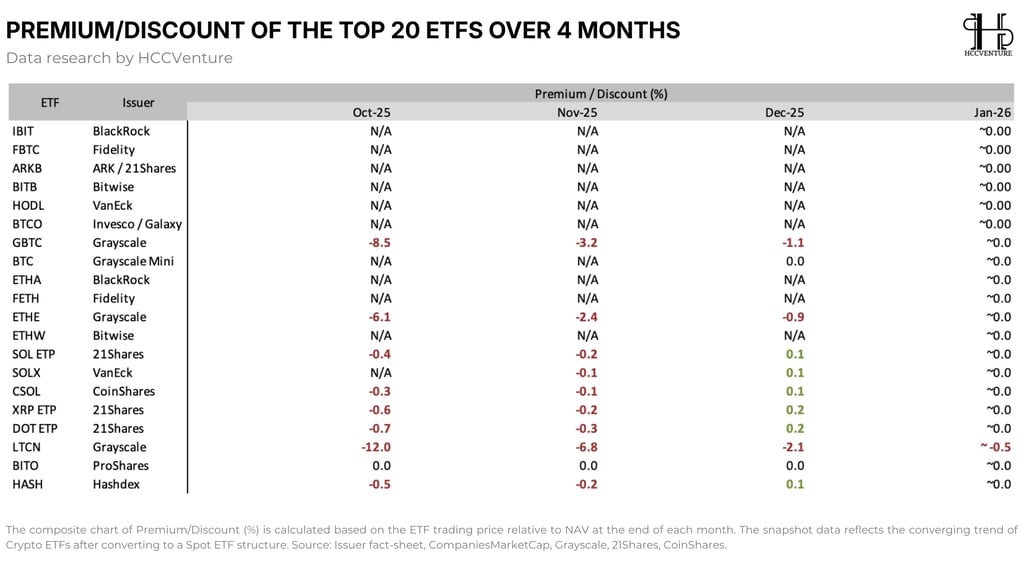
Most spot Bitcoin and Ethereum ETFs are currently trading close to their NAV (≈ 0%) . Large funds such as BlackRock 's IBIT, Fidelity 's FBTC , ARKB, BITB, and HODL have all maintained near-zero premium/discount levels in the most recent month. This reflects the efficient creation/redemption mechanism , abundant liquidity, and especially the continuous inflow and outflow of capital , unaffected by speculative pressure or structural bottlenecks.
Notably, products that previously traded at deep discounts, such as Grayscale's GBTC and ETHE, have now significantly narrowed their spreads, moving very close to equilibrium. The near-elimination of the premium/discount indicates that market confidence in the convertibility of the underlying asset has been restored , and reflects that current capital flows are no longer passive "exit" or restructuring flows, but rather active, selective flows.
The near-complete disappearance of deep discounts (-5% to -10%) across the entire current data table is noteworthy. In the context of crypto ETFs, deep discounts are typically associated with three negative factors: net capital outflows, poor liquidity, and weakened confidence. The absence of this phenomenon suggests that the crypto market is not currently under systemic selling pressure from the ETF channel ; instead, it is in equilibrium – and even being supported by new capital inflows.
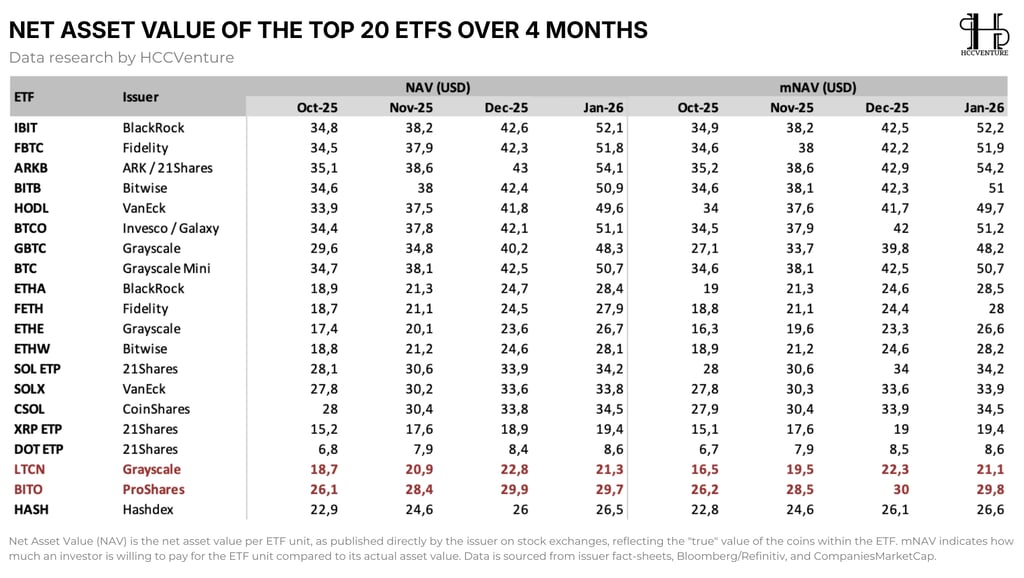
The NAV and mNAV statistics of the Top 20 Crypto ETFs show a very clear signal: the intrinsic value of crypto ETFs is increasing synchronously across the board , reflecting sustainable demand for the underlying asset rather than short-term speculative fluctuations. Most large spot Bitcoin ETFs such as IBIT, FBTC, ARKB, BITB, and BTCO have recorded strong NAV increases in the most recent month, with prices above $50, indicating that Bitcoin is being accumulated through the ETF channel with high intensity . This is a typical sign of institutional capital flow, as BTC purchases occur regularly through the ETF basket mechanism rather than direct buying and selling on the spot market.
The near-zero gap between NAV and mNAV in most Bitcoin and Ethereum spot ETFs is an extremely important indicator. This suggests that the ETF is trading close to its intrinsic asset value , reflecting good liquidity, a smoothly functioning arbitrage mechanism, and, most importantly, the absence of systemic selling pressure . When mNAV is not significantly discounted from NAV, the market implicitly confirms that investors are willing to pay the right price – or even the same price – for each ETF unit, a characteristic usually only seen when there is healthy and long-term capital inflow.
One point worth emphasizing is that ETFs with less optimal structures (e.g., futures ETFs or traditional trusts) still show relatively poorer NAV performance compared to spot ETFs. This further reinforces a very clear trend in current capital flows, where money is moving away from older structures and focusing on transparent, low-cost, and highly liquid spot ETFs .
Based on NAV, mNAV, and the convergence between these two indicators, it can be affirmed that the current capital flow into the crypto market is real, high-quality, and institutional . The market shows no signs of valuation distortion, no deep discounts, and no negative divergence between ETF prices and the underlying asset value.
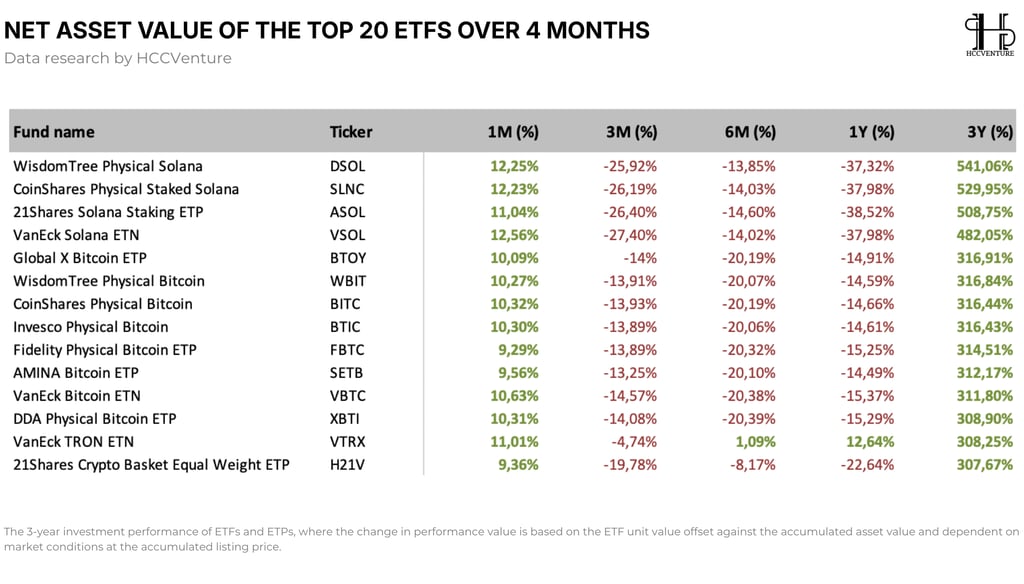
Capital flows are returning in the short term, but remain selective and not evenly distributed across the medium term . Most crypto ETFs/ETPs have recorded strong gains in the past month , fluctuating around 9–12% , indicating a clear emergence of new demand recently. This is a typical sign of institutional money flow and portfolio reallocation, as investors begin increasing their crypto holdings through clearly structured ETFs.
However, when expanding to the 3-month and 6-month timeframes , performance remains negative across most products, particularly the Bitcoin ETP and Solana ETP groups. This reflects that current capital flows are primarily recovery and accumulation , rather than strong enough to completely reverse the medium-term trend. Investors are buying after previous deep price corrections, rather than chasing a rapid upward trend. This is characteristic of a "controlled re-risking" phase, where capital prioritizes timing over increasing leverage.
Solana ETPs stand out in short-term performance, with gains exceeding 11–12% in one month, higher than the average for Bitcoin ETPs. This suggests that risk appetite has begun to expand beyond Bitcoin , particularly in Solana staking or physical products in Europe. However, 3–6 month performance remains deeply negative, reflecting that current inflows into Solana ETFs are exploratory and tactical , not yet a long-term repositioning of institutional capital.
Notably, the 1-year performance of most ETFs remains negative, while the 3-year timeframe shows significant gains across many products. This divergence reflects that crypto ETFs remain a strongly cyclical asset class , but current capital flows are not based on excessive long-term growth expectations.
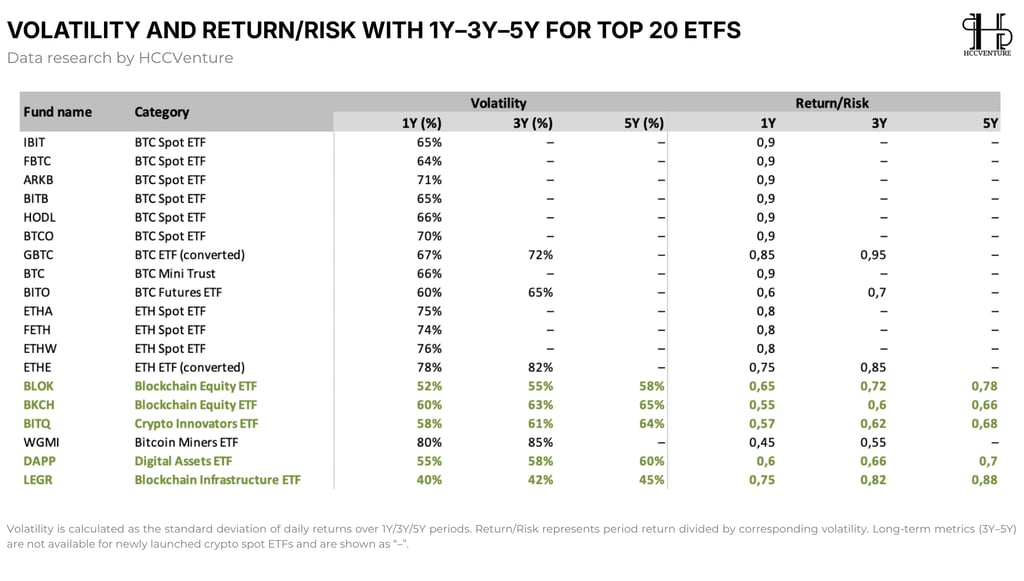
The Bitcoin Spot ETF group (IBIT, FBTC, ARKB, BITB…) has a 1-year volatility ranging from 64–71% , coupled with a return/risk ratio of approximately 0.9 , indicating that Bitcoin ETFs are delivering the highest return-to-risk ratio in the entire crypto ETF ecosystem . This is a very important signal that current capital flows are not only seeking growth but also prioritizing efficient capital allocation, a typical characteristic of institutional investors and investment advisors.
Conversely, the ETH Spot ETF recorded significantly higher volatility, ranging from 74–78% , while the return/risk ratio was only around 0.75–0.8 . This suggests that the Ethereum ETF is currently priced as a higher-risk asset but has not yet delivered a commensurate return compared to Bitcoin.
BTC Futures ETFs (BITO) have lower volatility (around 60–65% ), but significantly lower return/risk ratios ( 0.6–0.7 ). This reflects the continued erosion of investment efficiency by futures structure costs (roll cost, contango), making futures products less attractive to current investors despite their longer history.
The Blockchain Equity ETF and Infrastructure ETF group (BLOK, BITQ, DAPP, LEGR) shows a completely different risk-reward profile. The volatility of this group is significantly lower (40–60%), while the return/risk ratio gradually improves over time , even reaching 0.88 in LEGR over the 5-year timeframe .
From a volatility and return/risk perspective, it can be asserted that the current capital flow into the crypto market is high-quality capital, geared towards portfolio optimization rather than speculation . Investors are choosing products with the best risk-performance ratio, high liquidity, and transparent structure – consistent with the characteristics of Bitcoin spot ETFs and, to a lesser extent, blockchain infrastructure ETFs.
Bitcoin ETFs' capital flows
The final phase of the chart shows a large and continuous inflow of ETF capital , while the price of BTC only recovered moderately. This divergence is very significant: capital is outpacing price . Institutional investors are accumulating Bitcoin through ETFs while the price hasn't broken out strongly, instead of chasing the market when it's euphoric. This is a typical characteristic of strategic capital flows, completely different from the short-term speculative behavior of retail investors.
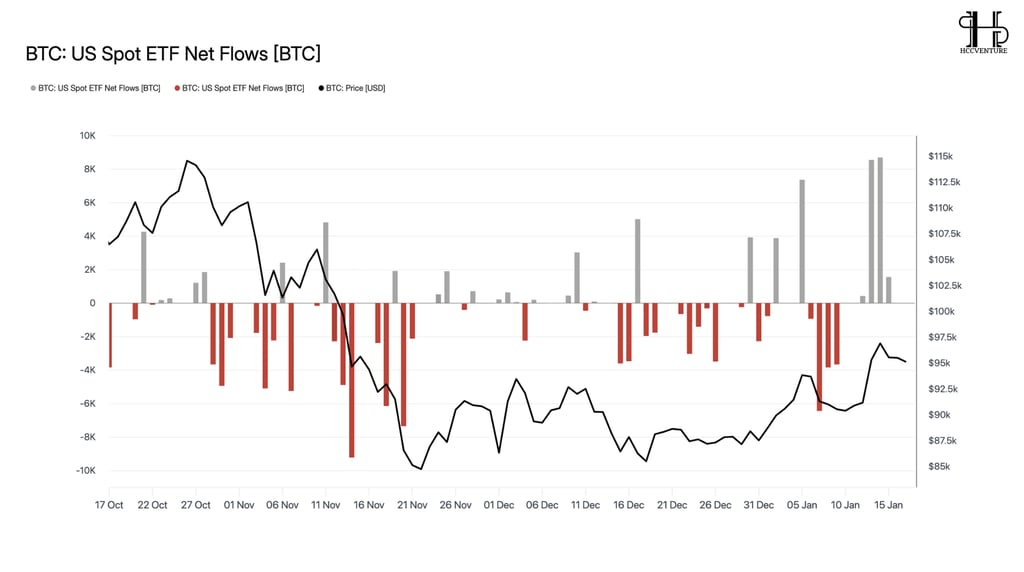
The intensity of inflows has been increasing in recent sessions, with many days recording very high net BTC purchases, while subsequent outflows have been significantly smaller. This reflects a structural shift in capital flows from defensive withdrawals to controlled accumulation . More importantly, this capital flow has not caused strong price distortions immediately, indicating that the BTC absorbed through ETFs is being received quite smoothly by the spot market.
Outflows are no longer dragging prices down to new lows , while inflows are gradually appearing more frequently in the low-to-medium price range. This indicates that the systemic selling pressure from ETFs has significantly weakened . When ETFs are no longer a net source of supply, the Bitcoin market shifts from a passive to a balanced state, creating conditions for a stable or upward trend in the medium term.
A notable trend is the increasingly prominent leading role of new spot ETFs , particularly those issued by BlackRock and Fidelity . In many sessions, inflows from these funds occurred simultaneously with or immediately following outflows from older funds, indicating that capital is not leaving Bitcoin , but rather shifting to more efficient, lower-cost, and more liquid ETF structures . This reinforces the view that spot ETFs are becoming the standard access channel for institutional capital to BTC.
Grayscale (including Grayscale Mini) still experiences outflows, but the intensity has decreased and no longer triggers chain outflows from other issuers. This suggests that the restructuring pressure from the convertible products has gradually been absorbed by the market , and Grayscale is no longer the "forced supply" distorting the cash flow structure as before. When a structural selling source weakens, the market usually enters a more stable price phase.
Bitcoin ETFs have been "normalized" in institutional portfolios . ETFs are no longer a novel product to be tested, but have become a strategic allocation tool. This explains why current capital flows are revolving between issuers, rather than withdrawing from the market during periods of increased volatility.
Assessment and Conclusion
Current capital flows are no longer hot money chasing price fluctuations , but rather strategically allocated capital that prioritizes risk efficiency and product structure. Crypto ETFs – especially Bitcoin spot ETFs – have become the "default" channel for institutions to access crypto , similar to how they approach gold or equity index ETFs.
Bitcoin spot ETFs are absorbing the majority of new capital inflows .
NAV increases synchronously, mNAV closely tracks NAV .
Premium/discount options have been almost completely eliminated .
And the return/risk ratio of Bitcoin ETFs outperforms the rest of the groups .
New money flows into Bitcoin first, then spread to Ethereum and other assets . Bitcoin is currently seen by the market as the anchor asset for the entire crypto ETF ecosystem. Meanwhile, Ethereum ETFs are seeing steady increases in NAV and positive inflows, but on a smaller scale than Bitcoin , reflecting their role as a secondary strategic asset . In other words, risk appetite is expanding, but not yet fully . Money is not yet ready to make a strong shift towards altcoin ETFs unless there is a solid price base from Bitcoin.
Within the Bitcoin Spot ETF group, BlackRock's IBIT and Fidelity's FBTC are playing a central role in absorbing new capital flows into the crypto market. Data shows that these two ETFs maintain stable inflows, NAV and mNAV closely track each other, premium/discount are near zero, and their risk-to-performance ratio is superior to the rest.
ARKB by ARK/21Shares and BITB by Bitwise represent a tactical complementary role. Inflows into these ETFs are more volatile, but they demonstrate a better ability to track market movements during corrections. This group of ETFs is suitable for investors with a higher risk appetite, where they are willing to accept volatility in exchange for better short-term performance.
Futures ETFs like BITO (ProShares) or miner ETFs like WGMI no longer play a significant role in attracting new capital. Their low risk-to-performance ratio, high volatility, and suboptimal structure have led to them being gradually replaced by Bitcoin spot ETFs. Similarly, Blockchain Equity ETFs or Digital Asset ETFs only indirectly reflect the crypto market and are heavily influenced by the stock market; therefore, they are not direct indicators of money flowing into crypto.
In conclusion , current data shows that crypto ETF capital flows are highly concentrated in a few core products, most notably IBIT and FBTC, while other ETFs play only a supplementary role or have diminished influence. If this trend continues, Bitcoin ETFs will continue to be the foundation of crypto market capital flows in 2026, before capital flows spread more strongly to other assets.
Disclaimer: The information presented in this article is the author's personal opinion in the field of cryptocurrency. This is not financial or investment advice. All investment decisions should be based on careful consideration of your personal portfolio and risk tolerance. The views expressed in this article do not represent the official stance of the platform. We recommend that readers conduct their own research and consult with experts before making any investment decisions.
Compiled and analyzed by HCCVenture
Follow HCCVenture here: https://linktr.ee/holdcoincventure
Explore HCCVenture group
HCCVenture © 2023. All rights reserved.


Connect with us
Popular content
Contact to us
E-mail : sp_contact@hccventure.com
Register : https://linktr.ee/holdcoincventure
Disclaimer: The information on this website is for informational purposes only and should not be considered investment advice. We are not responsible for any risks or losses arising from investment decisions based on the content here.
TERMS AND CONDITIONS • CUSTOMER PROTECTION POLICY
ANALYTICAL AND NEWS CONTENT IS COMPILED AND PROVIDED BY EXPERTS IN THE FIELD OF DIGITAL FINANCE AND BLOCKCHAIN BELONGING TO HCCVENTURE ORGANIZATION, INCLUDING OWNERSHIP OF THE CONTENT.
RESPONSIBLE FOR MANAGING ALL CONTENT AND ANALYSIS: HCCVENTURE FOUNDER - TRUONG MINH HUY
Read warnings about scams and phishing emails — REPORT A PROBLEM WITH OUR SITE.