

Analysis of Crypto ETFs and ETPs in March 2026: The Market Has Become Institutionalized
The digital asset ETF market is entering a clearly mature phase, with capital flows becoming more stable rather than speculative as in previous cycles, reflecting a high level of efficiency in arbitrage mechanisms and liquidity.
4/13/202618 min read

Overview of the market context
The global crypto ETF market has reached a size of approximately $158.8 billion in AUM , with Bitcoin accounting for 85% ($135 billion) , Ethereum approximately 13–14% ($21.5 billion) , Solana approximately $1.4 billion , and other altcoins approximately $0.9 billion . BlackRock ( IBIT ) dominates with a market share of approximately 45–47% , followed by Fidelity ( FBTC ), Grayscale ( GBTC/ETHE ), and crypto issuers such as ARK/21Shares and Bitwise .
Institutional capital inflows are extremely stable and efficient: premium/discount are close to NAV (Grayscale discounts have narrowed sharply to -0.4% to -0.5% ), NAV/mNAV are almost equal, and arbitrage works perfectly. This is a characteristic sign of an institutionalized market , where ETF prices reflect the underlying asset price almost directly instead of being distorted as in the previous GBTC era .
However, it's noteworthy that the price movement of SOL (+18%) and altcoins (+12%) is showing positive AUM growth , while BTC ( -10% ) and ETH ( -7% ) are showing signs of short-term correction. This suggests that money isn't withdrawing from the market, but rather rotating from core assets to higher-beta assets.
Simultaneously, the NAV and mNAV data of major ETFs continue to maintain a steady upward trend over time, especially the spot ETFs led by BlackRock , Fidelity , and ARK . Meanwhile, legacy products like GBTC and ETHE continue to record weaker performance and net outflows, reflecting a structural shift from trust/converted products to standard ETFs with lower costs and higher efficiency.
Overview of ETF vs ETP Crypto Cash Flows
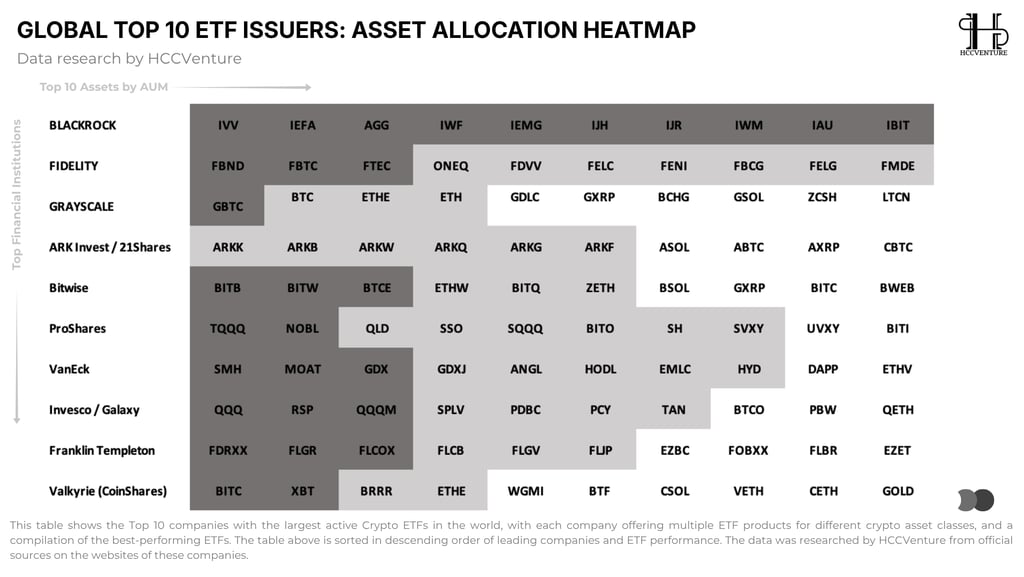
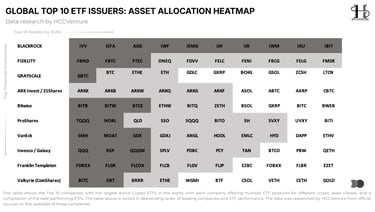
This heatmap provides a very clear picture of how major financial institutions are positioning crypto within their global ETF portfolios . The most striking point is that crypto is no longer a " separate branch ," but has been directly integrated into the core ETF ecosystems of leading issuers.
Bitcoin is no longer considered an independent asset, but has been directly integrated into the global asset allocation system. This means that the flow of money into crypto doesn't necessarily come from " belief in crypto ," but can come passively through institutional allocation strategies.
BlackRock describes the iShares Bitcoin Trust ETF as a tool that provides direct exposure to Bitcoin in a convenient and cost-effective way, and states that BlackRock manages $12.5 trillion in AUM as of June 30, 2025. Fidelity, on the other hand, clarifies that it currently has three crypto funds for bitcoin, ether, and SOL . When crypto is placed alongside equity , bond , gold , and factor ETFs on the same product shelf, it suggests that current capital flows are institutional, disciplined, and increasingly view crypto as a standardized asset class rather than a separate speculative narrative.
Morgan Stanley Investment Management filed for two cryptocurrency ETPs on January 6, 2026, one tied to Bitcoin and the other to Solana , indicating that major banks are taking a step further from a " watchmaker " role to a " product issuer " role . Reuters also noted Morgan Stanley's deeper expansion into the digital asset sector, while Citigroup forecasts that AUM ETFs in the US could continue to grow strongly in the coming years, reflecting investors' continued preference for ETFs due to liquidity, cost, and standardization.
Bitcoin remains the primary and largest source of funding, Ethereum is the next tier, while Solana and other altcoins are merely testing the waters for risk appetite. The fact that IBIT and FBTC are part of the core distribution ecosystems of BlackRock and Fidelity means their potential to attract capital remains the strongest, while new ETP/ETF cryptocurrencies will only absorb more capital as institutional platforms continue to expand their sales channels.
Crypto has become the core allocation for top issuers. ETF capital is flowing strongly into the market (especially BTC), with BlackRock/Fidelity being the major players attracting institutional money. This is a medium-term bullish signal for crypto – not hype, but sustainable institutional adoption.
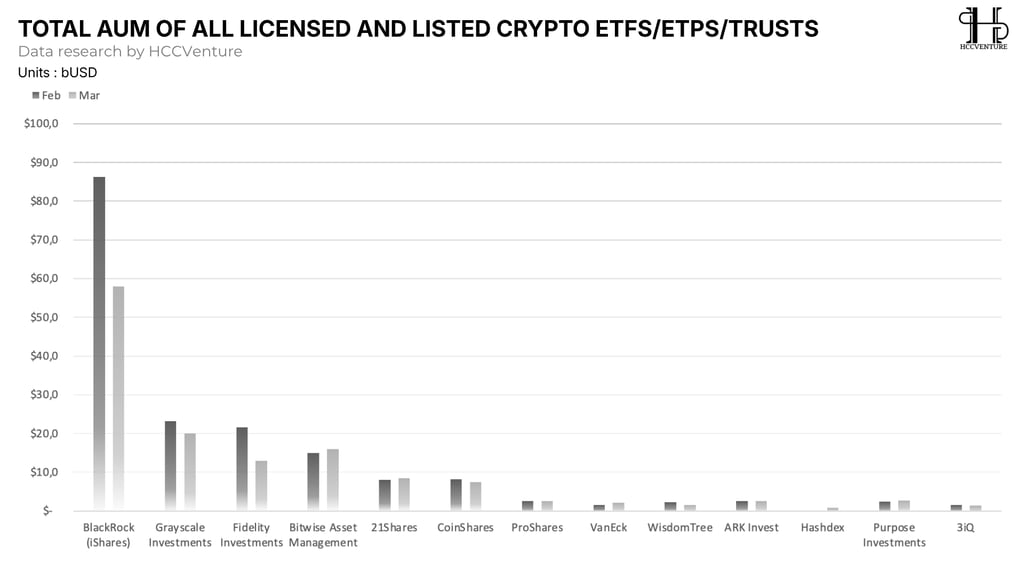
The total AUM of ETFs and ETPs in March was weaker than in February for major issuers, but this is not a sign of money leaving crypto; it's more like a consolidation phase around high-quality wrappers, waiting for new catalysts to expand into other products.
The top 5 issuers (BlackRock, Grayscale, Fidelity, Bitwise, and ARK/21Shares) control approximately 80-85% of the total global crypto ETF AUM . The HCCVenture chart clearly shows a strong concentration of capital in a few major players like TradFi , and also indicates that March saw AUM contraction across most issuers, possibly due to the recent market downturn.
BlackRock (iShares) : Completely dominant with a massive AUM ( ~$58 billion ). This is a significant decrease, but still 2-3 times higher than the second-highest issuer.
Grayscale : currently holds approximately $20 billion (still the second largest, but outflows have slowed compared to the previous month).
Fidelity currently holds $13 billion (a sharp decrease from the beginning of the year, but still in the top 3).
Bitwise Asset Management : saw growth to $16 billion , demonstrating the steady appeal of ETH as an asset class.
This pattern suggests that current capital flows haven't spread widely across the entire crypto ETF ecosystem; they're clustered around a few major issuers, and the two-month shift looks more like a revaluation/rotation than a massive surge in AUM across the board.
BlackRock continues to use IBIT as a primary gateway to Bitcoin , and BlackRock itself claims to be the world's largest asset manager, with approximately $12.5 trillion in AUM as of June 30, 2025. Conversely, Reuters reported that Morgan Stanley has filed for the launch of Bitcoin and Solana- linked ETFs on January 6, 2026, indicating that institutional capital continues to flow into crypto, particularly through familiar ETF wrappers favored by traditional investors.
Although the flow of money has slowed, it continues to flow into crypto, but into the safest and most liquid structures . This trend is also supported by the SEC's simplification of the listing process for spot crypto ETFs from September 2025, significantly shortening the path to bringing products like Solana or XRP ETFs to market. This suggests that the market breadth may still expand, but at present, Bitcoin ETFs remain the main attraction , while altcoin ETFs are merely an extension of that.
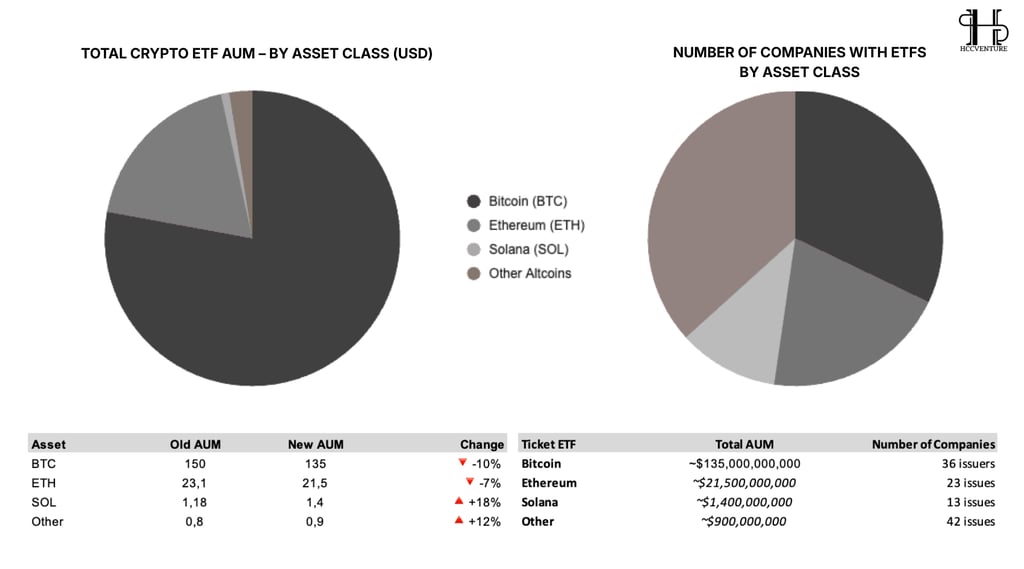
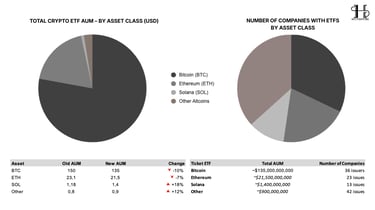
Looking at the AUM structure, Bitcoin still holds an overwhelming share ( $135 billion ), far surpassing Ethereum ( $21.5 billion ) and virtually " swallowing " the entire crypto ETF market. This demonstrates an unchanging reality: BTC remains the liquidity anchor – the primary entry point for institutional capital. Any large influx of money into crypto through ETFs almost always goes through Bitcoin first , as it is a highly liquid asset, widely accepted, and easily integrated into portfolios.
BTC & ETH AUM decreased (10% and 7%) : This is primarily a mark-to-market effect (recent BTC/ETH price corrections have reduced portfolio value), not large outflows. ETF inflows are still occurring (BlackRock IBIT and Fidelity FBTC are still attracting hundreds of millions of USD in inflows per day, as recent reports indicate), but the AUM decrease is due to a drop in spot prices.
SOL AUM surged 18% : This is the biggest highlight . Capital is shifting (rotating) towards Solana ETFs (tickers BSOL, GSOL, ASOL… from the previous heatmap). Institutions are buying more SOL spot through ETFs, pushing AUM up despite overall market volatility.
Other Altcoins around 12% : Shows a clear diversification trend – no longer 100% focused on BTC/ETH.
Although Bitcoin has the largest AUM, it only has 36 issuers, while the " Other " group has 42 issuers – the most in the market. This indicates a mismatch between capital size and product competition . Institutions are no longer focusing on expanding Bitcoin ETFs , but are instead pushing product development in new segments such as altcoins, thematics, or basket ETFs to seek growth.
The crypto ETF market is entering a phase of clear stratification , in which:
Bitcoin giữ vai trò “ store of liquidity ”
Ethereum plays the role of a “ secondary institutional asset ”.
Altcoins are becoming a " growth layer " to absorb new capital flows.
Crypto ETFs are entering a mature phase, with Bitcoin serving as a stable foundation and Solana emerging as the fastest-growing driver. The increasing number of issuers in altcoins indicates that institutional capital is no longer concentrated in a single area but is being strategically allocated, creating a solid foundation for the sustainable expansion of the entire market in the future.
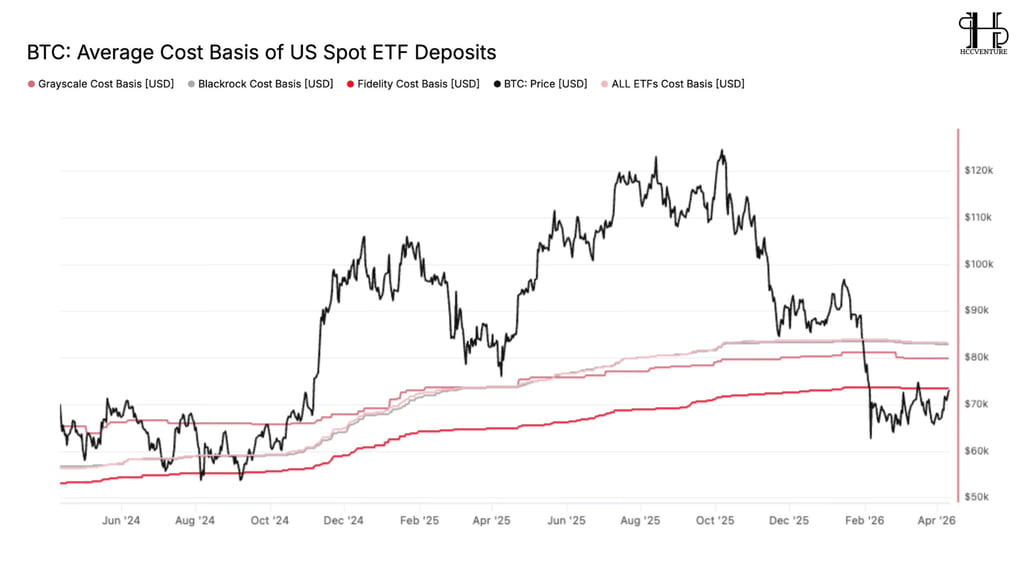
BTC is trading below the average cost basis of the ETF . This puts the entire market in a slightly "underwater" state. But instead of creating strong selling pressure, the cost basis lines are almost flat, showing no signs of a sharp decline. The insight here is clear: institutions are not panic selling . They are not reacting to short-term price fluctuations, but are holding their positions.
Fidelity has a lower cost basis ( $70,000 ), while BlackRock and the overall market have higher costs ( $80,000+ ). This suggests that early investors are in a better position, while later investors are experiencing more drawdowns. However, the fact that all indicators remain stable suggests there is no systemic sell-off , even if some investors are incurring losses.
More importantly, this chart creates an " anchor " for the entire market. The cost basis zone of ~$75k–$80k is becoming an extremely important psychological reference point:
In this region, most ETFs return to profitable positions.
Below this area → the market is in an accumulation zone.
This is why prices tend to react strongly around this area – not just for technical reasons, but because it's the break-even point for the largest flow of money in the market . Prices correct, but money doesn't leave . When the cost basis continues to move sideways and doesn't decrease, it means that supply isn't being released into the market.
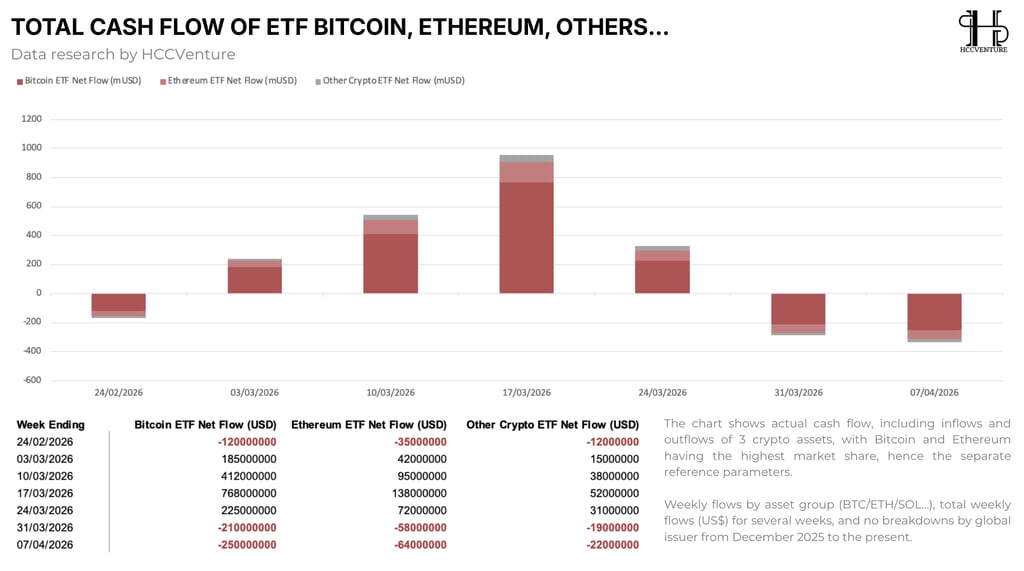
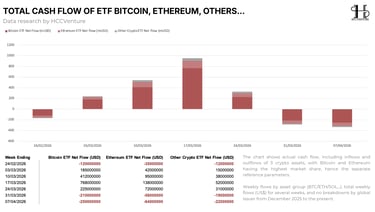
Between the end of February and mid-March 2026, the market witnessed a strong and consistent inflow across all three asset classes . After a week of slight outflow ( -$120 million USD in BTC) , the flow quickly reversed with +$185 million (March 3rd), +$412 million (March 10th), and peaked at +$768 million (March 17th).
Notably, Ethereum and the altcoin group also accelerated simultaneously ( ETH reached +$138 million , others +$52 million ). This reflects a state of “ synchronous risk-on ,” where institutional money flows are not only focused on Bitcoin but also expanding into higher-beta assets.
However, immediately after this peak inflow, the market began to show signs of distribution and weakening capital flows . The week of March 24th still maintained positive inflow ( +225 million USD BTC ), but it decreased significantly compared to the previous week. This is a typical signal of large capital flows starting to slow down, often accompanying a period when the market enters a resistance zone or loses short-term growth momentum.
The week of March 31st saw a $210 million outflow of BTC and a $58 million outflow of ETH , which further expanded to $250 million in BTC and $64 million in ETH in the week of April 7th. Importantly, this outflow wasn't limited to Bitcoin but extended to Ethereum and the altcoin sector, indicating that this wasn't an internal rotation but rather a withdrawal of capital from the entire crypto ETF market .
A notable point is that throughout this cycle, Bitcoin consistently accounted for the largest share of capital flow , acting as a leading indicator. When BTC inflow surged, the entire market expanded; when BTC reversed, other asset classes also quickly weakened. Ethereum and altcoins, despite having higher growth margins, still depended on the direction of BTC capital flow – reflecting a market structure that remained " BTC-centric ".
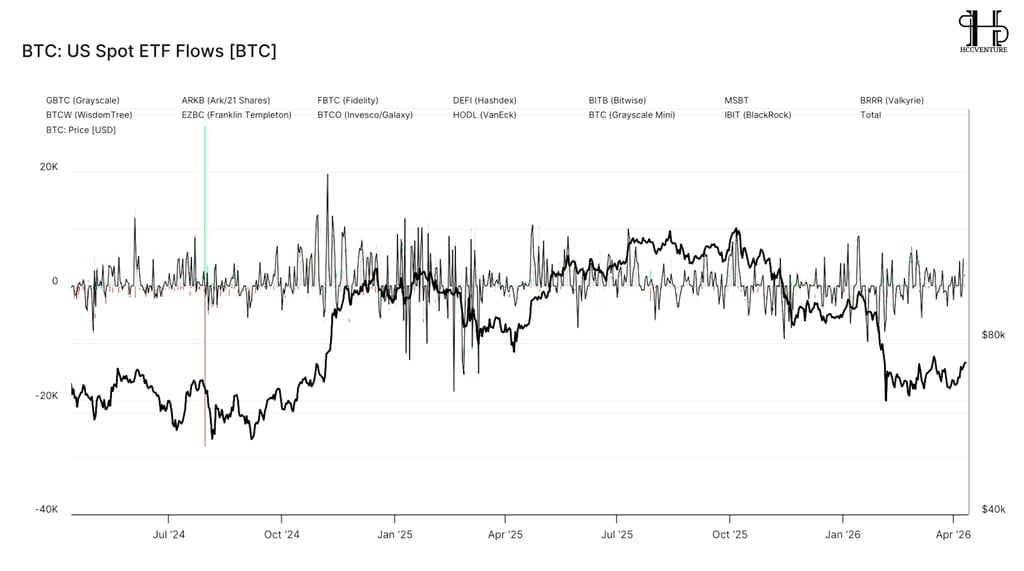
Throughout the period from mid-2024 to early 2025, ETF flows exhibited continuous volatility with large amplitudes , instead of maintaining a stable inflow trend. Inflow/outflow spikes appeared frequently, reflecting active trading from large funds such as BlackRock (IBIT) , Fidelity (FBTC) , Ark (ARKB) , and Bitwise (BITB) . This indicates that ETFs are not just long-term holding channels but have become trading tools for institutional money , especially during periods of high market volatility.
From mid-2025 onwards, Total Flows showed positive trends and maintained stable inflows with several strong positive spikes. Recently (January–April 2026), cash flow fluctuated significantly but remained overall positive. IBIT (BlackRock) stood out as the main driver, often accounting for the largest proportion of inflows. Grayscale (GBTC) and some older products continued to record slight outflows, while Grayscale Mini and newer issuers like MSBT (Morgan Stanley) began contributing positively to inflows.
One notable point is that the relationship between ETF flows and Bitcoin price (black line) is not entirely linear. In many instances, the BTC price rises before ETF inflows surge, suggesting that ETFs are playing a "follow-trend" role rather than leading the trend . However, during sharp corrections – particularly in early 2026 – ETF flows become a trend-amplifying factor, with large outflows occurring simultaneously with BTC prices falling sharply to the ~$60k–$70k range .
However, a positive sign is that after each period of strong outflow, the market sees a return of inflow , although not strong enough to form a sustainable trend. This reflects that institutional capital has not left the market , but is merely circulating according to price levels and macroeconomic expectations. ETFs therefore become a flexible " entry and exit point ," rather than a fixed accumulation point.
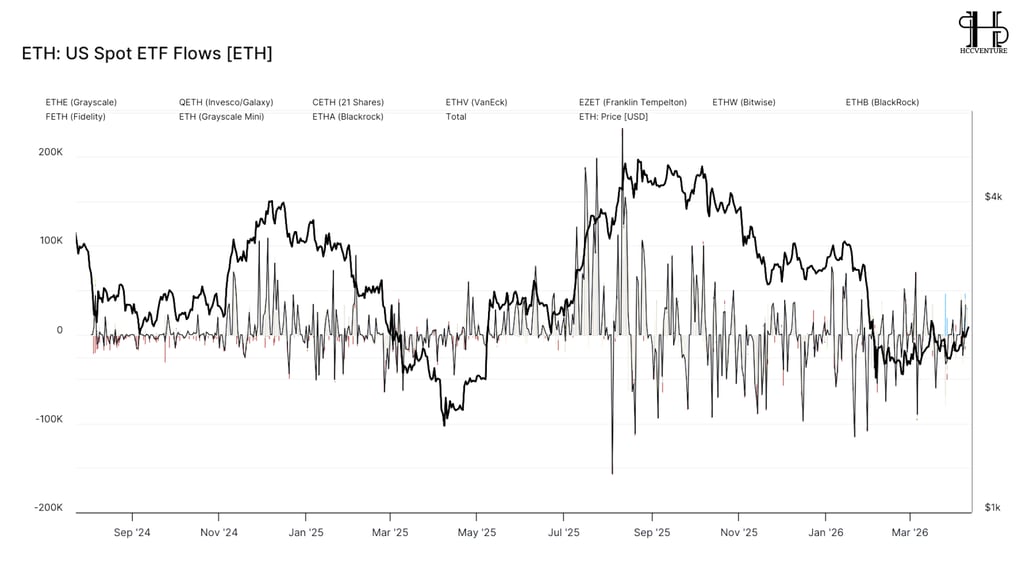
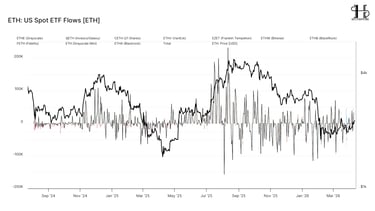
Between late 2024 and mid-2025, ETH ETFs recorded large inflow clusters coinciding with a clear bull cycle for ETH. When ETH price broke through the ~$3,500–$4,000 range , ETF inflows also surged with several spikes in inflows, indicating that institutional investors began expanding their exposure to ETH after Bitcoin had established a trend . This aligns with the familiar structure of the crypto market: ETH typically acts as a higher-beta asset, benefiting from the outflow of capital away from BTC.
However, the key difference lies in the stability of the capital flow. Compared to BTC, the ETH chart shows a larger inflow/outflow range and a higher frequency of reversals , reflecting a lower level of institutional "conviction." Inflow spikes are usually short-lived, quickly replaced by strong outflows, especially during price corrections. This suggests that ETH ETFs are currently primarily used as a trading tool or tactical allocation, rather than a long-term strategic holding.
The period from Q3/2025 to early 2026 is the clearest evidence of this characteristic. When ETH peaked and began to weaken, the chart recorded a series of large outflow sessions, with fluctuations sometimes reaching -150K to -200K (flow units). The outflow of funds occurred faster and more strongly than with BTC, indicating that ETH is more sensitive to risk-off sentiment . This also shows that institutions are willing to reduce risk on ETH before cutting their positions in BTC.
Another noteworthy point is the lack of a stable, long-term cumulative cash flow . Unlike Bitcoin – which has periods of sustained inflow – the ETH ETF mostly fluctuates around neutral levels, with alternating periods of increases and decreases. This reflects that the investment narrative in ETH at the institutional level is not yet clear or strong enough to sustain a sustainable capital flow like BTC.
Evaluate potential portfolios.
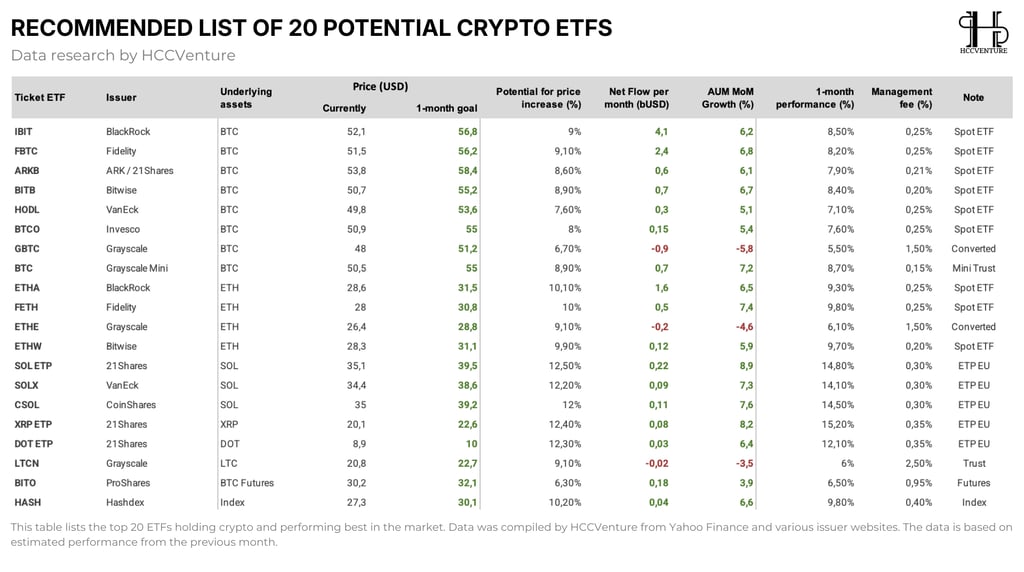
HCCVenture 's top 20 ETF list shows that the crypto ETF market is clearly prioritizing low-fee spot BTC products as its core allocation and Solana ETPs as its growth driver. Institutional investors are seeking a combination of high liquidity, low fees, and strong upside potential, creating a solid foundation for the market's further expansion.
The first highlight lies in the Bitcoin ETF group. Funds like IBIT, FBTC, ARKB, and BITB continue to maintain the highest net inflows in the market ( IBIT ~4.1B USD/month, FBTC ~2.4B ), along with stable AUM growth ( ~6–7% ). However, the expected price increase for this group is only around ~8–9% , lower than other assets. The perspective is clear: BTC is no longer a place to seek alpha, but rather a place to maintain liquidity and underlying cash flow .
Meanwhile, Ethereum ETFs are showing signs of being " mid-cycle ." Funds like ETHA and FETH are still recording positive inflows and good AUM growth ( ~6–7% ), but not significantly better than BTC. This reflects ETH's current position: it has undergone institutional adoption, but has not yet become the center of capital flow . It acts as a bridge between BTC and altcoins, but is not yet the ultimate destination of capital rotation.
The most noteworthy aspect lies in the altcoin ETF group, particularly SOL , XRP , and DOT . Products like SOL ETP , SOLX , CSOL , and XRP ETP all have the highest potential upside ( ~12–12.5% ), strong AUM growth (~7–9%), and outstanding 1-month performance ( ~14–15% ). Although the absolute inflow size is still small, the growth rate far surpasses that of BTC and ETH. This is a very clear sign of a risk-on rotation phase within the crypto market , where money begins to seek higher yields after being allocated to core assets.
This recommendation table continues the pattern from the previous two charts, confirming the trend of BlackRock and Fidelity controlling the majority of capital flows due to low fees and efficient arbitrage. Institutional capital is strongly rotating away from Grayscale (high-fee) to spot low-fee products, while also shifting some towards Solana – which has both the highest price potential and AUM growth.
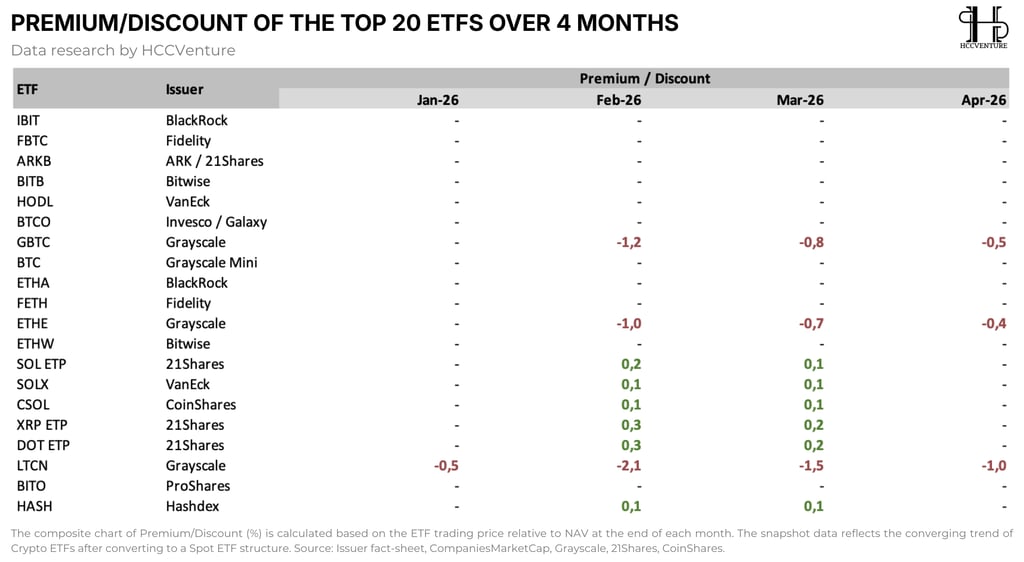
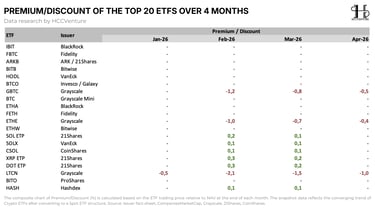
The premium/discount chart of the top 20 crypto ETFs over the last four months reflects a significant shift in the crypto ETF market structure, gradually moving towards a state of "market efficiency," where trading prices approach NAV and arbitrage mechanisms operate more smoothly .
Most low-fee spot ETFs such as IBIT (BlackRock) , FBTC (Fidelity) , ARKB (ARK/21Shares) , BITB (Bitwise) , HODL (VanEck) , and BTCO (Invesco/Galaxy) are trading close to their NAV (indicated by "-"), suggesting effective arbitrage and high liquidity.
The Grayscale group (high management fees) clearly demonstrates the difference:
GBTC : Discount narrowed from -1.2% to -0.5% .
ETHER : Discount decreased from -1.0% to -0.4% .
LTCN : The discount deepened but also narrowed from -2.1% to -1.0% .
More notably, the altcoin ETF group ( SOL , XRP , DOT ) recorded a slight positive premium (~0.1% – 0.3%) . This signals that investment demand for high-beta assets is exceeding supply in the short term, especially given the limited number of altcoin ETF products. Positive premiums typically occur when investors are willing to pay a higher price than NAV for quick exposure, reflecting growth expectations and risk-on sentiment towards altcoins .
The narrowing discount on Grayscale GBTC and ETHE clearly reflects the rotation of capital from high-fee products (1.5%) to low-fee products from BlackRock , Fidelity , and Bitwise . This is not a sign of capital withdrawal but rather portfolio optimization – money is shifting towards ETFs with more competitive costs, better liquidity, and higher management efficiency.
Simultaneously, the near-zero premium of Solana and altcoin ETPs suggests the market is pricing more reasonably, reducing short-term bubble risk and creating conditions for sustainable inflows. Overall, the convergence of NAV across the top 20 ETFs is a strong signal that crypto ETFs have reached a level sufficient to become a standard asset allocation channel for institutional investors.
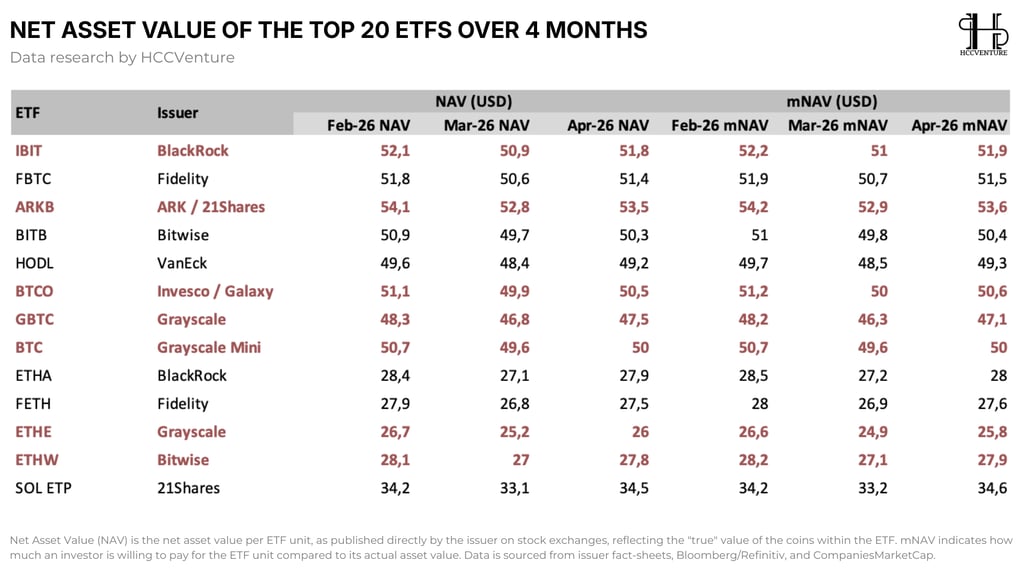
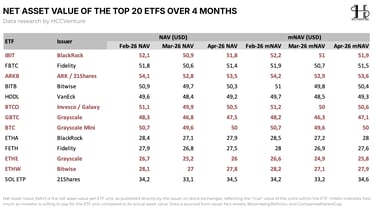
The net asset value (NAV) of ETFs is moving in sync with the underlying market, but the divergence between issuers is becoming more apparent . NAV reflects the intrinsic value of the crypto assets within the ETF after fees, while mNAV shows the price investors are willing to pay relative to their intrinsic value.
The NAV recovery in April for IBIT , FBTC , ETHA , and SOL ETP accurately reflects the sideways-recovering BTC/ETH/SOL price trend at the beginning of April. Simultaneously, the smaller NAV gap of Grayscale GBTC and ETHE continues to drive capital rotation from high-fee products to low-fee ETFs – a clear portfolio optimization move by institutional investors.
In particular, SOL ETP 's strong NAV recovery and mNAV close to NAV indicate that capital is gradually diversifying towards Solana, consistent with the +18% AUM growth trend and 12–12.5% potential price increase mentioned in the Recommended List. Overall, the convergence of NAV and mNAV across the top 20 ETFs demonstrates that the crypto ETF market has reached a sufficient level of maturity to become a standard asset allocation channel, with low costs and high liquidity.
Observing mNAV (market NAV) reveals a crucial factor: the difference between NAV and mNAV is almost negligible across the board , reinforcing the view that the current crypto ETF market is highly liquid and efficient. The absence of large premiums/discounts like in previous cycles indicates that the arbitrage mechanism is working effectively and institutional capital has become accustomed to this product structure.
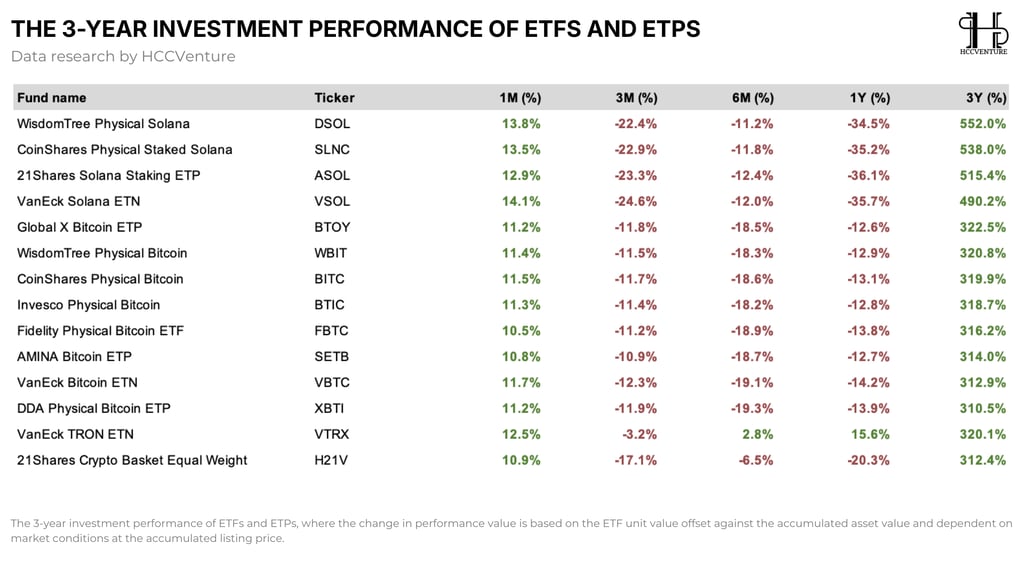
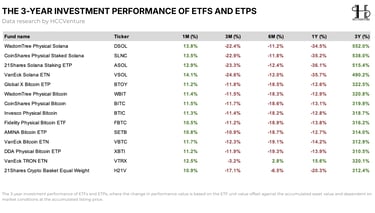
This 3-year performance chart highlights the stark differences between the two main asset classes in the crypto ETF ecosystem. Solana not only excels in long-term cumulative returns ( 1.5–1.7 times higher than Bitcoin ) but also maintains strong short-term growth ( +13–14% in 1 month ), thanks to staking yields and the growth of the DeFi ecosystem.
Conversely, Bitcoin demonstrates its role as "digital gold" with more stable performance, less extreme short-term volatility, and remains the core allocation choice for institutional investors. This disparity clearly explains the ongoing rotation trend: institutional capital continues to flow strongly into Bitcoin through low-fee products like IBIT and FBTC , but some capital is shifting to Solana in search of higher growth, as seen in the AUM by Asset Class chart ( +18% for SOL ) and the Recommended List ( Solana ETPs with a potential price increase of 12–12.5% ).
One notable point is that the short-term (1M) performance of most ETFs has turned positive ( ~10%–14% ), while the 3M and 6M timeframes remain deeply negative. This signals that the market may be in an early recovery phase , as prices begin to rebound after a long correction cycle. However, the fact that the 3M and 6M timeframes remain strongly negative also underscores that the uptrend has not yet been fully confirmed at the medium-term level.
Overall, the data confirms that the crypto ETF market is no longer entirely dependent on Bitcoin but is forming a multi-tiered structure with Bitcoin as a stable foundation, Ethereum as a bridge, and Solana as a growth engine. This allows for more flexible allocation of institutional capital, reduces concentration risk, and enhances the volatility resilience of the entire portfolio.
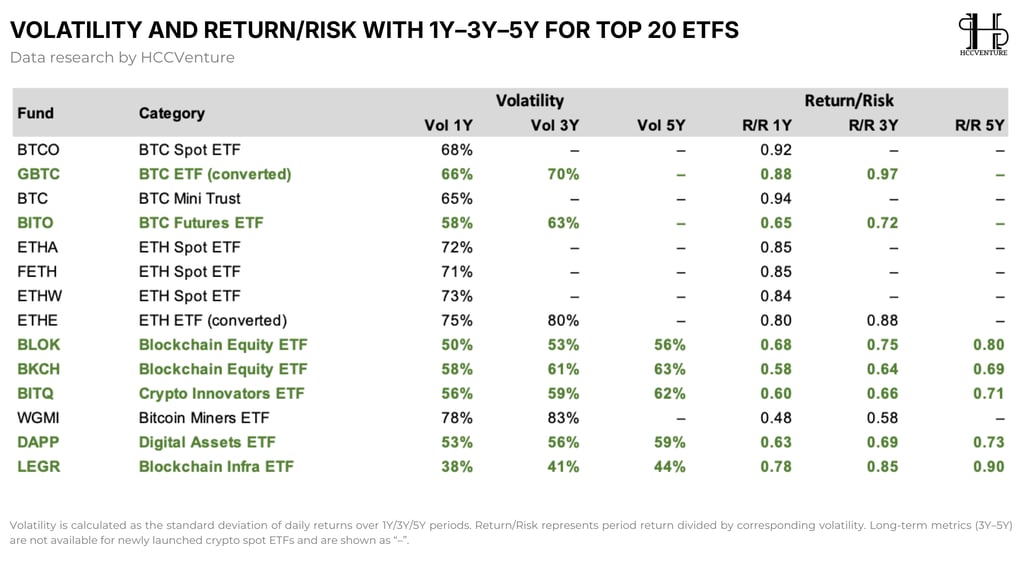
HCCVenture presents a volatility (standard deviation of daily returns) and Return/Risk (ratio of returns to volatility) analysis of the top 20 crypto ETFs/ETPs over 1-year, 3-year, and 5-year periods, providing crucial quantitative insights to assess the risk-reward quality of crypto investment channels via ETFs.
Spot ETFs ( BTC and ETH), despite their high volatility (65–75%), still offer superior returns/risks compared to futures or equity proxies. This indicates that institutional investors are accepting higher volatility in exchange for direct exposure to the underlying asset, rather than accepting indirect risk through miners or blockchain stocks.
The significant difference between spot ETFs (Return/Risk 0.84–0.94) and futures ETFs like BITO (only 0.65–0.72) explains why institutional capital continues to flow strongly into IBIT , FBTC , ETHA , and FETH instead of derivative products. At the same time, the lower volatility of infra/blockchain ETFs (LEGR, BLOK) with good long-term Return/Risk suggests that some capital is seeking relative stability, but they remain less attractive compared to direct crypto exposure.
A very important perspective comes from the Blockchain Equity ETF and Digital Assets ETF group (BLOK, BKCH, BITQ, DAPP, LEGR). This group has significantly lower volatility (38%–63%) compared to the crypto spot, but the return/risk ratio is quite competitive, especially with a 5-year LEGR of approximately 0.90. This shows that "equity proxy" products are acting as an intermediary bridge for traditional capital flows , where investors want to expose themselves to crypto but with lower volatility.
However, the highest-risk group remains the Bitcoin Miners ETF (WGMI) with volatility as high as 78%–83% and a low return/risk ratio (~0.48–0.58). This reflects the leveraged nature of miners: returns depend not only on the BTC price but also on operating costs, hashrate, and industry competition. This is a highly speculative asset class rather than a strategic allocation.
Combined with previous charts, this data reinforces the trend of BlackRock and Fidelity leading inflows with their spot low-fee products offering balanced returns/risks, while Solana ETPs (despite high volatility) attract capital due to their superior long-term growth potential. The crypto ETF market is forming a clear structure: spot ETFs as the core, staking/yield products as the growth layer, and equity proxies as the supporting stability component.
Our review
The crypto ETF market has entered its second mature phase , most notably characterized by a shift from "hype-driven" to institutional-grade allocation . Total global AUM reached approximately $158.8 billion, with BTC accounting for 85% ($135 billion), ETH 13–14% ($21.5 billion), and SOL $1.4 billion. BlackRock IBIT dominates with approximately 45–47% market share and attracts 60–75% of daily inflows, creating a stable "money-making machine" from pension funds, endowments, and family offices.
The key point is that the premium/discount have converged closely to NAV (Grayscale discount narrowed sharply to just -0.4% to -0.5% on April 26), NAV/mNAV are almost equal, and arbitrage is working perfectly – this is a sign that the market has sufficient liquidity and efficiency to allow large-scale institutional capital allocation without worrying about slippage or hidden fees.
Recent ETF inflows show clear short-term cyclical patterns, but the medium-term trend remains positive. The beginning of March saw strong inflows (peaking at approximately $768 million/week for BTC ETFs), but outflows reappeared in late March and early April. Importantly, however, these outflows were not systemic , primarily coming from BTC and ETH, while altcoin ETFs maintained relatively positive inflows. This reinforces the argument that capital is being reallocated rather than withdrawn from the crypto market.
At the micro level, cost basis data shows that the majority of ETF investors are holding BTC at an average cost basis around $70,000–$80,000. With the current market price fluctuating below this cost basis, the market is in a state of "slight unrealized loss ," preventing a strong sell-off and creating a foundation for recovery if money flows back in. This is typical of the accumulation phase in a cycle.
The main risk doesn't lie in the ETF itself but in the macros (Fed interest rates, geopolitics, tariffs). However, with BlackRock/Fidelity having built a massive distribution network and the ETF market maturing (perfect arbitrage, narrowing discounts), capital flows will be more resilient to short-term fluctuations. In the long term (12–24 months), crypto ETFs will officially become a core asset class in institutional portfolios, equivalent to gold ETFs or bond ETFs today. The growth potential remains clearly bullish , with the base case scenario being BTC/ETH/SOL continuing to receive sustainable inflows, volatility gradually decreasing due to increased liquidity, and Solana leading altcoin rotation.
In short, this is no longer about retail FOMO but about sustainable institutional adoption . Investors should prioritize low-fee spot products (IBIT, FBTC, ETHA, ASOL…) and closely monitor the rotation to SOL to optimize risk-reward. The market is in an extremely favorable position to continue expanding in scale and depth in 2026–2027.
Disclaimer: The information presented in this article is the author's personal opinion in the field of cryptocurrency. This is not financial or investment advice. All investment decisions should be based on careful consideration of your personal portfolio and risk tolerance. The views expressed in this article do not represent the official stance of the platform. We recommend that readers conduct their own research and consult with experts before making any investment decisions.
Compiled and analyzed by HCCVenture
Follow HCCVenture here: https://linktr.ee/holdcoincventure
Explore HCCVenture group
HCCVENTURE QUANT JSCO
© 2026 HCCVENTURE. ALL COPYRIGHTS RESERVED.


Connect with us
Popular content
Contact to us
Address: 8th Floor, Bach Dang Complex Building, 50 Bach Dang Street, Hai Chau Ward, Da Nang City, Vietnam.
Phone: 1900 1509
Gmail : sp_contact@hccventure.com
Disclaimer: The information on this website is for informational purposes only and should not be considered investment advice. We are not responsible for any risks or losses arising from investment decisions based on the content here.
TERMS AND CONDITIONS • CUSTOMER PROTECTION POLICY
ANALYTICAL AND NEWS CONTENT IS COMPILED AND PROVIDED BY EXPERTS IN THE FIELD OF DIGITAL FINANCE AND BLOCKCHAIN BELONGING TO HCCVENTURE ORGANIZATION, INCLUDING OWNERSHIP OF THE CONTENT.
RESPONSIBLE FOR MANAGING ALL CONTENT AND ANALYSIS: HCCVENTURE FOUNDER - TRUONG MINH HUY
Read warnings about scams and phishing emails — REPORT A PROBLEM WITH OUR SITE.