


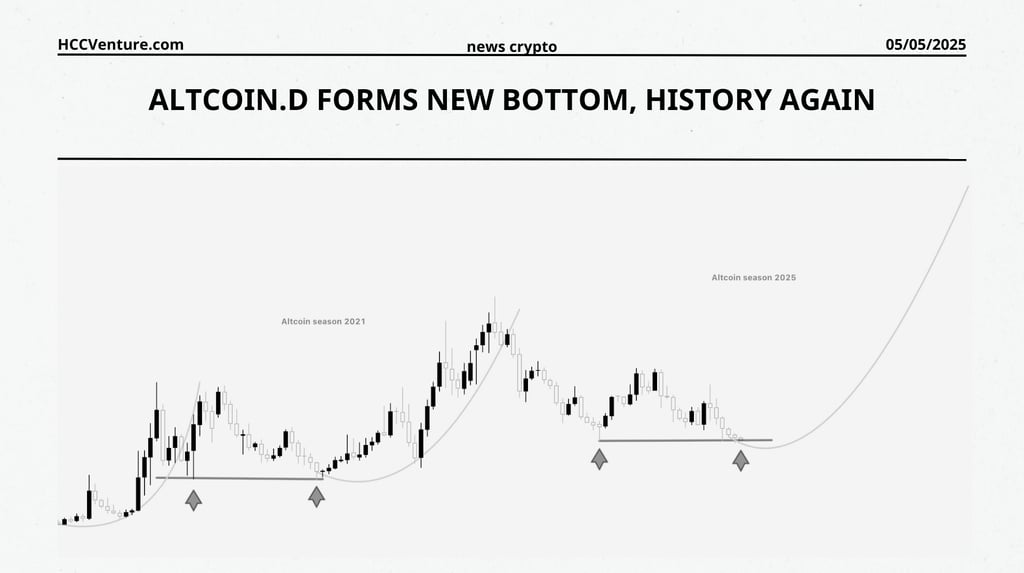
Altcoin Dominance Index Analysis – Entering the 2025 Altseason Cycle?
Altcoin Dominance typically bottoms around the 7%–8% zone (gray arrows), which is a historically strong support zone, confirmed in 2016, 2019, and 2023–2024. Currently, the Dominance index has touched this support zone again.
5/5/20252 min read
Overview and Role of Altcoin Dominance
The Altcoin Dominance Index represents the percentage of the market capitalization of Altcoins (excluding Bitcoin) compared to the entire cryptocurrency market. This is an important tool to measure the relative strength of Altcoins compared to Bitcoin , and is also an early warning signal of the emergence of an “Altcoin Season” – a period in which Altcoins have a growth rate that is superior to BTC.
Based on the provided chart, it is possible to see a clear cyclical appearance of Altcoin Dominance, where bottoms (pivots) form before each strong Altcoin growth, typically the periods of 2017 and 2021. Current technical signals suggest that the market is forming a similar pattern and may enter a new Altcoin season in 2025 .
Technical analysis data and money flow behavior
Historical Hard Support Levels and Repeating Patterns
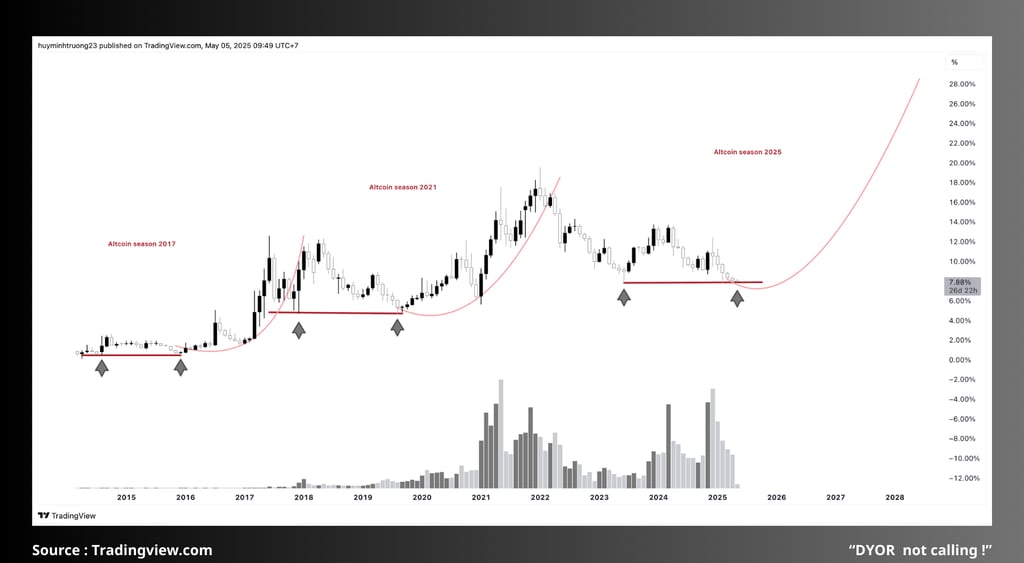
Looking at the chart, we see that Altcoin Dominance usually bottoms around the 7%–8% area (gray arrows), which is a historically strong support area, confirmed in 2016, 2019, and 2023–2024. Currently, the Dominance index has touched this support area again and is showing signs of forming a short-term bottom at 7.88% – equivalent to the bottom before previous booms.
The red curve (parabolic curve pattern) drawn on the chart suggests that Altcoin Dominance is in the early stages of a new bull cycle. If history repeats itself, we can expect Dominance to reach above 25%–28% at the cycle top, similar to the levels recorded during the 2017 and 2021 Altseasons.
Trading volume and cash flow expectations
Notably, in previous Altseasons, Altcoin trading volume also increased sharply , creating a liquidity explosion and attracting new money. On the chart, the volume bars show that there has been a slight increase in liquidity in recent months, right at the bottom. This is often an early signal of smart speculative money starting to accumulate.
In addition, the recent Bitcoin halving event (April 2024) often acts as the opening step for a new cycle in the cryptocurrency market. After the halving, BTC often increases sharply first, then the money flow will rotate to Altcoins when BTC starts to move sideways or adjust slightly , creating ideal conditions for Altcoins to develop outstandingly.
Evaluation and Conclusion
Based on technical analysis signals and historical data:
Altcoin Dominance has hit the 7.88% hard support zone , similar to the bottoming stages before Altseason 2017 and 2021.
The cyclical structure is repeating , with the parabolic pattern suggesting strong upside potential to the 25–28% range over 2025–2026.
Trading volume shows signs of recovery , showing that speculative money is starting to return to Altcoin.
The macro environment and institutional money are still tilted towards Bitcoin , however this is typically an early cycle characteristic. As BTC slows down, Altcoins often become the next target for money.
With the above factors, Altseason 2025 is entirely possible , especially in the second half of 2025 when Bitcoin stabilizes and market sentiment shifts to seeking higher yields from riskier assets.
Join the HCCVenture community to get the latest market information. Once again, we give our opinion on potential projects in the crypto market. This is not investment advice, consider your portfolio. Disclaimer: The views expressed in this article are solely those of the author and do not represent the platform in any way. This article is not intended to guide investment decisions.
API & Data : Tradingview
Compiled and analyzed by HCCVenture
Join our telegram community: HCCVenture
Explore HCCVenture group
HCCVenture © 2023. All rights reserved.


Connect with us
Popular content
Contact to us
E-mail : sp_contact@hccventure.com
Register : https://linktr.ee/holdcoincventure
Disclaimer: The information on this website is for informational purposes only and should not be considered investment advice. We are not responsible for any risks or losses arising from investment decisions based on the content here.
TERMS AND CONDITIONS • CUSTOMER PROTECTION POLICY
ANALYTICAL AND NEWS CONTENT IS COMPILED AND PROVIDED BY EXPERTS IN THE FIELD OF DIGITAL FINANCE AND BLOCKCHAIN BELONGING TO HCCVENTURE ORGANIZATION, INCLUDING OWNERSHIP OF THE CONTENT.
RESPONSIBLE FOR MANAGING ALL CONTENT AND ANALYSIS: HCCVENTURE FOUNDER - TRUONG MINH HUY
Read warnings about scams and phishing emails — REPORT A PROBLEM WITH OUR SITE.